It is always easier to call for a market action after it takes place. This is called hindsight bias. Technical analysts look at several charts per day/week, go through different markets, time frames and analyze vast amount of data. While looking back at a chart pattern it can appear so predictable that we often ask ourselves how we missed that move. However, the toughest application of technical analysis comes into play when dealing with these patterns in real-time and actively managing your risk as the patterns unfold.
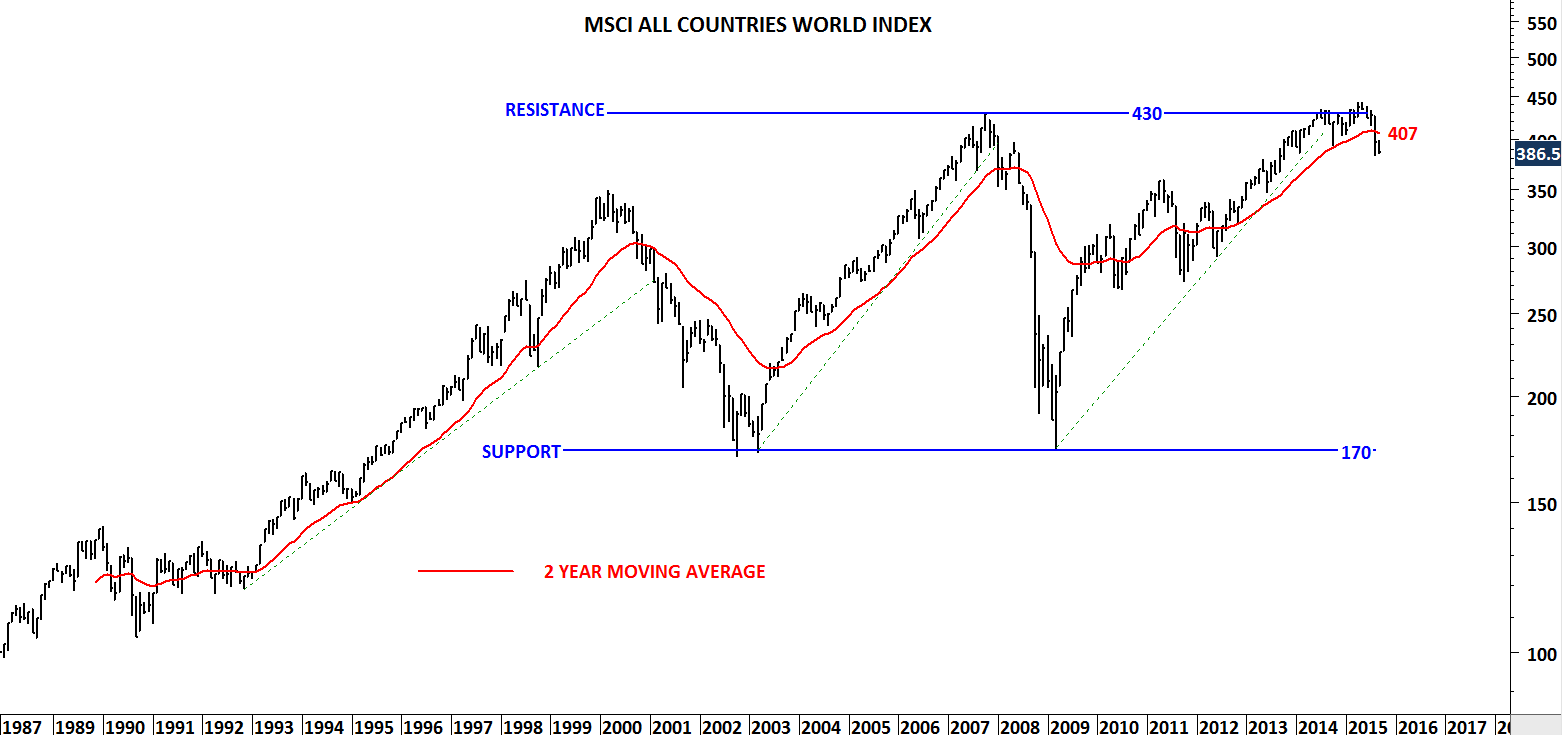
I have been following the two major MSCI indices, MSCI All Countries World Index and MSCI Emerging Markets Index for some time. In my previous post in November I analyzed these two charts with the same template and since then the markets have moved sideways and there has been no change in the technical outlook.
(http://techcharts.wordpress.com/2011/11/07/msci-acwi-msci-em-2/)
2012 started with volatile price movements in most of the markets. Two indices above might be forming 2 year-long H&S top formations and in these H&S tops we might be in the process of completing the right shoulders. This would be extremely bearish for the equity markets. Confirmation of this bearish scenario would need a major breakdown below 850 levels on the MSCI EM and 265 levels on the MSCI ACWI.
When a H&S pattern fails it is usually followed by a major counter trend. H&S pattern fails when the price exceeds the highest level of the right shoulder. In this case 200 day moving averages will play a major role in deciding if 2012 will be a good or bad year for the world equity markets. We all know that both indices are below their 200 day moving averages and this has been the case since August 2011. If we were to reverse this trend by breaking above the 200 day moving averages this would also fail the 2 year-long H&S top formations and would be a bullish signal for 2012.
Then it boils down to 2 critical technical levels which are not far from today’s closes; 200 day moving averages as major resistance (310-320 area for MSCI ACWI) and (1000-1050 area for MSCI EM), necklines of the H&S patterns as major support (265 for MSCI ACWI) and (850 for MSCI EM)