Posts

GLOBAL EQUITY MARKETS – April 1, 2017

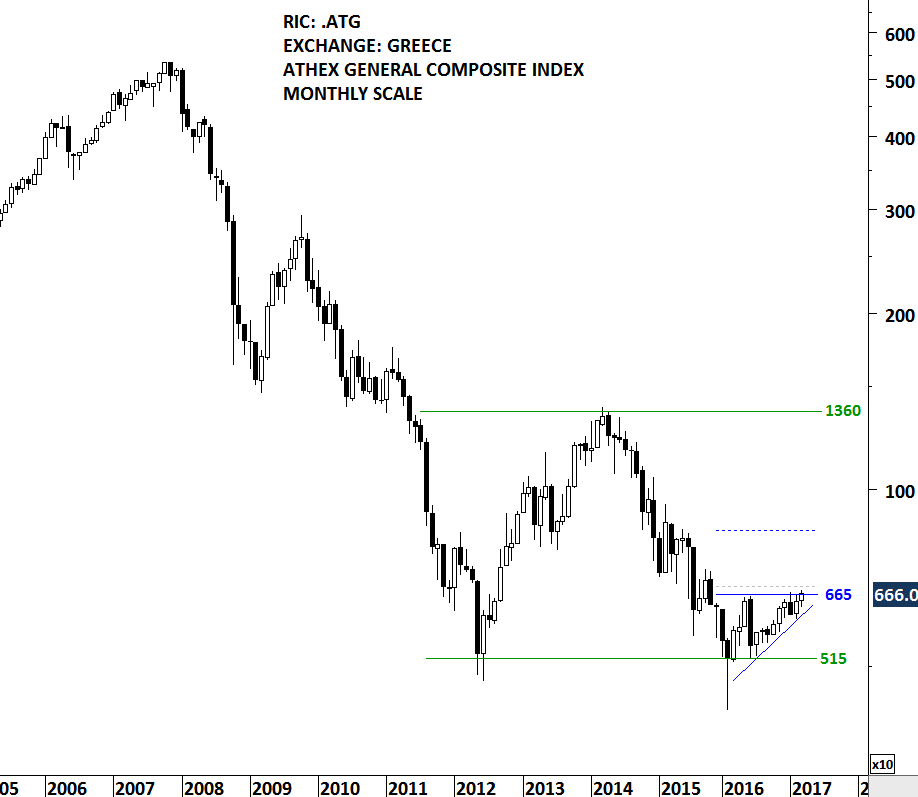
After several years of downtrend and a major bear market, Greek equities can offer great opportunities in the following weeks/months. This week's update features two benchmark equity indices from Greece. Athens General Composite index with a long-term view and FTSE Athex Market index with the latest bullish chart development. In the beginning of 2016, Athens General Index rebounded from the lows of 2012. Over the past year the index remained sideways in a choppy trading range. Last one year's range bound price action is possibly a bullish ascending triangle with the horizontal boundary standing at 445 levels for the FTSE Athex Market Index and at 665 levels for the Athens General Composite index. The upward sloping lower boundary of the ascending triangle gives the chart pattern its bullish bias. Higher lows is indicative of increasing demand. A daily close above 460 levels on the FTSE Athex Market Index will confirm the breakout from the year-long ascending triangle with a possible price target of 580 levels.

ATHENS GENERAL INDEX (.ATG)

Read More

GLOBAL EQUITY MARKETS – March 25, 2017

Global equity markets continue to offer great opportunities and text book chart pattern developments. In this update I bring to your attention well-defined chart patterns from Asia, Europe, North America and Emerging Markets that are candidates for possible breakouts and I also report fresh breakout alerts. Before we move on to equity markets, I want to draw your attention to a possibility developing in the interest rates and bonds market. During the weekly review of financial markets, I spotted the similar chart development on almost all kinds of bond market ETFs.

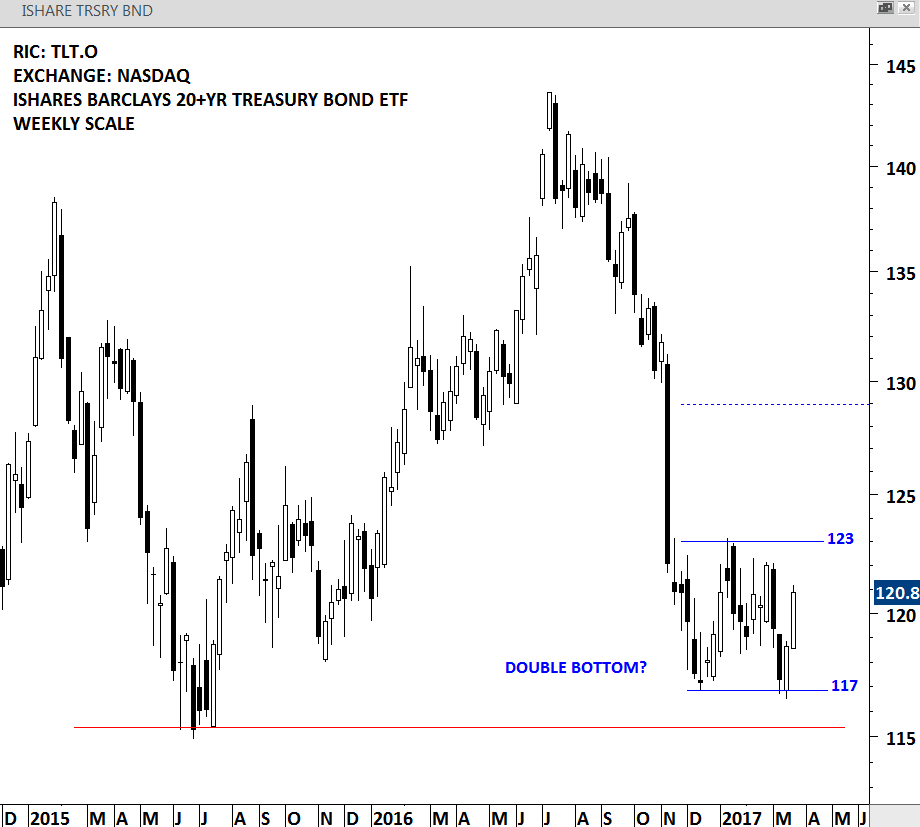
ISHARES BARCLAYS 20+YR TREASURY BOND ETF (TLT.O)

ISHARES BARCLAYS 20+YR TREASURY BOND ETF is an exchange traded fund listed on the Nasdaq Stock Exchange. The Fund seeks investment results that correspond generally to the price and yield performance of the long-term sector of the U.S. Treasury market as defined by the Barclays Capital 20+ Year Treasury Index. Price chart of this ETF is possibly forming a 4 month-long double bottom. This chart pattern is still at its early stages. The short-term consolidation remains between 117 and 123 levels. The low for the year 2015 stands at 115 as an other important medium/long-term support level. The latest chart development suggests that in the short/medium-term bonds might be finding support. Price should either break 117 levels on the downside or 123 levels on the upside for the chart pattern to complete.

Read More

GLOBAL EQUITY MARKETS-04/02/2017

A volatile trading week finished with a strong close on Friday for most of the global equity indices. Russell 2000 index serves as a benchmark for small-cap stocks in the United States. With Friday’s strong close, once again the index reached the upper boundary of its tight consolidation range. Breakout on Russell 2000 index could bode well for the equity market performance in the coming weeks. Strong short-term resistance stands at 1,385 levels.

RUSSELL 2000 INDEX - DAILY SCALE

RUSSELL 2000 INDEX – DAILY SCALE

European equities hold on to their gains following the strong breakout in late 2016. STOXX 600 index cleared the 350 levels with a strong weekly bar in December 2016 and completed a year-long base formation. Over the past month, the STOXX 600 index remained in a tight range between 360 and 367 levels possibly forming a bullish flag. A flag is usually considered a pause in a trend period and classified as a continuation chart pattern. Breakout above 367 levels should resume the uptrend in the European equities.

EURO STOXX 600 - WEEKLY SCALE

EURO STOXX 600 – WEEKLY SCALE

EURO STOXX 600 - MONTHLY SCALE

EURO STOXX 600 – MONTHLY SCALE

I shared several updates on the Turkish equities both on twitter and on the Tech Charts blog. As I go through several charts every week, I look for price action with well-defined boundaries, preferably forming an identifiable and mature chart pattern. Breakouts from these type of chart setups usually yield strong trend periods in the direction of the breakout. Turkey’s BIST 100 equity benchmark index is one of the best looking chart setup in the Emerging Market opportunity set. Breakout from the 3 year-long symmetrical triangle can result in a strong uptrend targeting 121K levels. Turkey BIST 100 index is setting up for a breakout that could result in a multi-month trend.

TURKEY BIST 100 INDEX - MONTHLY SCALE

TURKEY BIST 100 INDEX – MONTHLY SCALE

Several great chart setups made it to the #TECHCHARTSWATCHLIST this week from Asia, Europe and the U.S. The length of the identifiable chart patterns range from minimum 4 months to maximum 2 years. I prefer those chart patterns with horizontal boundaries but also pay close attention to mature symmetrical triangles. Head and shoulder tops/bottoms, rectangles and ascending/descending triangles are the classic chart patterns with horizontal boundaries.

MAXITRANS INDUSTRIES (MXI.AX)

MAXITRANS INDUSTRIES is a small-cap stock listed on the Australia Stock Exchange. The company is engaged in the design, manufacture, sale, service and repair of transport equipment and related components, and spare parts. Price chart formed a 2 year-long complex H&S bottom with the strong horizontal resistance standing at 0.645 levels. A daily close above 0.665 levels will confirm the breakout from the bullish reversal chart pattern with a possible price target of 0.90. Stock is testing the horizontal resistance for the 5th time over the past 2 years.

MAXITRANS - WEEKLY SCALE

MAXITRANS – WEEKLY SCALE

SOFINA SA (SOF.BR)

SOFINA  is a Belgium-based holding company that invests, directly and indirectly, in companies from various sectors. Price chart formed a 5 month-long rectangle with the resistance standing at 128.75 levels. Stock is going through a historical low volatility period and usually breakouts from these type of conditions result in strong price action. A daily close above 131 levels will confirm the breakout from the bullish continuation chart pattern.

SOFINA - WEEKLY SCALE

SOFINA – WEEKLY SCALE

888 HOLDINGS (888.L)

888 Holdings Public Limited Company is a provider of online gaming entertainment and solutions. The company is listed on the London Stock Exchange. Price chart of 888 Holdings formed a year-long rectangle with the strong horizontal resistance at 233.5 levels. This week’s strong weekly close breached the horizontal resistance. Edwards and Magee in their book Technical Analysis of Stock Trends suggest that a stock should breakout by a min 3% margin above the resistance for a clear chart pattern breakout signal. According to this guideline, a daily close above 240.65 levels will confirm the breakout from the year-long rectangle. Rectangle chart pattern price target stands at 280 levels.

888 HOLDINGS - WEEKLY SCALE

888 HOLDINGS – WEEKLY SCALE

ENTERTAINMENT ONE LTD. (ETO.L)

Entertainment One Ltd. is an independent entertainment company listed on the London Stock Exchange. The Company is focused on the acquisition, production and distribution of television, family, film and music content rights across all media across the world. Price chart formed a 5 month-long symmetrical triangle that should breakout soon. A daily close above 250 levels will confirm the breakout from the tight consolidation range and possibly target 305 levels.

ENTERTAINMENT ONE - WEEKLY SCALE

ENTERTAINMENT ONE – WEEKLY SCALE

KURA CORP (2695.T)

KURA CORP is a consumer cyclical company listed on the Tokyo Stock Exchange. Price chart of KURA CORP formed a year-long H&S top, a bearish reversal chart pattern. The strong horizontal support stands at 4,560 levels. The support was tested for 5 times over the past year. A daily close below 4,425 levels will confirm the bearish reversal chart pattern with a possible price target of 3,000. The symmetry between the shoulders and also several tests of the horizontal support makes this a text-book H&S top.

KURA CORP - WEEKLY SCALE

KURA CORP – WEEKLY SCALE

FLEXSHARES INTERNATIONAL QUALITY DIVIDEND INDEX FUND (IQDF.K)

The Fund seeks investment results that correspond generally to the price and yield performance, before fees and expenses, of the Northern Trust International Quality Dividend Index. The underlying index is designed to provide exposure to a high-quality, income-oriented portfolio of international equity securities. It’s geographical focus is global ex U.S. The fund is listed by NYSE Arca. Price chart formed a 16 month-long H&S bottom or possibly an ascending triangle that could act as a bottom reversal. The strong horizontal resistance stands at 23.35 levels. A daily close above 23.75 levels will confirm the breakout from the multi-month base formation with a possible price target of 27 levels.

FLX INTL DEF - WEEKLY SCALE

FLX INTL DEF – WEEKLY SCALE

BOYD GAMING (BYD)

Boyd Gaming Corporation is a multi-jurisdictional gaming company. The company is listed on the NYSE. Price chart formed a year-long ascending triangle with the strong horizontal boundary standing at 21.30 levels. Ascending triangle is considered to be a bullish continuation chart pattern. A daily close above 21.95 levels will confirm the breakout after the 5th test of the upper boundary over the past year. Price target for the ascending triangle stands at 28 levels.

BOYD GAMING - WEEKLY SCALE

BOYD GAMING – WEEKLY SCALE

SPDR S&P BIOTECH ETF (XBI)

The Fund seeks to replicate as closely as possible the performance of an index derived from the biotechnology segment of a U.S. total market composite index. The Fund uses a passive management strategy designed to track the total return performance of the S&P Biotechnology Select Industry Index. SPDR S&P BIOTECH ETF is listed on the NYSE. Price chart formed a 4 month-long symmetrical triangle with the upper boundary at 66 levels acting as resistance. A daily close above 67.35 levels will confirm the breakout from the sideways consolidation.

SPDR S&P BIOTECH ETF -WEEKLY SCALE

SPDR S&P BIOTECH ETF -WEEKLY SCALE

MULTIPOLAR TBK (MLPL.JK)

PT Multipolar Tbk is an Indonesia-based investment holding company. The company is listed on the Jakarta Stock Exchange. Price chart formed a 9 month-long symmetrical triangle following a sharp rise in the first quarter of 2016. The upper boundary of the symmetrical triangle stands at 406 levels. A daily close above 418 levels will confirm the breakout from the consolidation range and suggest higher levels for the stock in the coming weeks.

MULTIPOLAR TBK - WEEKLY SCALE

MULTIPOLAR TBK – WEEKLY SCALE

Breakouts from bullish chart patterns to all time high levels are signals a trader can’t ignore. Breakout to all time high level means that the stock doesn’t have any resistance ahead. Completion of a bullish chart pattern itself is a positive technical signal. There has been two chart pattern breakout signals that met the above conditions and made it to the #TECHCHARTSALERT this week.

SJR IN SCANDINAVIA AB (SJRb.ST)

SJR is a small-cap Sweden-based staff recruitment company primarily focusing on the economic, banking and financial sectors. Price chart completed a 2 year-long rectangle followed by the breakout from the short-term 4 month-long rectangle. SJR IN SCANDINAVIA is at all-time high levels. Possible price target for the rectangle chart pattern stands at 48 levels.

SJR - WEEKLY SCALE

SJR – WEEKLY SCALE

CINEWORLD GROUP (CINE.L)

CINEWORLD GROUP is a consumer cyclical company listed on the London Stock Exchange. Price chart completed a 16 month-long cup & handle chart pattern and broke out to all-time high levels. Cup & handle is a bullish continuation chart pattern and has a possible price target of 720 levels.

CINEWORLD GROUP - WEEKLY SCALE

CINEWORLD GROUP – WEEKLY SCALE

TURKIYE VAKIFLAR BANKASI (VAKBN.IS)

Turkiye Vakiflar Bankasi TAO (Vakifbank) is a Turkey-based commercial bank. The company is listed on the Istanbul Stock Exchange. Price chart completed a 3 year-long symmetrical triangle followed by a medium-term 9 month-long symmetrical triangle. These are clearly bullish signals for the stock. Possible price target for the 9 month-long symmetrical triangle stands at 6 levels.

VAKIF BANK - WEEKLY SCALE

VAKIF BANK – WEEKLY SCALE

EURO STOXX 600, NIKKEI and MSCI ACWI

After reviewing the charts I posted two weeks ago on Euro Stoxx 600 and MSCI ALL COUNTRIES WORLD INDEX, I can conclude that since then there has been more technical damage on global equity indices. Until markets recover above previously broken support levels, we should watch out for further downside in the global equity markets. In other words I’ll treat the current market conditions as a bear market.

Markets seldom move in straight lines. Earlier price action on Euro Stoxx 600 shows how two different bear markets unfolded in 2001 and 2008. 330-340 area will remain as strong resistance. Both the 7 year-long uptrend and the long-term moving average are breached on the downside. Rebounds should be considered as bear market rallies.

EUROSTOXX 600 INDEX

Monthly price chart of EURO STOXX 600 INDEX

EUROSTOXX 600 INDEX II

Weekly price chart of EURO STOXX 600 INDEX

It clearly takes more effort to change the direction of the trend on MSCI ALL COUNTRIES WORLD INDEX when the global equity benchmark includes 23 developed and 23 emerging market equity index performance. So far it has given us a bearish message. 374-400 area will remain as strong long-term resistance. Failure to recover above 374 levels will resume the downtrend.

MSCI ALL COUNTRIES WORLD INDEX I

Monthly price chart of MSCI ALL COUNTRIES WORLD INDEX

MSCI ALL COUNTRIES WORLD INDEX II

Weekly price chart of MSCI ALL COUNTRIES WORLD INDEX

MSCI Emerging markets index is in a clear downtrend. The downtrend can accelerate. Index broke down decade-long trend line support and also the 5 year-long horizontal support at 850 levels. It is usually difficult to reverse momentum after such significant breakdowns.

MSCI EM

Monthly price chart of MSCI EMERGING MARKETS INDEX

Sell-off in Japan has been sharp over the past few weeks. Two strong technical supports overlapping at 17,000 levels has been broken on the downside. While we can conclude that in the short-term the market is oversold, it will need a lot of effort for the market to reverse the negative sentiment and recover above 17,000 levels. This market is also suggesting weak performance for the coming months.

NIKKEI 225 INDEX

Weekly price chart of NIKKEI 225 index

UK FTSE 100, STOXX 50, NIKKEI 225

Global equity indices are gaining upside momentum. Recent breakouts above long-term trend lines suggest multi-month uptrends. Last week's price action pushed UK FTSE 100 index to all time high levels. Charts that are very close to long-term breakouts: MSCI ALL COUNTRIES WORLD INDEX, EURO STOXX 50 INDEX and UK FTSE 100 INDEX.

Positive price action is likely to continue in the developed market equities.

JAPAN NIKKEI 225 INDEX

Read More

NIKKEI 225 & EURO STOXX 50

When Japan’s Central Bank announced its QE program in April 2013 it was a big surprise for the public at least according to the way some of the mainstream media announced it. The Independent wrote “Japan tries shock and awe to jump-start stalled economy”. At the time Japan had already elected a new government which signaled monetary easing.

I reviewed the top 5 names in the widely followed Japanese equity benchmark – Nikkei 225. Most of the names anticipated the monetary easing and broke out of their multi-year base formations. When the QE was announced it was a confirmation for the market rather than a surprise. Below are the top 5 names from the Nikkei 225. Markets are discounting mechanisms.

TOYOTA MOTORS

MITSUBISHI

SOFTBANK

NTT DOCOMO

NTT

When a trade is assigned %100 probability of success, I start getting uncomfortable. I look around and see almost certainty for an event to occur… this becomes a case study for me. European Central Bank’s Quantitative easing is now being announced by the mainstream media as almost a certain event. I reviewed the top names in the Euro Stoxx 50 index to see if the market is anticipating this almost sure event. What I find is a bit different from the Japanese QE announcement. None of the names except UNILEVER is preparing for a breakout. Some of the names are overbought and some are showing significant weakness.

Take this update as a case study and not as a forecast. My conclusion for the top European stocks is that there is no clear anticipation of QE that would spill over to result in further equity gains. Below are the largest market cap stocks in the Euro Stoxx 50 index. I welcome any thoughts on this.

NOVARTIS

ROCHE HOLDING

NESTLE

ROYAL DUTCH

AB INBEV

SANOFI

HSBC HOLDINGS

UNILEVER

DAX, RUSSELL 2000, NIKKEI, STOXX 50

Global equity markets are experiencing significant weakness. I shared several updates over the past few weeks and updated the latest charts on twitter. It is important to share these updates with Tech Charts followers on different platforms. I’m adding latest tweets below.

NIKKEI, STOXX and FTSE

It is the time to take a more defensive stance in the global equity markets. MSCI All Countries World Index which includes the performance of developed and emerging markets, found resistance at 430 levels and reversed. MACD, a momentum indicator is generating a sell signal on the monthly scale chart. These are all bearish signals.

MSCI ALL COUNTRIES WORLD INDEX

STOXX 50 index found resistance at 14 year-long trend line at 3,100 levels. It needed a lot of momentum to clear such hurdle and it looks like the European equity benchmark failed to clear the strong multi-year resistance. Strong resistance remains at 3,100 levels.

STOXX 50 INDEX

Japan’s NIKKEI 225 index failed to clear 16,500 levels, another multi-year resistance. Index can pull back to its 2 year-long average at 14,000 levels. For now the market doesn’t have the strength to clear the strong long-term resistance.

NIKKEI 225 INDEX

UK’s FTSE 100 index reversed from strong multi-year resistance at 6,880 levels. The index failed to breakout to all-time high levels. Resistance remains at 6,880. Breakdown below the 2 year-long average at 6,400 levels can send the index towards 6,000 levels.

UK FTSE 100 INDEX

STOXX 50, NIKKEI and FTSE 100

Global equity markets are at a critical juncture. Most of the major equity benchmarks are testing multi-year trend resistances. These are decade-long trend lines and if they are broken on the upside, it will signal further equity market strength for coming years.

STOXX 50 (includes UK companies), an equity benchmark for Europe, is testing 14 year-long trend resistance at 3,100 levels. While breakout would require a significant amount of energy (either positive news flow or expectation of positive economic outlook in the Euro zone), such price action (a decisive break above 3,100) will be extremely bullish for the European equities.

STOXX 50 INDEX

Japan’s Nikkei 225 index is testing a 20 year-long trend resistance at 16,500 levels. Decisive break above the strong multi-decade resistance will be extremely positive for the Japanese equities.

NIKKEI 225 INDEX

UK’s FTSE 100 index is now challenging historical high levels at 6,860. Breakout above the multi-decade horizontal resistance will also be a bullish signal for the global equity markets.

UK FTSE 100 INDEX

Last but not least, MSCI ALL COUNTRIES WORLD INDEX, which is a broad representation of global equity market performance is challenging historical high levels.

MSCI ALL COUNTRIES WORLD INDEX