Posts

S&P 500, STOXX 50, NIKKEI and FTSE 100

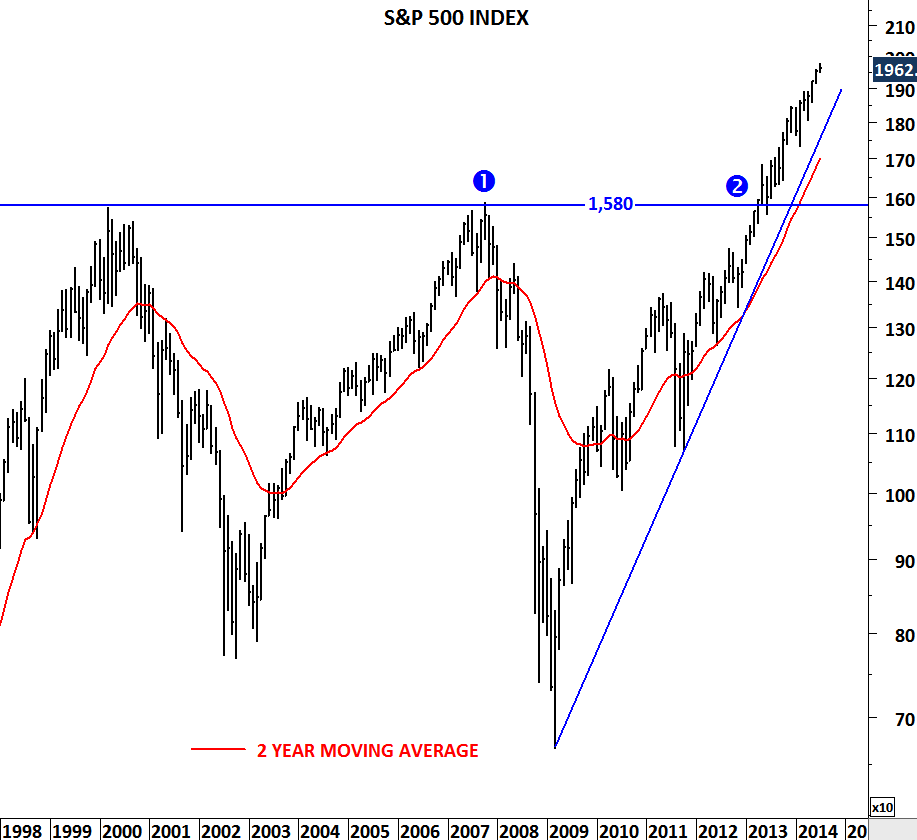
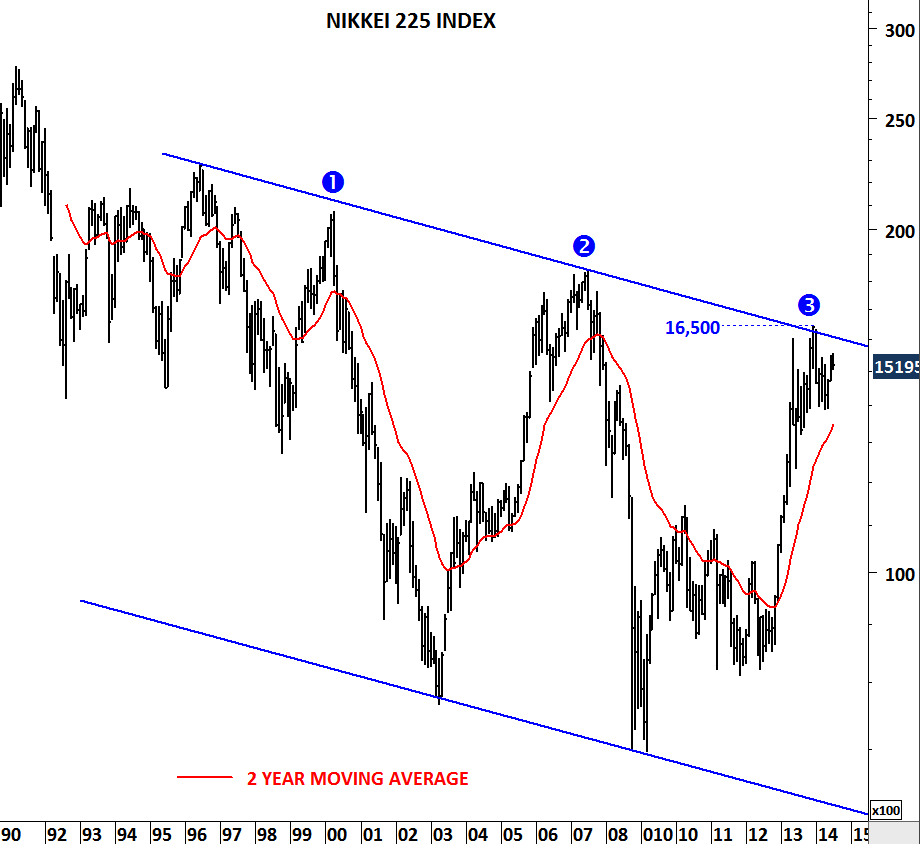
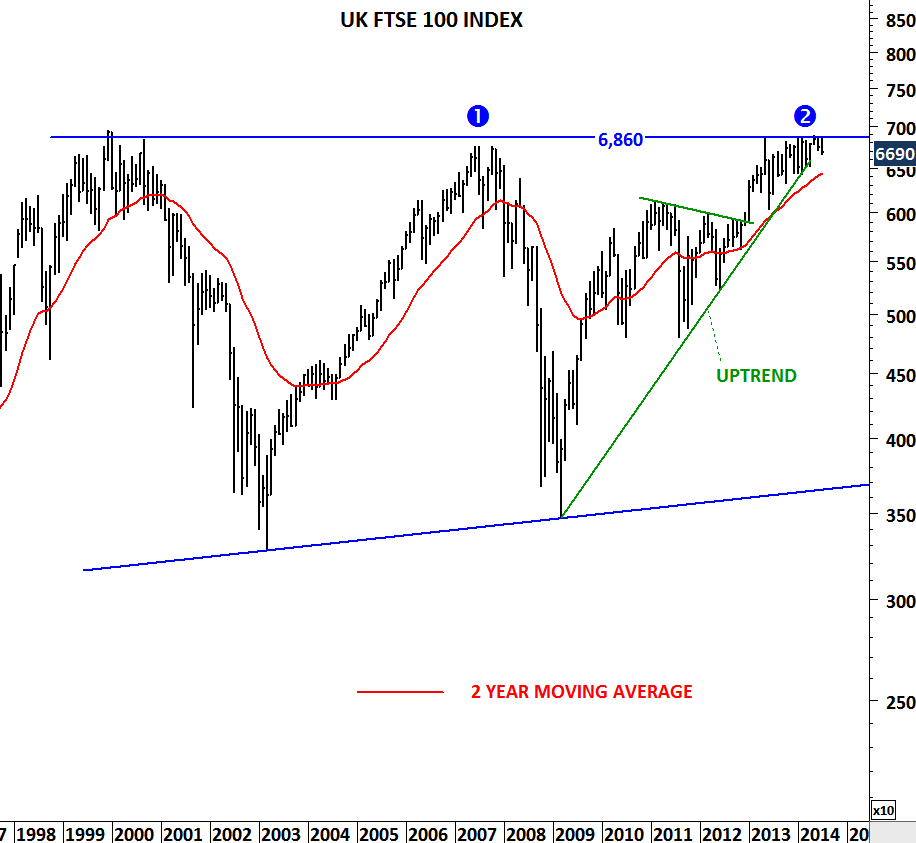
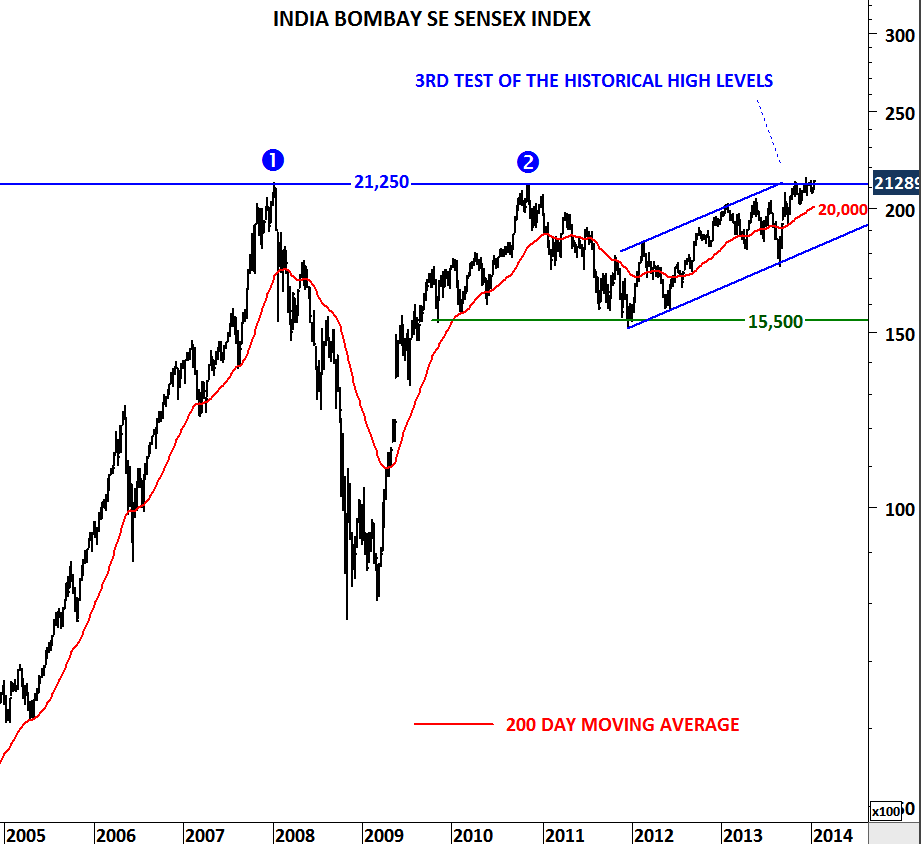
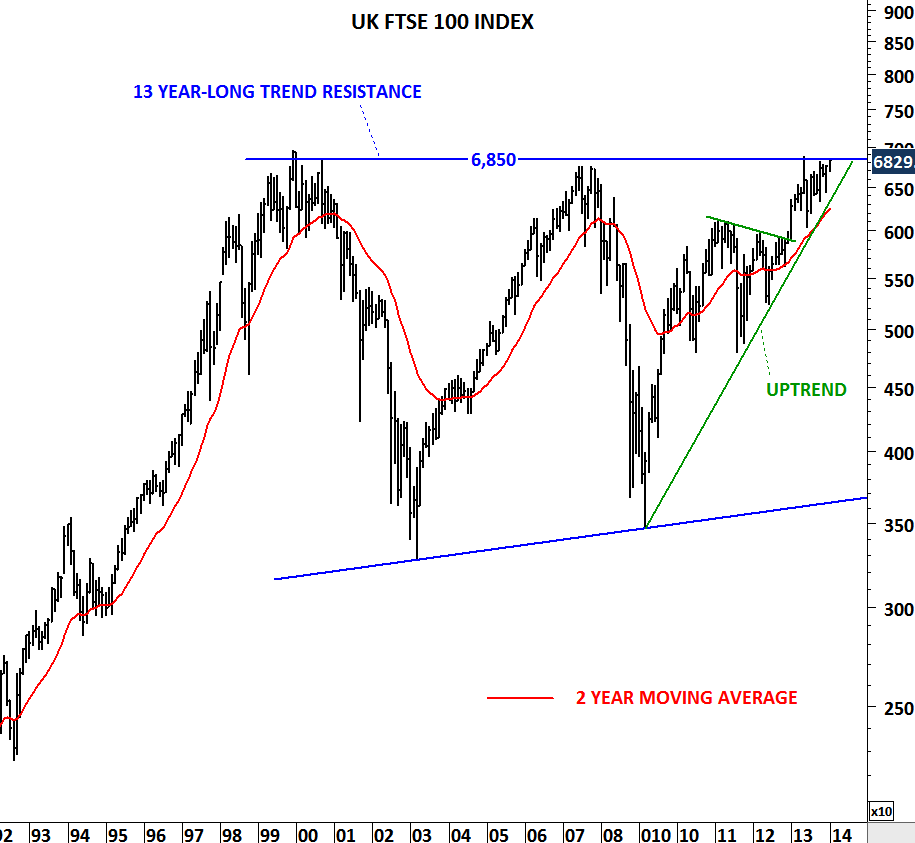
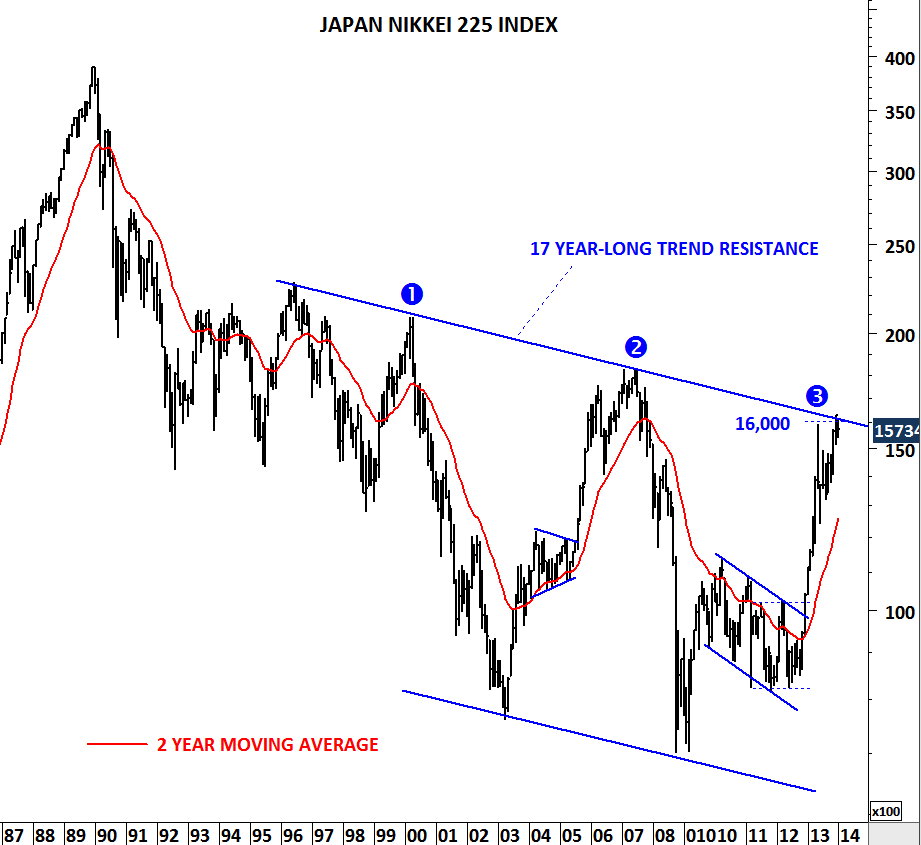
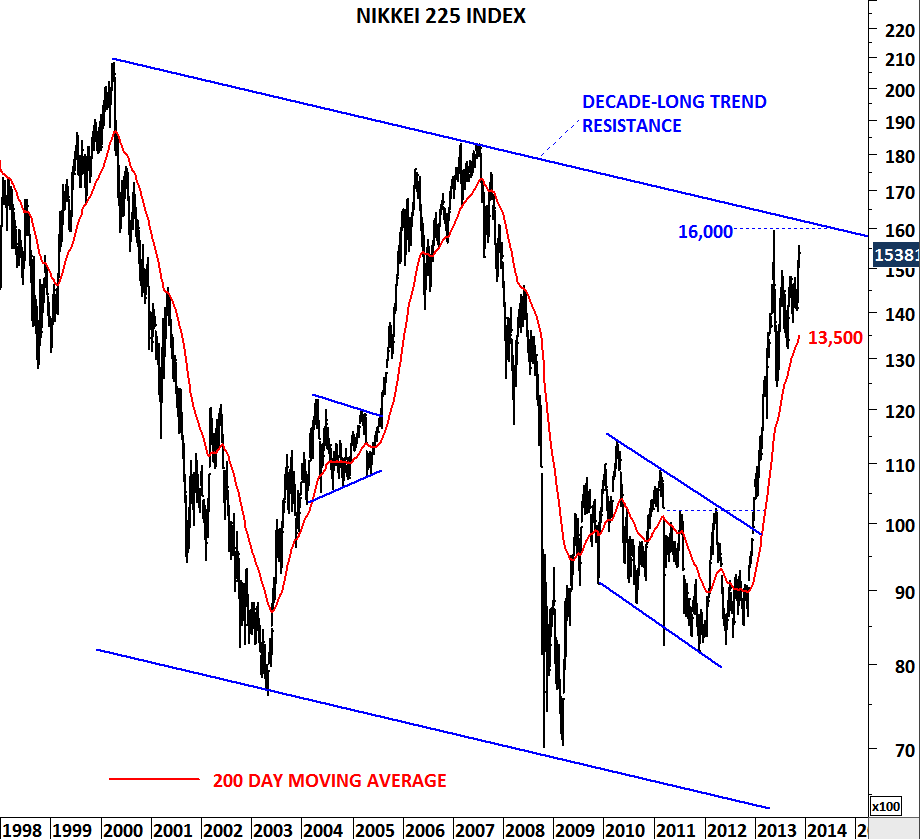
S&P 500 index cleared its historical high level at 1,580 levels. U.S. equities have clearly outperformed the rest of the global equity markets. So far so good… But without Japan, Europe and UK how far can the positive trend in equities reach? Long-term charts show that Stoxx 50, Nikkei 225 and FTSE 100 indices have reached strong long-term resistance levels. Only after a breakout above these long-term resistances will global equities have more fuel to resume their long-term uptrend. Failure to breakout from these consolidations in the following months can be negative for equity markets.

S&P 500 INDEX

EURO STOXX 50

NIKKEI 225 INDEX

UK FTSE 100 INDEX

DAX, NIKKEI and DJIA

For those who are not a big fan of twitter I’m posting my latest updates on global equity markets. I believe these are important charts and are worth reviewing again. Global equity markets are experiencing a correction. Long-term trends are still intact. Long-term 200-day averages will play a significant role in determining the next direction of the long-term trends.

INDIA, U.K. and JAPAN

Over the past few years equity markets had strong performance. Developed markets did better than the emerging markets but overall it has been positive for equity asset class. In this update I’m sharing with you 3 long-term charts that can be the center of attention in 2014. Possible breakouts in these 3 markets can add fuel to the equity strength in the following months. India’s BSE Sensex index, U.K. FTSE 100 index and Japan’s NIKKEI 225 index are testing their long-term trend resistances. Breakout above these long-term strong technical levels can result in a multi-month uptrend and attract more investors.

INDIA BSE SENSEX INDEX

UK FTSE 100 INDEX

JAPAN NIKKEI 225 INDEX

NIKKEI 225 INDEX

NIKKEI 225

16,000 level becomes more important for Japan’s Nikkei 225 index as the benchmark reaches the decade-long trend resistance. In May 2013, Nikkei 225 had a spike and tested the long-term resistance area. Sharp pullback to the 200-day average followed right after the strong rally. Now, the index is trying to reach the same trend resistance.  To be more bullish in this overextended market we should wait for confirmation and this confirmation should come with a decisive break above long-term trend resistance at 16,000 levels. Before that happens we should expect more consolidation between 13,500 and 16,000.