Posts

GLOBAL EQUITY MARKETS – October 13, 2018

REVIEW


Since the beginning of 2018, the performance between Emerging Markets and Developed Markets diverged. Emerging Markets have underperformed the Developed Markets by around 15%. Two charts below show the relative performance ratio between EEM and ACWI and also the MSCI indices, MSCI Emerging Markets Index vs. MSCI World Markets Index. You can see the fluctuations on the ratio over the years.

2016-2017 was a period of EM outperformance. In the beginning of 2018, the ratio reversed sharply and the past 10 months resulted in a massive underperformance for the Emerging Markets. We might be at an inflection point as the ratio is now testing 2016 lows. Emerging Markets might start outperforming the Developed Markets once again. (The ratio is calculated by dividing two time series EEM & ACWI and indexing it to 1 on the 1st January 2018)

Read More

GLOBAL EQUITY MARKETS – September 8, 2018

REVIEW


Strength in U.S. equities alone was not enough to push the iShares MSCI All Country World Index ETF (ACWI.O) out of its 6 month-long consolidation range. Few days of price action above the chart pattern boundary at 73.9 levels failed to materialize into a strong directional movement. The ETF continues to remain in a range between 70.6 and 73.9 levels. Strong support stands at 70.6 levels.

Read More

GLOBAL EQUITY MARKETS – August 18, 2018

REVIEW


Global Equity Markets continue to remain in a range. The iShares MSCI All Country World Index ETF (ACWI.O) is possibly forming a 6 month-long symmetrical triangle with the upper boundary acting as resistance at 74 and the lower boundary as support at 70.5 levels. Breakout from this lengthy consolidation range will result in a directional move.

Read More

GLOBAL EQUITY MARKETS – July 28, 2018

REVIEW


The iShares MSCI All Country World Index ETF (ACWI.O) found resistance at the upper boundary of its 5 month-long consolidation. Last 5 month's price action can be identified as a possible symmetrical triangle with the upper boundary acting as resistance at 74 levels and the lower boundary as support at 70.4 levels. I track ACWI ETF to measure Global equity markets performance. Price continues to remain range-bound.

Read More

GLOBAL EQUITY MARKETS – June 23, 2018

REVIEW


Once again the iShares MSCI All Country World Index ETF (ACWI.O) reverted back to its 200-day (40-week) moving average. The long-term average at 71.40 levels is also the lower boundary of the 4 month-long symmetrical triangle chart pattern. Breakout from the last 4 month's consolidation will be important for Global equity markets performance. A breakdown below the lower boundary of the 4 month-long symmetrical triangle will push the ACWI ETF below its long-term average, possibly reversing the last 2 year's uptrend. Following charts review the Emerging and Frontier Market ETFs that are already trading below their long-term averages. The boundaries of consolidation for the iShares MSCI All Country World Index ETF remains between 74.3 and 71.4 levels.

Read More

GLOBAL EQUITY MARKETS – June 16, 2018

REVIEW


The iShares MSCI All Country World Index ETF (ACWI.O) continues to challenge the upper boundary of its 4 month-long sideways consolidation. The index remains range-bound. Last 2 year's trend is upwards. Price is trading above the long-term moving average. Both the lower boundary of the 2 year-long trend channel and the 200-day (40 week) moving average are forming support at 71.35 levels. The upper boundary of the the 4 month-long consolidation is acting as resistance at 73.90 levels.

Read More

GLOBAL EQUITY MARKETS – June 9, 2018

REVIEW


Benchmark for Global equity markets performance, the iShares MSCI All Country World Index ETF (ACWI.O) is challenging the upper boundary of its 4 month-long symmetrical triangle at 73.90 levels. Tight consolidation is taking place above the long-term average which is acting as support at 71.2 levels. Both the long-term average and the lower boundary of the 2 year-long uptrend are forming support around the same levels. ACWI ETF is in a steady uptrend. Decisive breakout above 73.90 can resume the multi-year long uptrend. Failure to move higher can result in another test of the long-term average at 71.2 levels.

Read More

GLOBAL EQUITY MARKETS – May 26, 2018

Announcement:

Dear Tech Charts members,

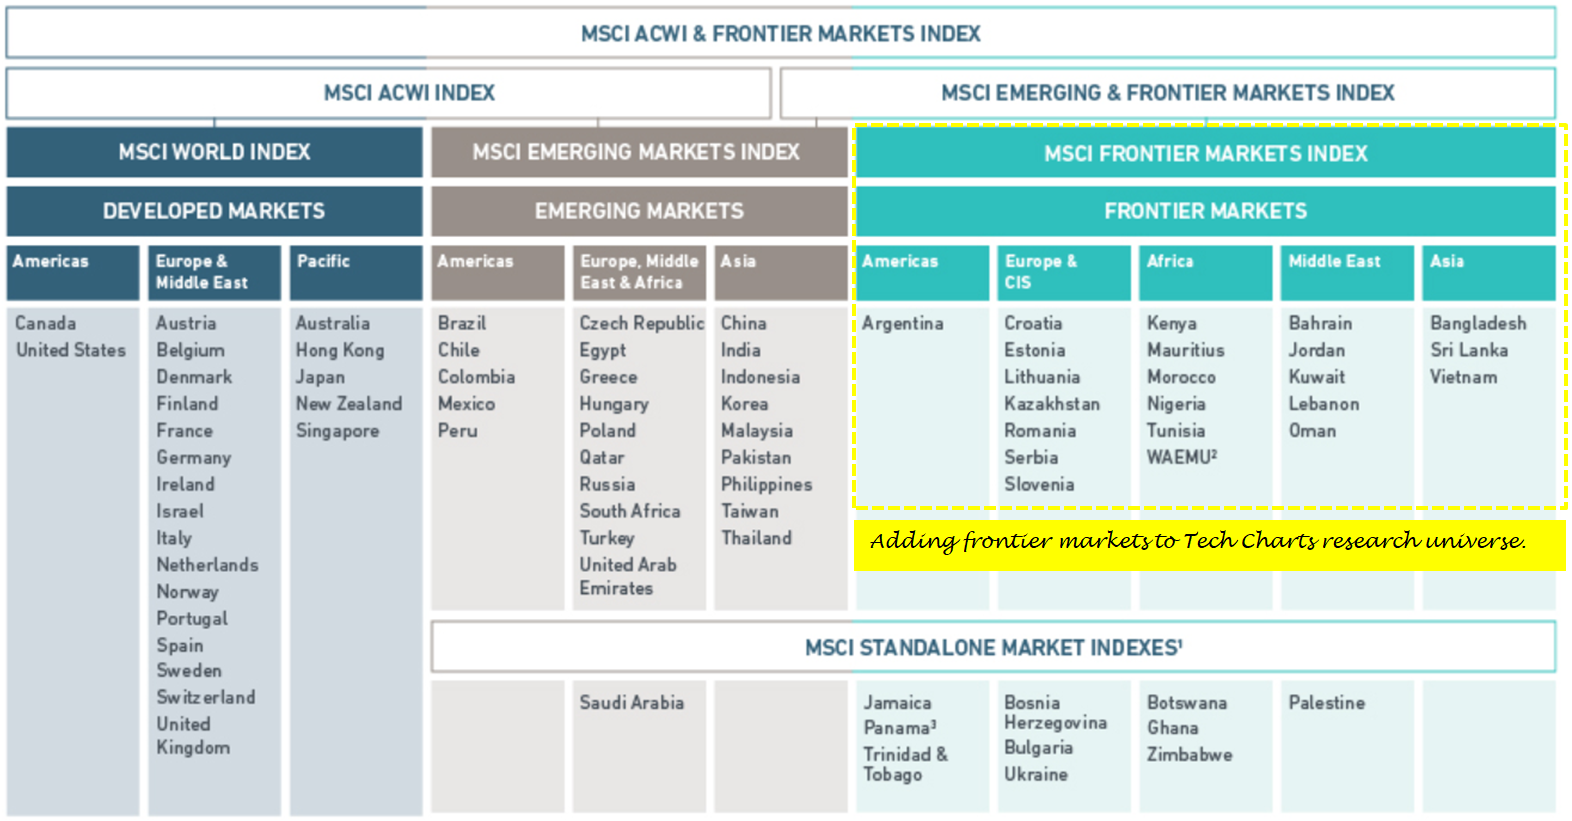
It has been a successful year since the launch of Tech Charts membership service. I'd like to take this opportunity to thank you all for your support. I hope to build a long lasting relationship with all of our members and hope to serve you in the coming years. I'm excited and motivated to improve our membership service every year. Going forward, Tech Charts Global Equity Markets report will include Frontier Markets into its research universe.  Tech Charts follows the MSCI classification for market research. Below is a table that shows MSCI classification for each market. Global Equity Markets report is highlighting developing opportunities in Developed and Emerging Markets. We are now adding Frontier Markets equities to our report. Please note that coverage of a specific market doesn't mean you will find every equity available in that specific market. Global Equity Markets report features selective number of opportunities only if the price chart has a well-defined and mature classical chart pattern.

We have received several requests to include educational videos that explains basic concepts in Technical Analysis. For our members who are new to classical charting principles and technical analysis, we are planning to add new video tutorials. New educational videos on classical chart patterns are being produced as well.

As usual, please feel free to ask questions, send charts for discussions and feedback on any matter regarding your membership service.

I look forward to another great year.

REVIEW


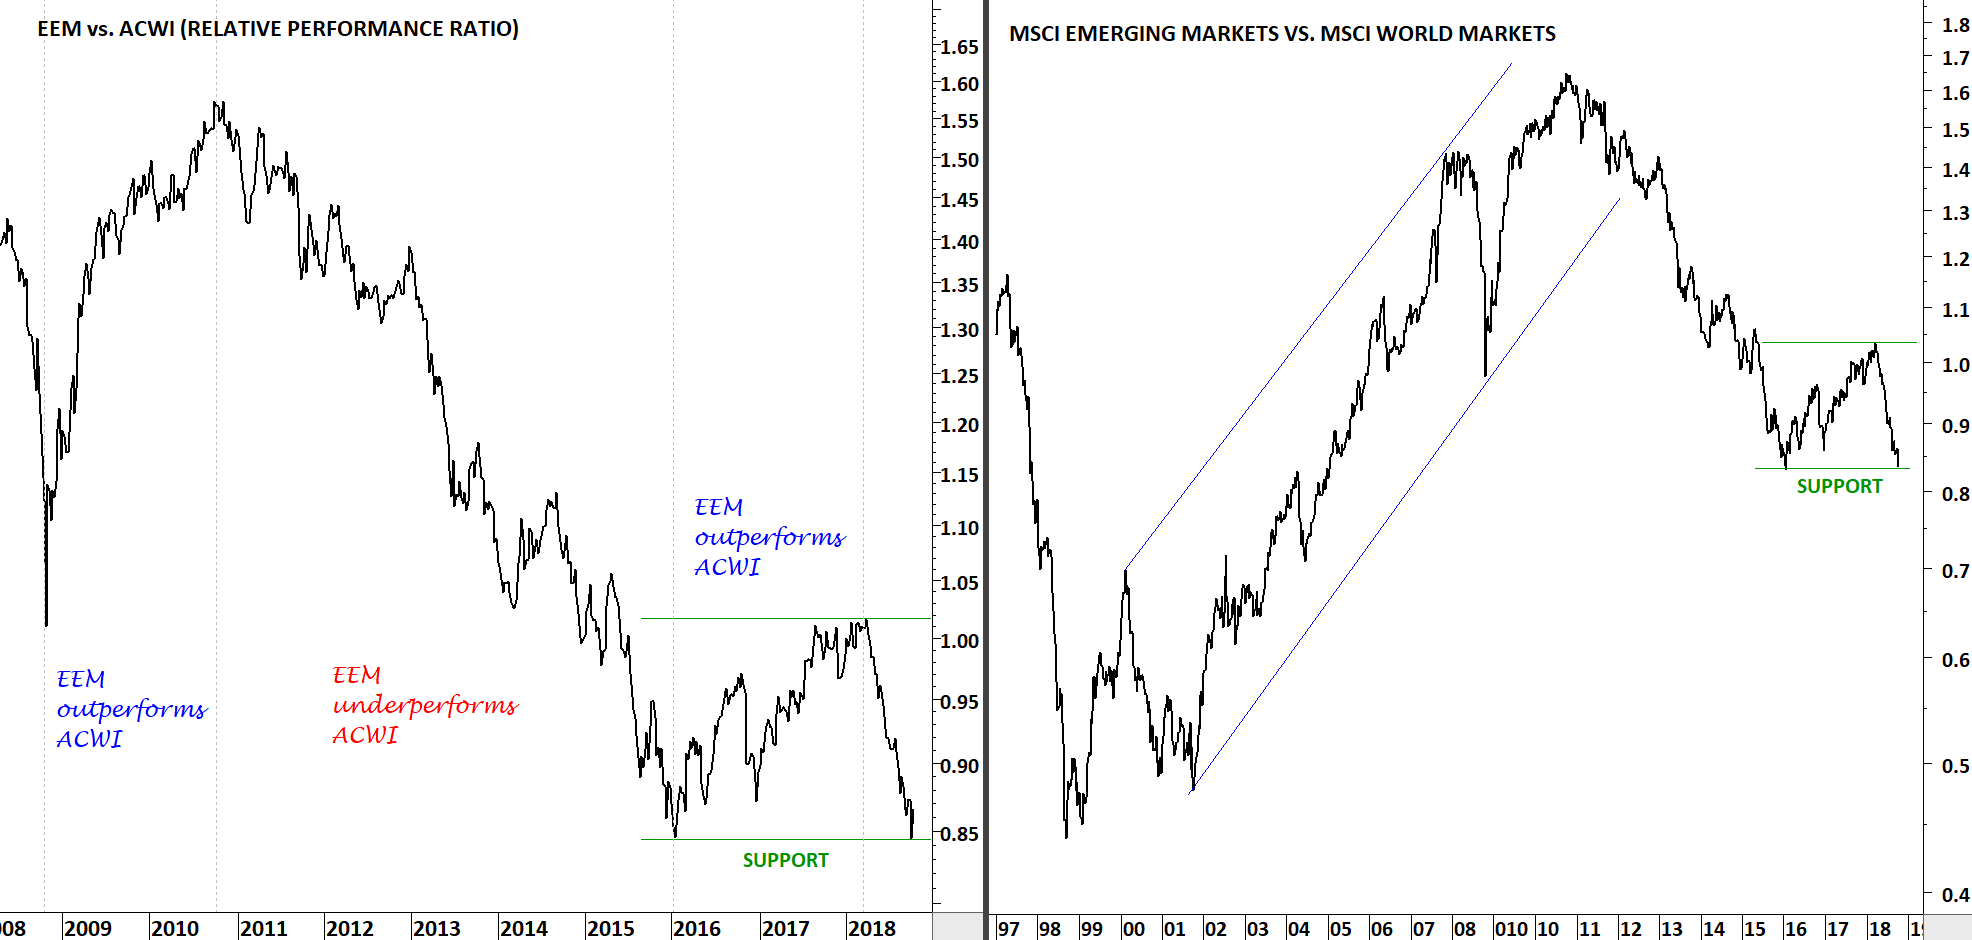
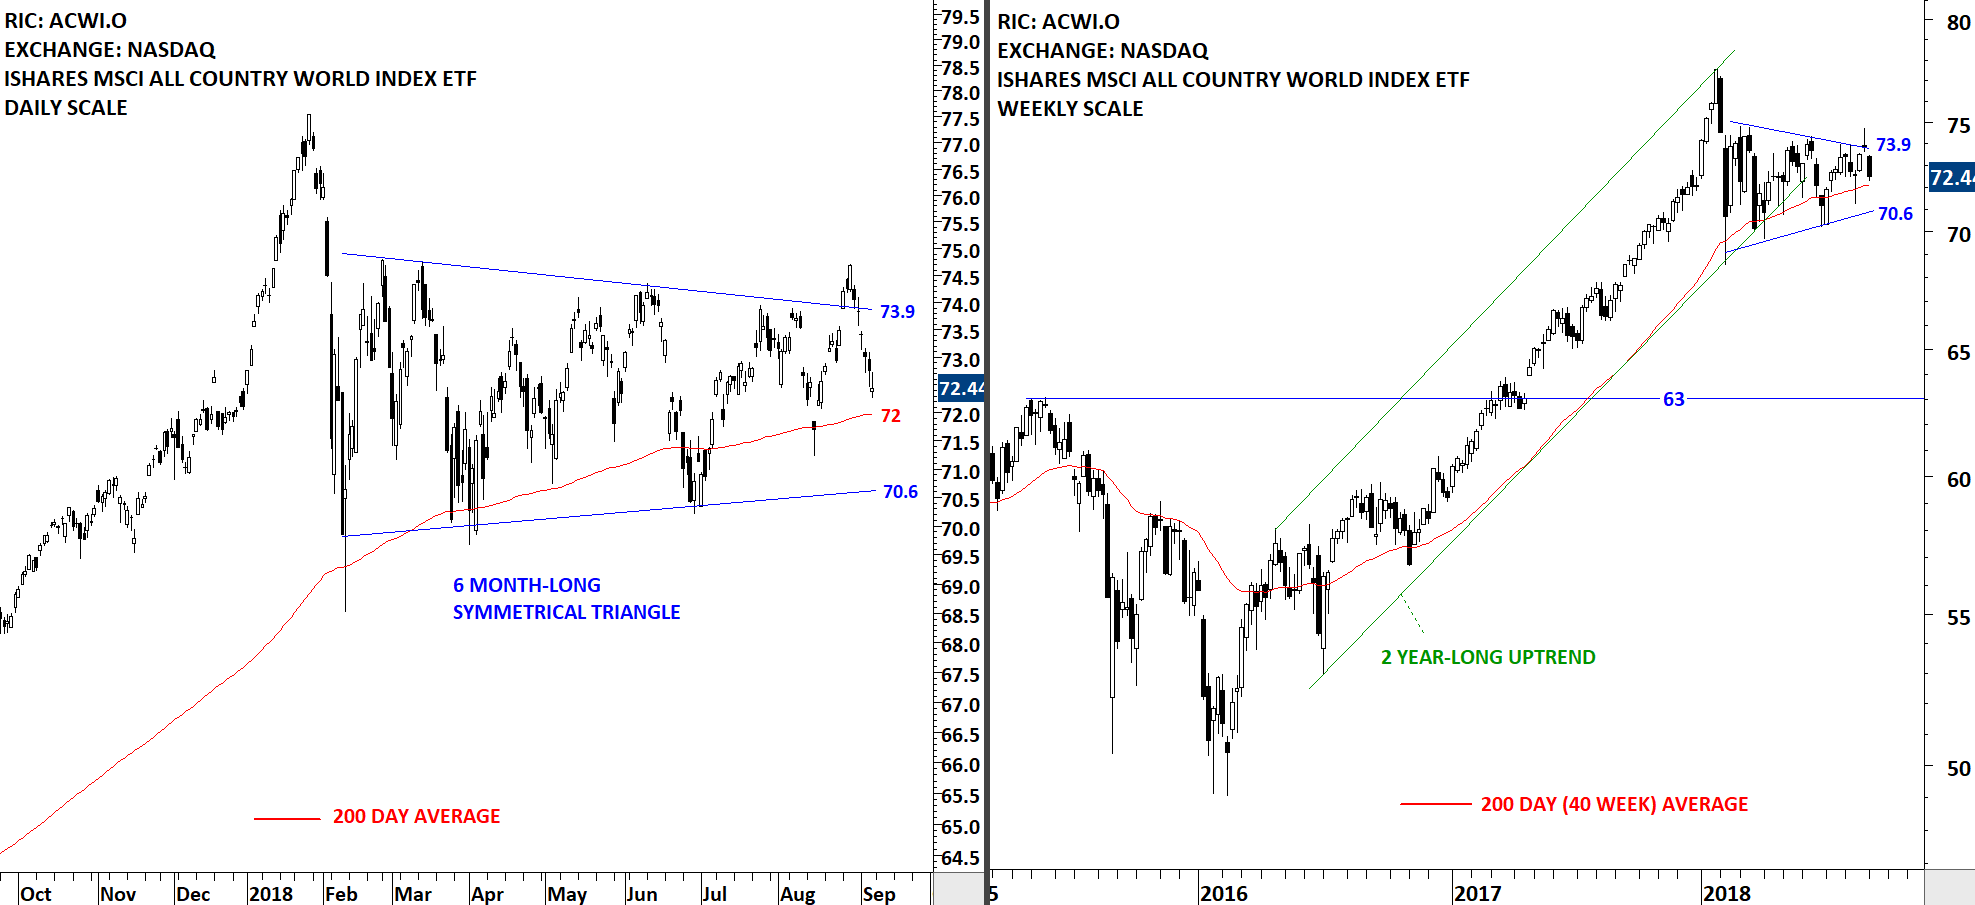
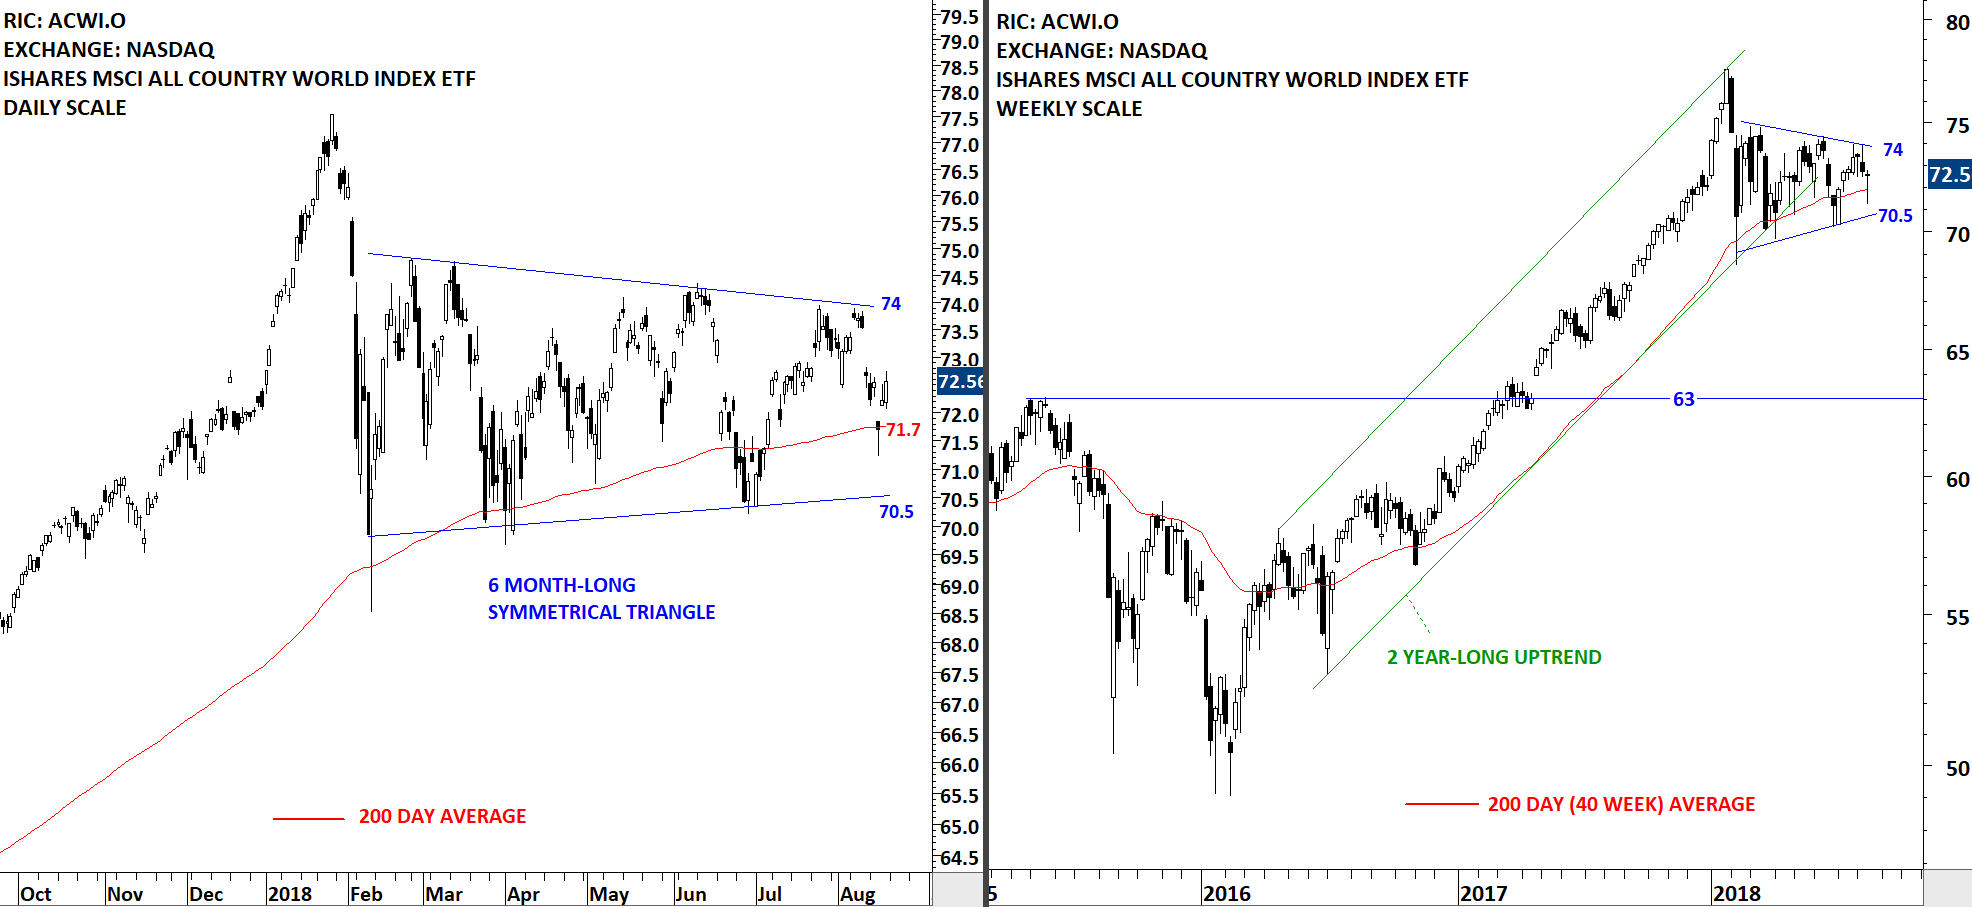
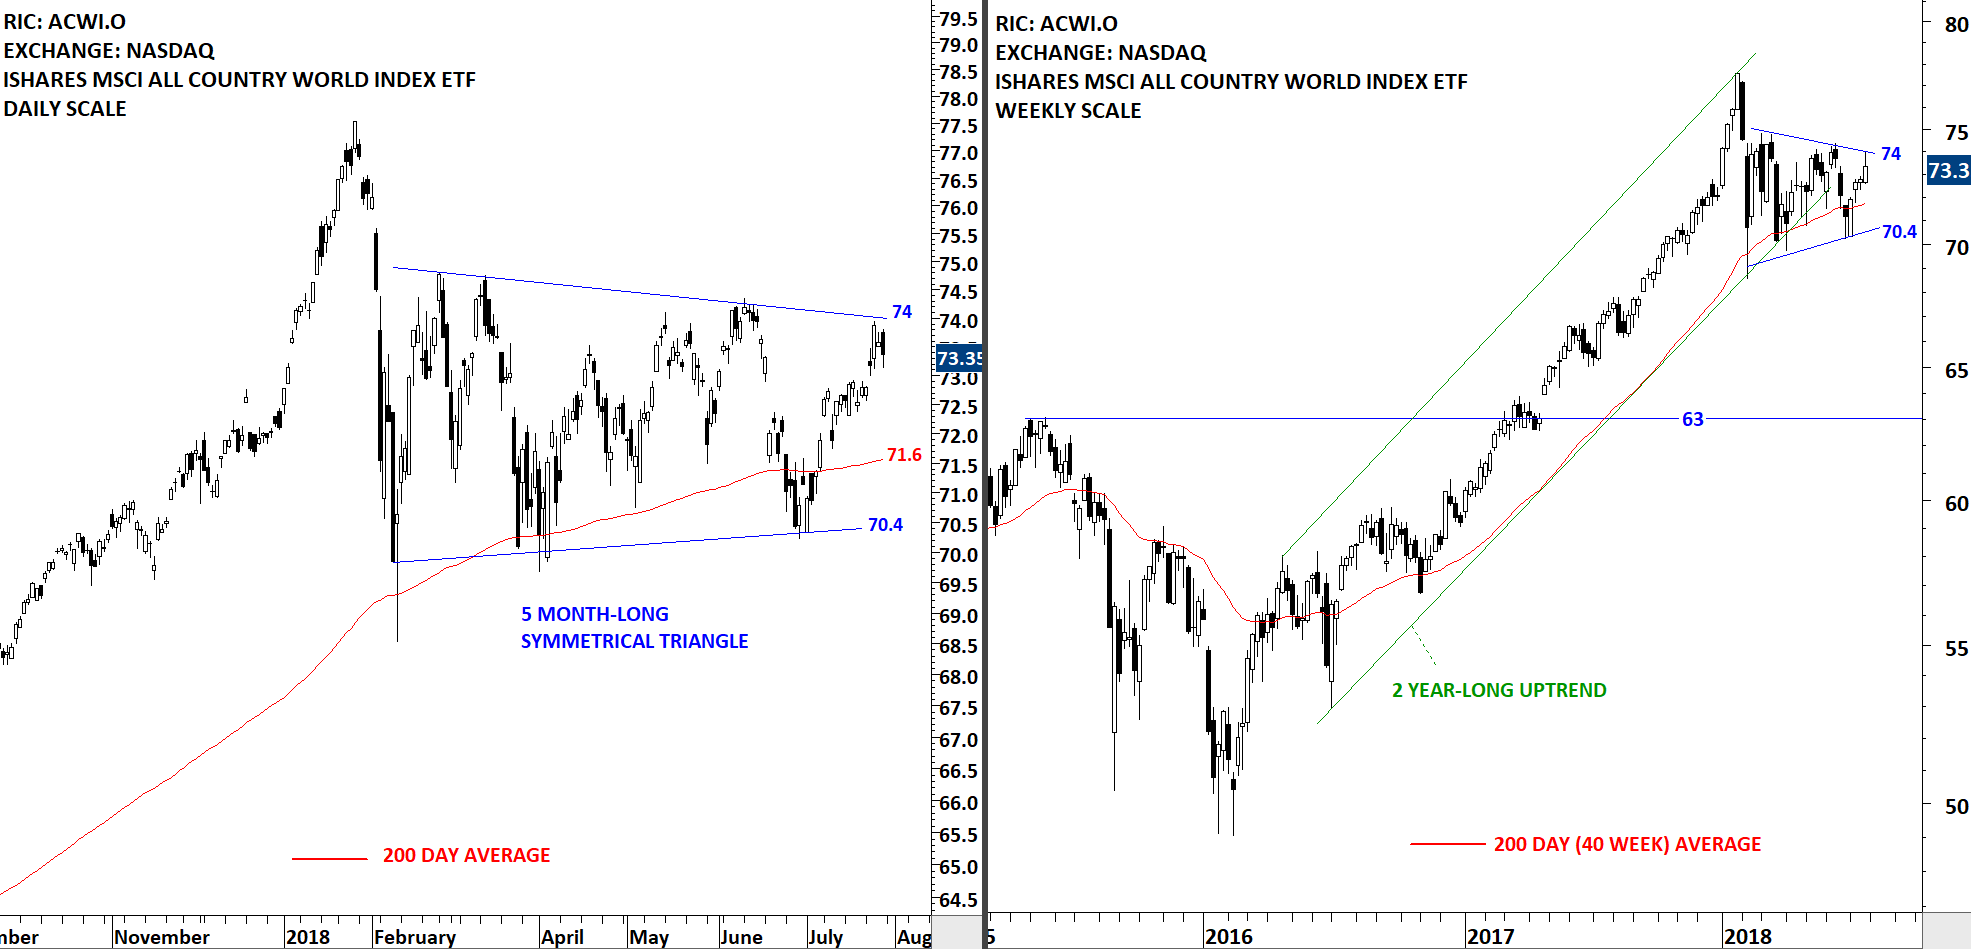
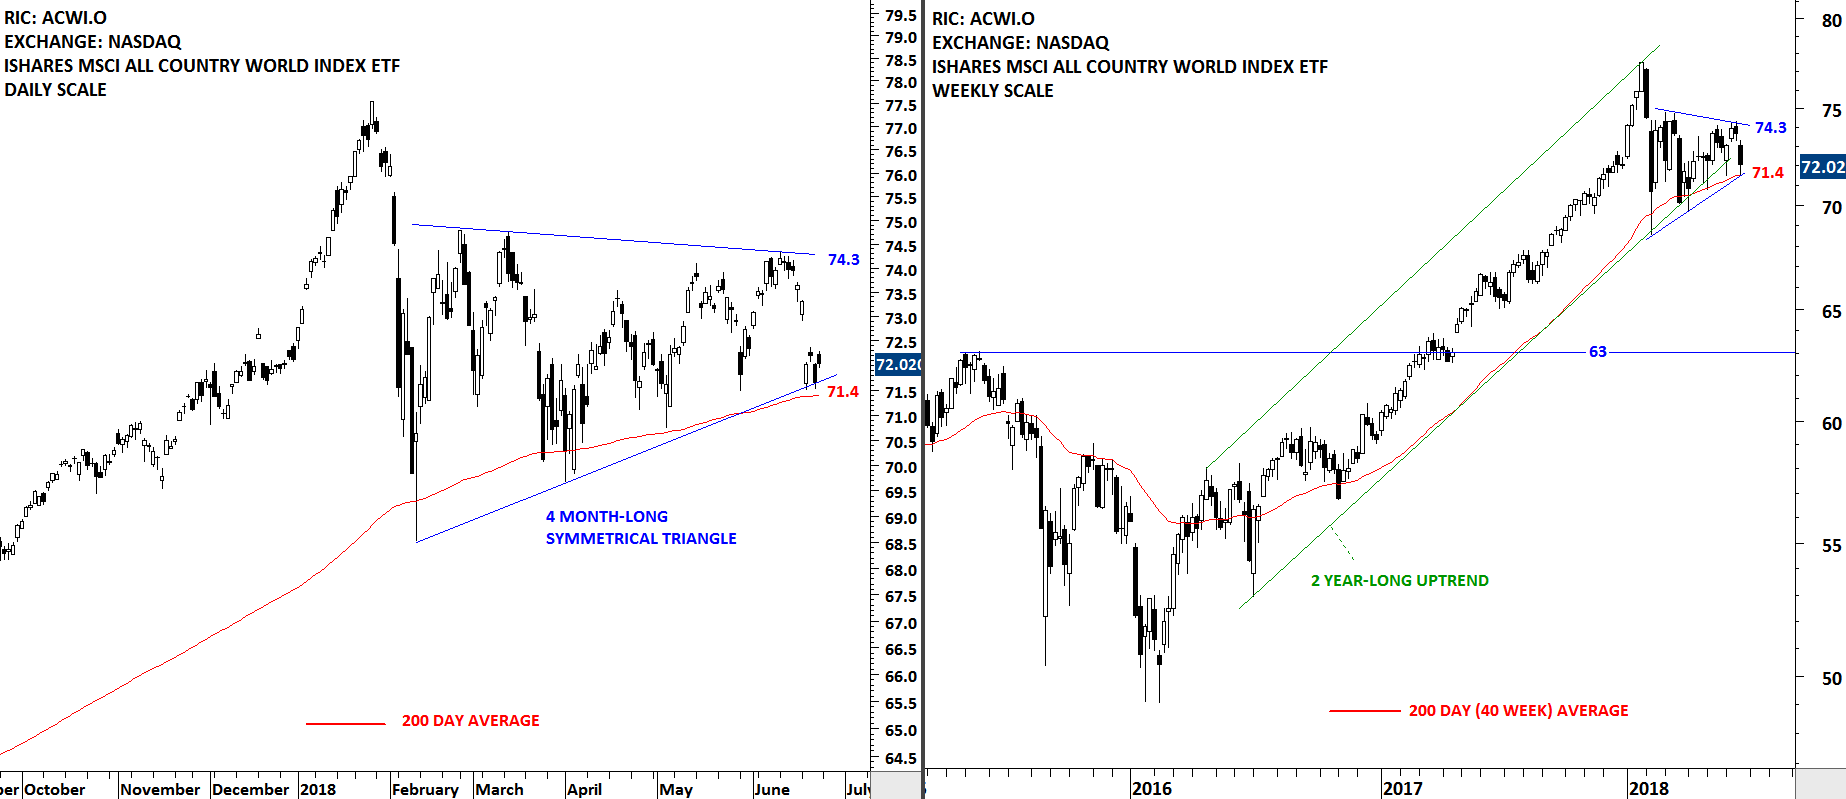
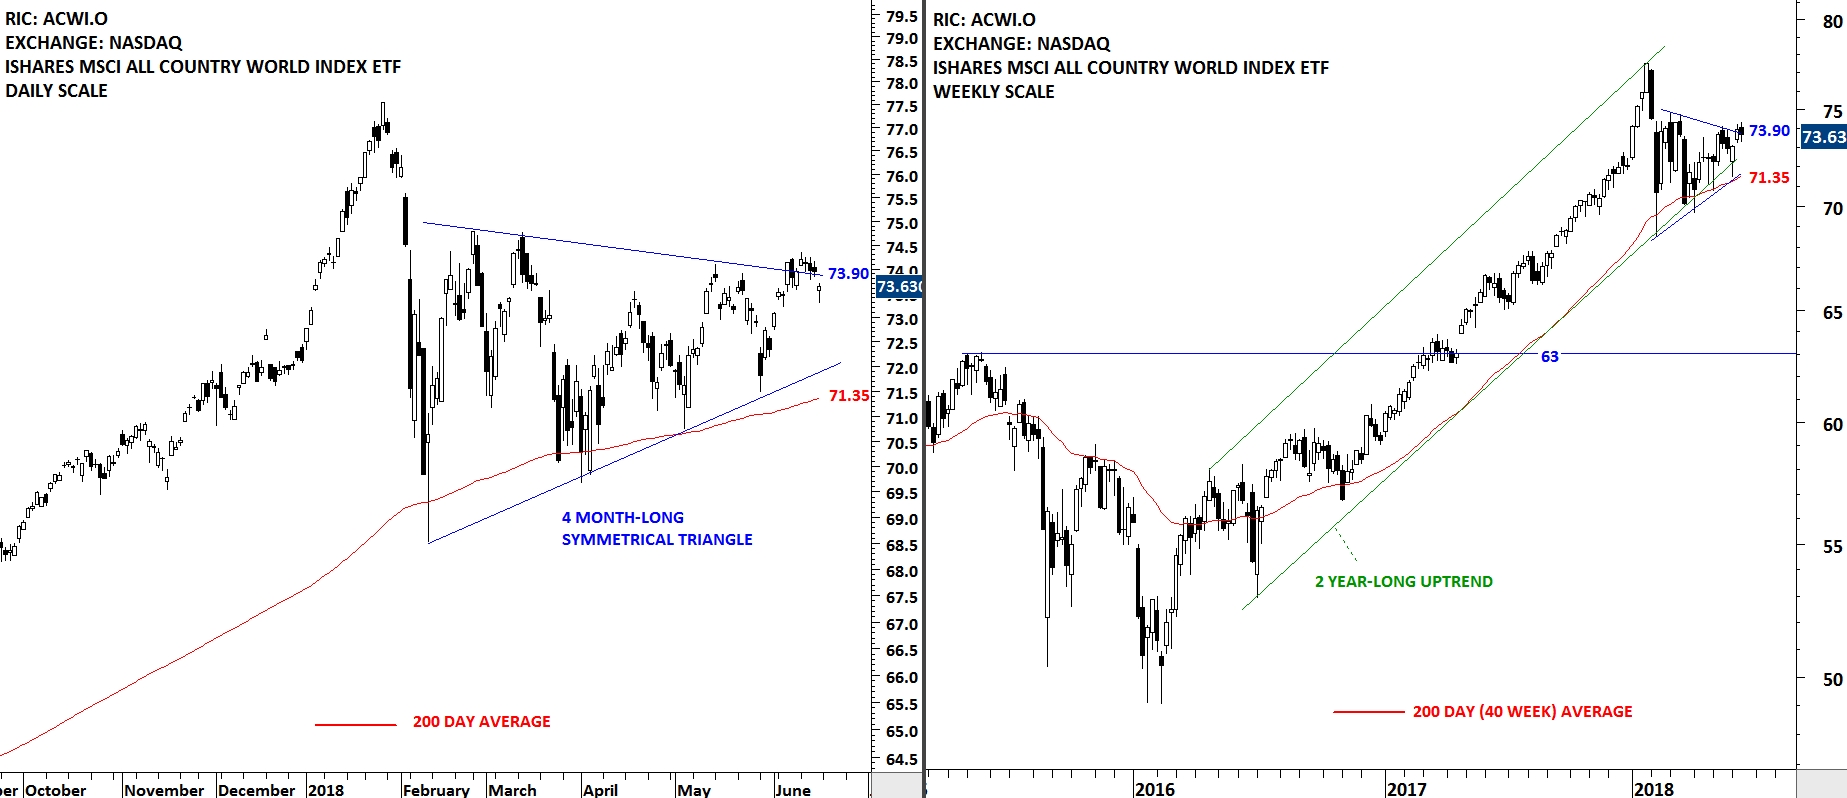
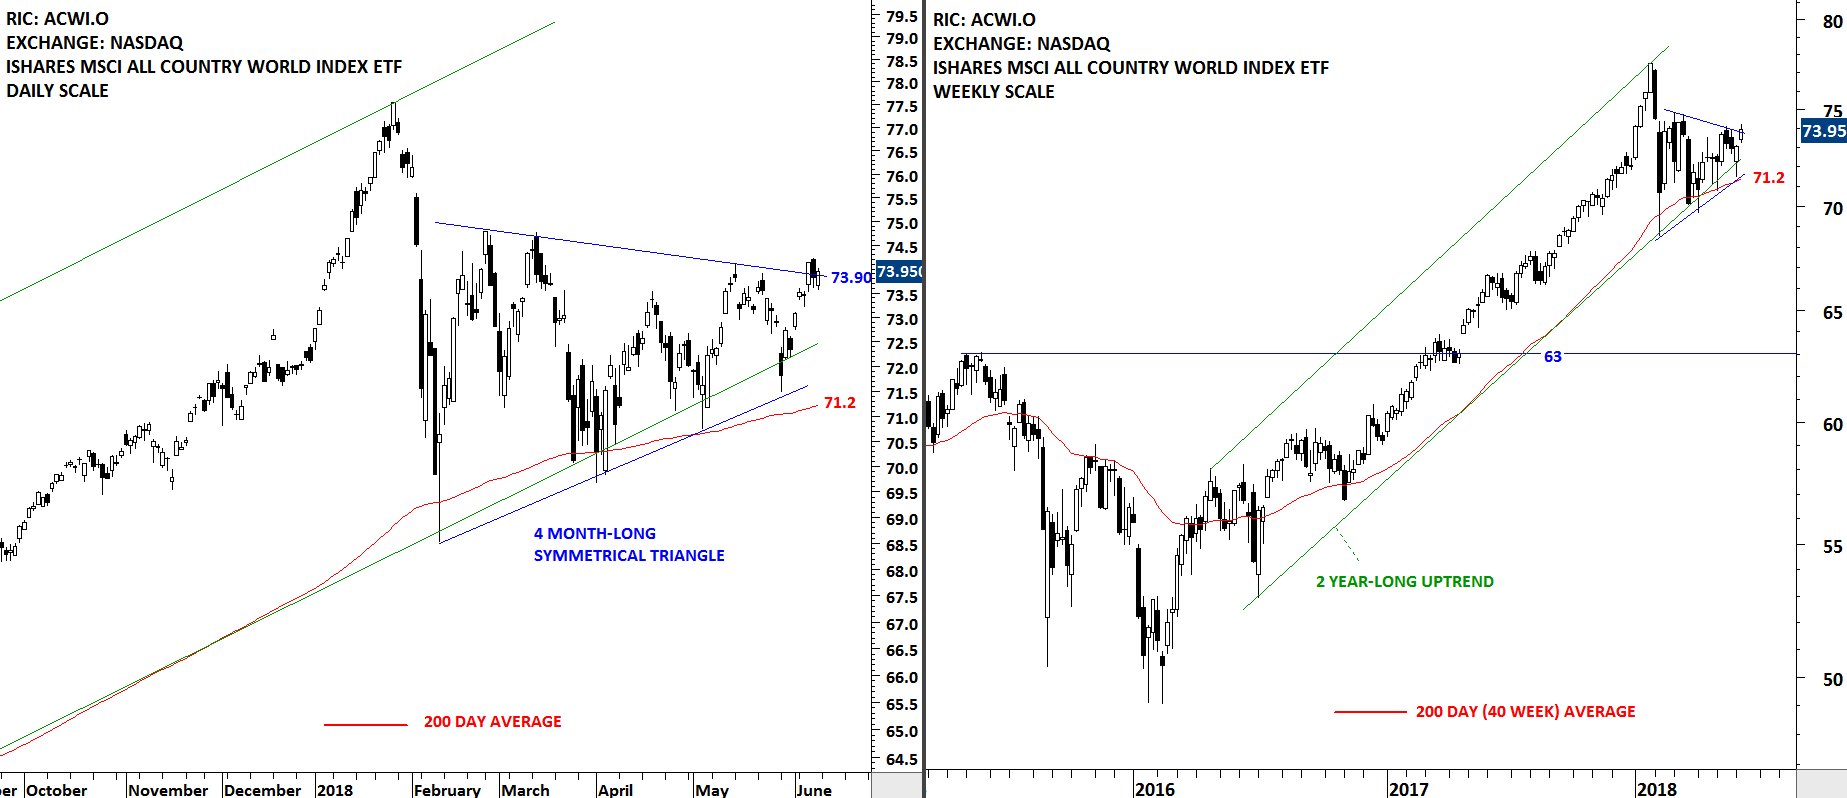
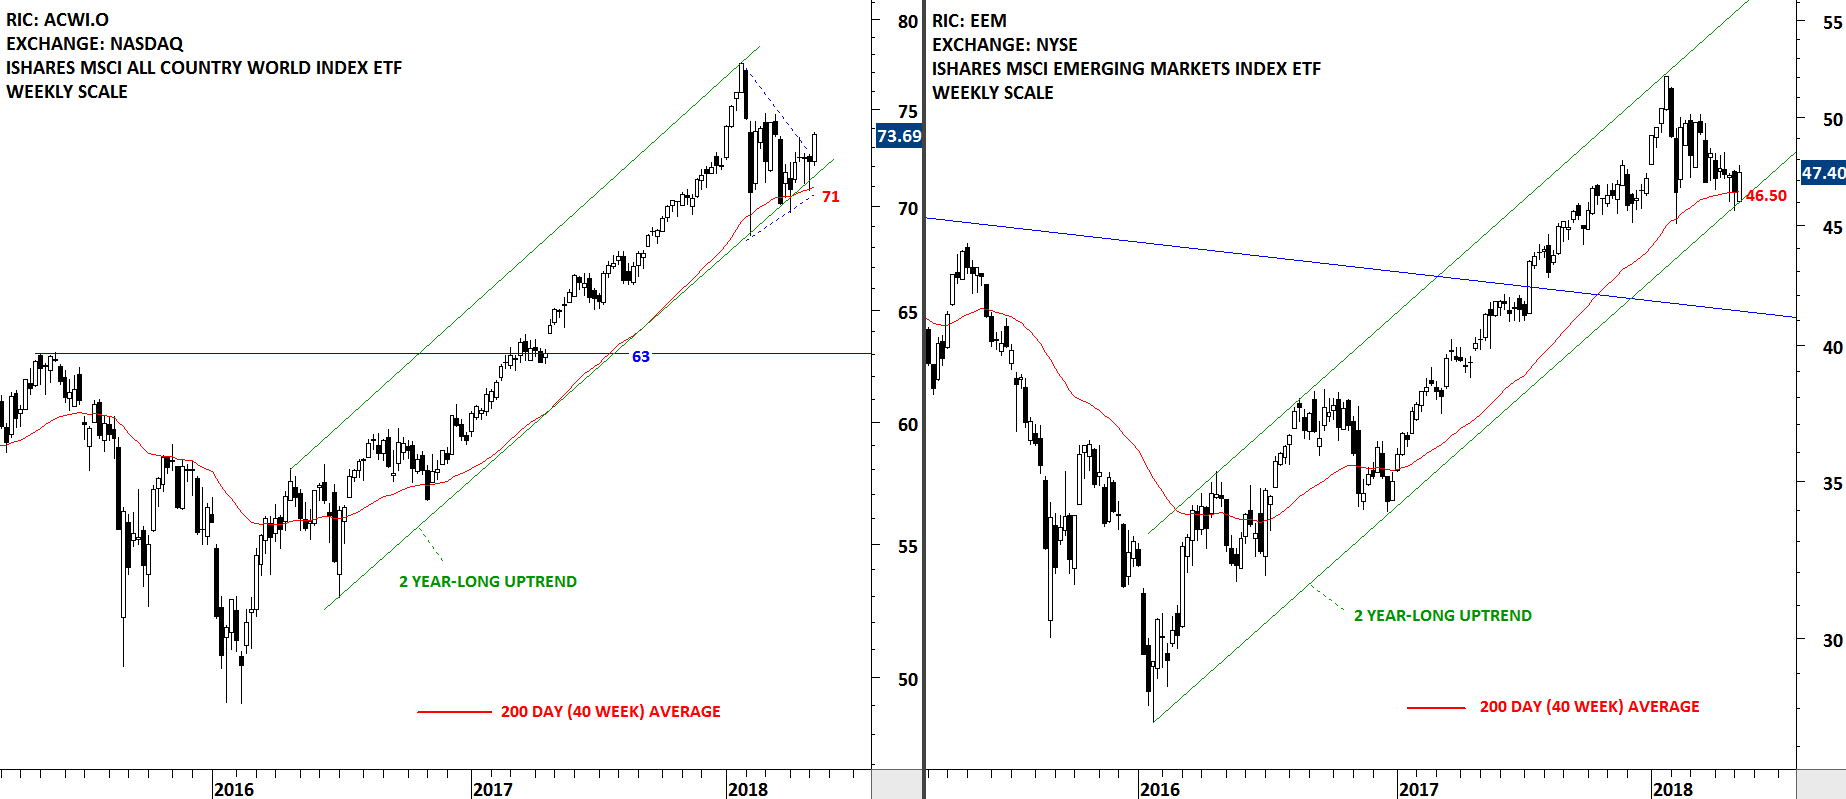
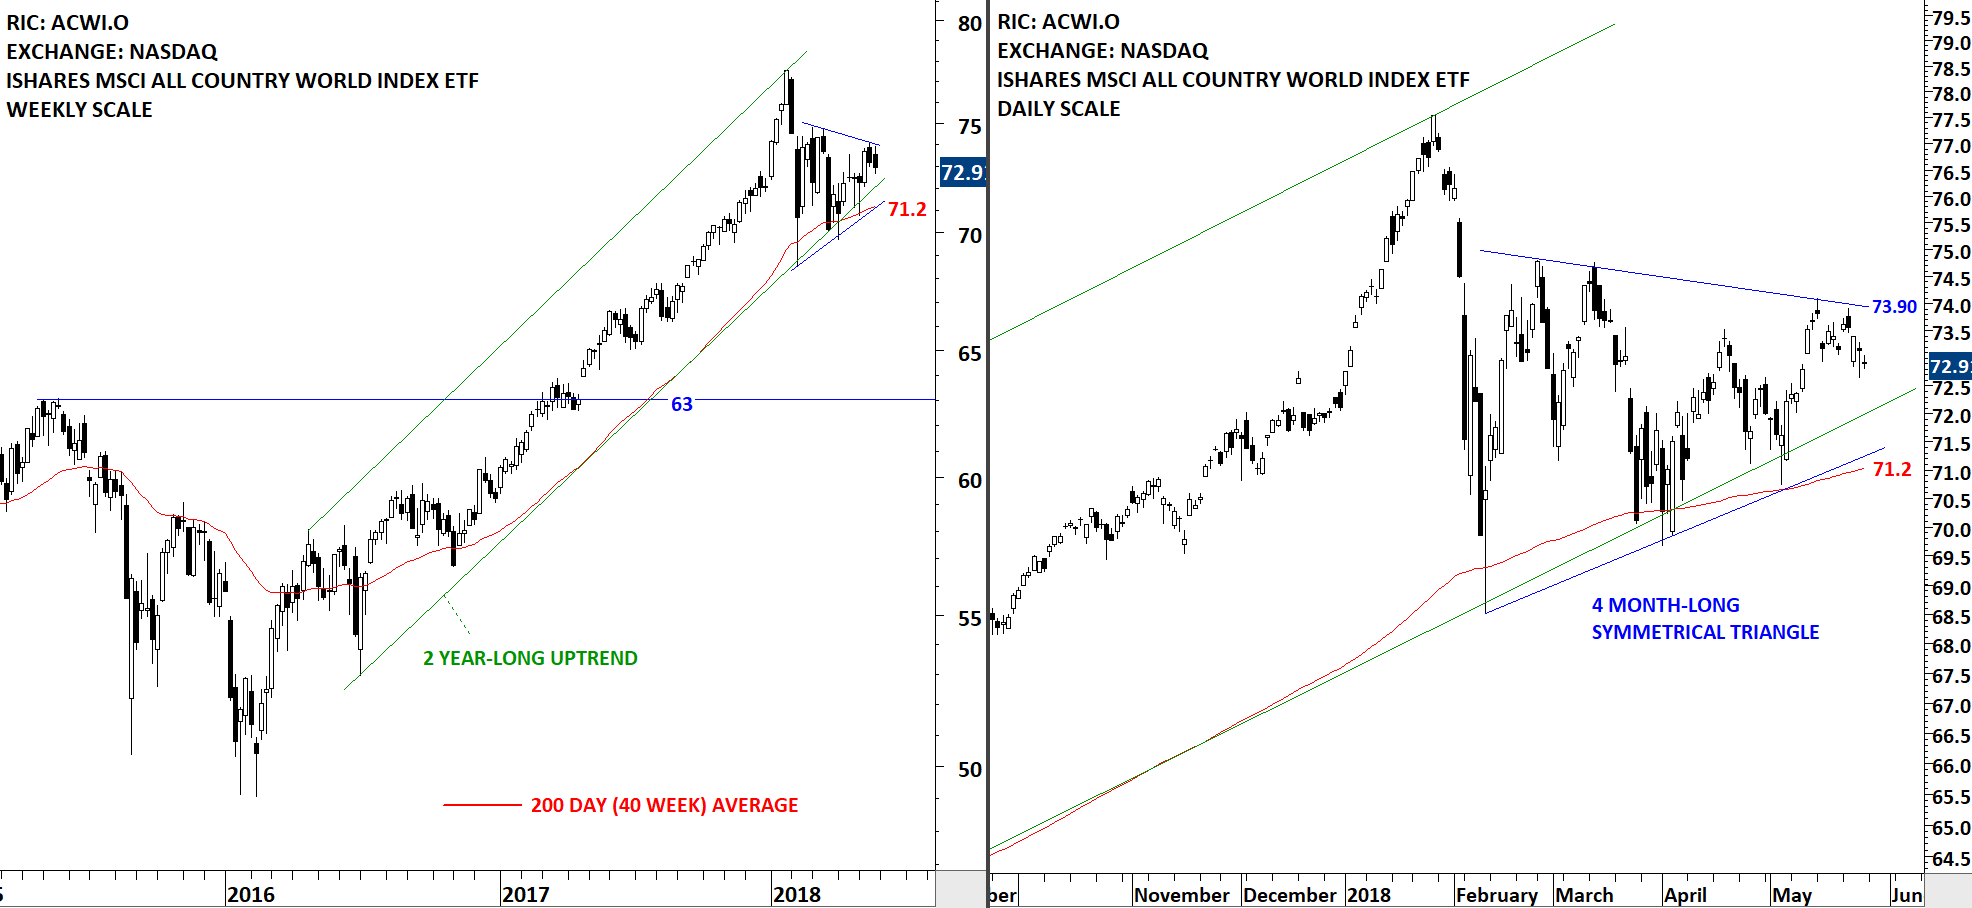
Global equity markets remain in an uptrend. The iShares MSCI All Country World Index ETF is trading above its long-term average. Over the past 2 years the ETF has been moving in an upward trend channel. However, past 4 month's price action is now becoming more clear as a sideways consolidation. The ACWI ETF is possibly forming a 4 month-long symmetrical triangle with the upper boundary acting as resistance at 73.9 and support at 71.2 levels. Until the recent consolidation is resolved in one direction we will expect more choppy price action. A breakdown will confirm the 4 month-long symmetrical triangle as a bearish continuation chart pattern. Such price action will also take out the lower boundary of the trend channel and the 200-day (40 week) moving average and suggest lower prices. A decisive break above 73.90 levels will keep the long-term uptrend intact and push the ACWI ETF towards 77-78 area (previous high).

Read More

EUROPE HEDGED EQUITY FUND (HEDJ.K)


Reminder: 

Both Members and Non-Members are invited to join us for the public webinar on Thursday, May 17, 11am mountain: Tech Charts Year in Review. I will compare the before and after of charts shared with Members over the last year and go through some of the developing chart setups on equities and Global indices. I will also discuss some statistics on chart pattern reliability. As always, we'll end the webinar with a live Q&A.

If you have any questions you'd like to submit, please send them to us via the "Contact" link  under Support on our website.

CLICK HERE to register

Every week Tech Charts Global Equity Markets report features some of the well-defined, mature classical chart patterns under a lengthy watchlist and the chart pattern breakout signals that took place during that week. Global Equity Markets report covers single stocks from developed and emerging markets, ETF’s and global equity indices. The report starts with a review section that highlights the important chart developments on global equity benchmarks. This blog post features a recent breakout opportunity in European equity ETF listed on the NYSE.

Read More

GLOBAL EQUITY MARKETS – May 12, 2018

REVIEW


Global equities experienced renewed strength during the week. Weekly candles on both the iShares MSCI All Country World Index ETF and the iShares MSCI Emerging Markets Index ETF opened at the lowest and closed at the highest point suggesting buyers domination throughout the week. ACWI ETF is breaking out of its 4 month-long tight consolidation. The benchmark for Global equity markets performance has been in a steady uptrend. Recent tight consolidation took place above the long-term average and the lower boundary of its 2 year-long trend channel. The iShares MSCI Emerging Markets Index weighed down by U.S. Dollar strength, still managed to hold on to its 200 day (40 week) average and rebounded from the lower boundary of its 2 year-long uptrend. Both ETFs are in a steady uptrend.

Read More