Announcement:
Dear Tech Charts members,
We have included a new feature to Tech Charts website. At the bottom of each report we have incorporated comment platform DISQUS. Previous comment platform was not allowing members to post charts and have discussions. With this improvement, I hope to have detailed discussions with our members and possibly post breakout alerts related to each week's report. I also hope that Tech Charts members will be able to interact with each other through the DISQUS platform (at the bottom of each weekly report) to share their knowledge on different instruments available to take advantage of breakout opportunities. I hope we will all benefit from this new feature.
REVIEW
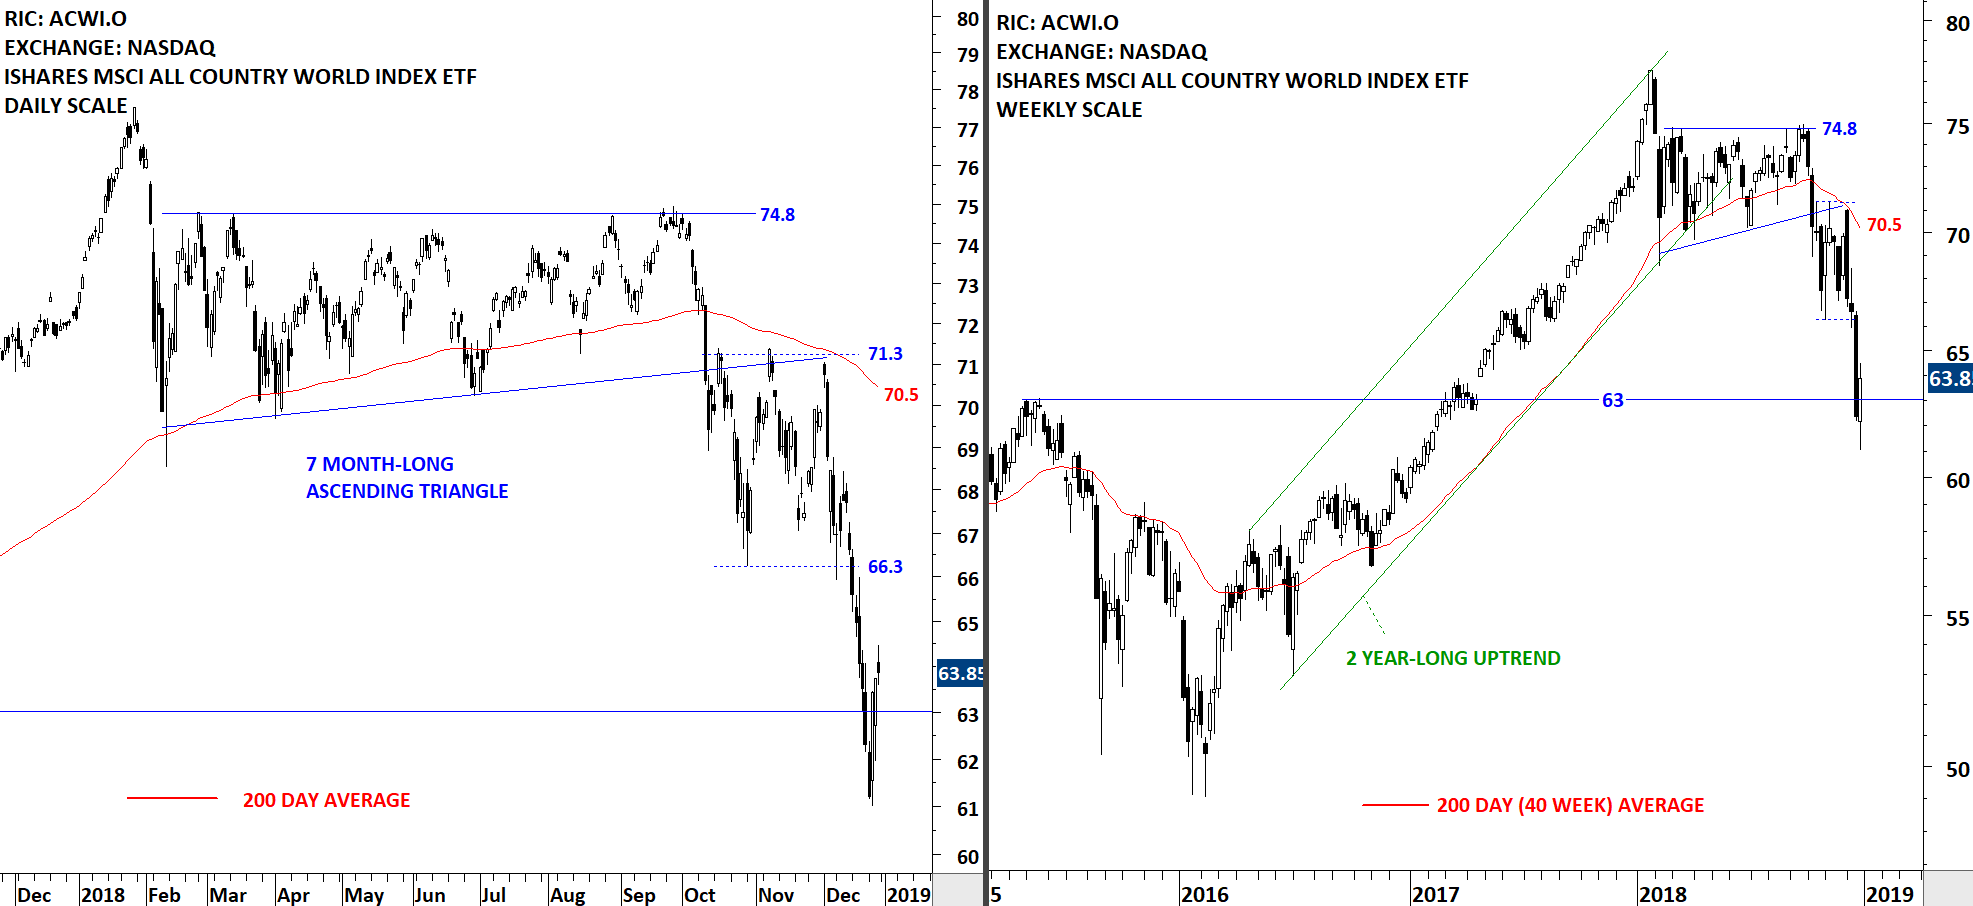
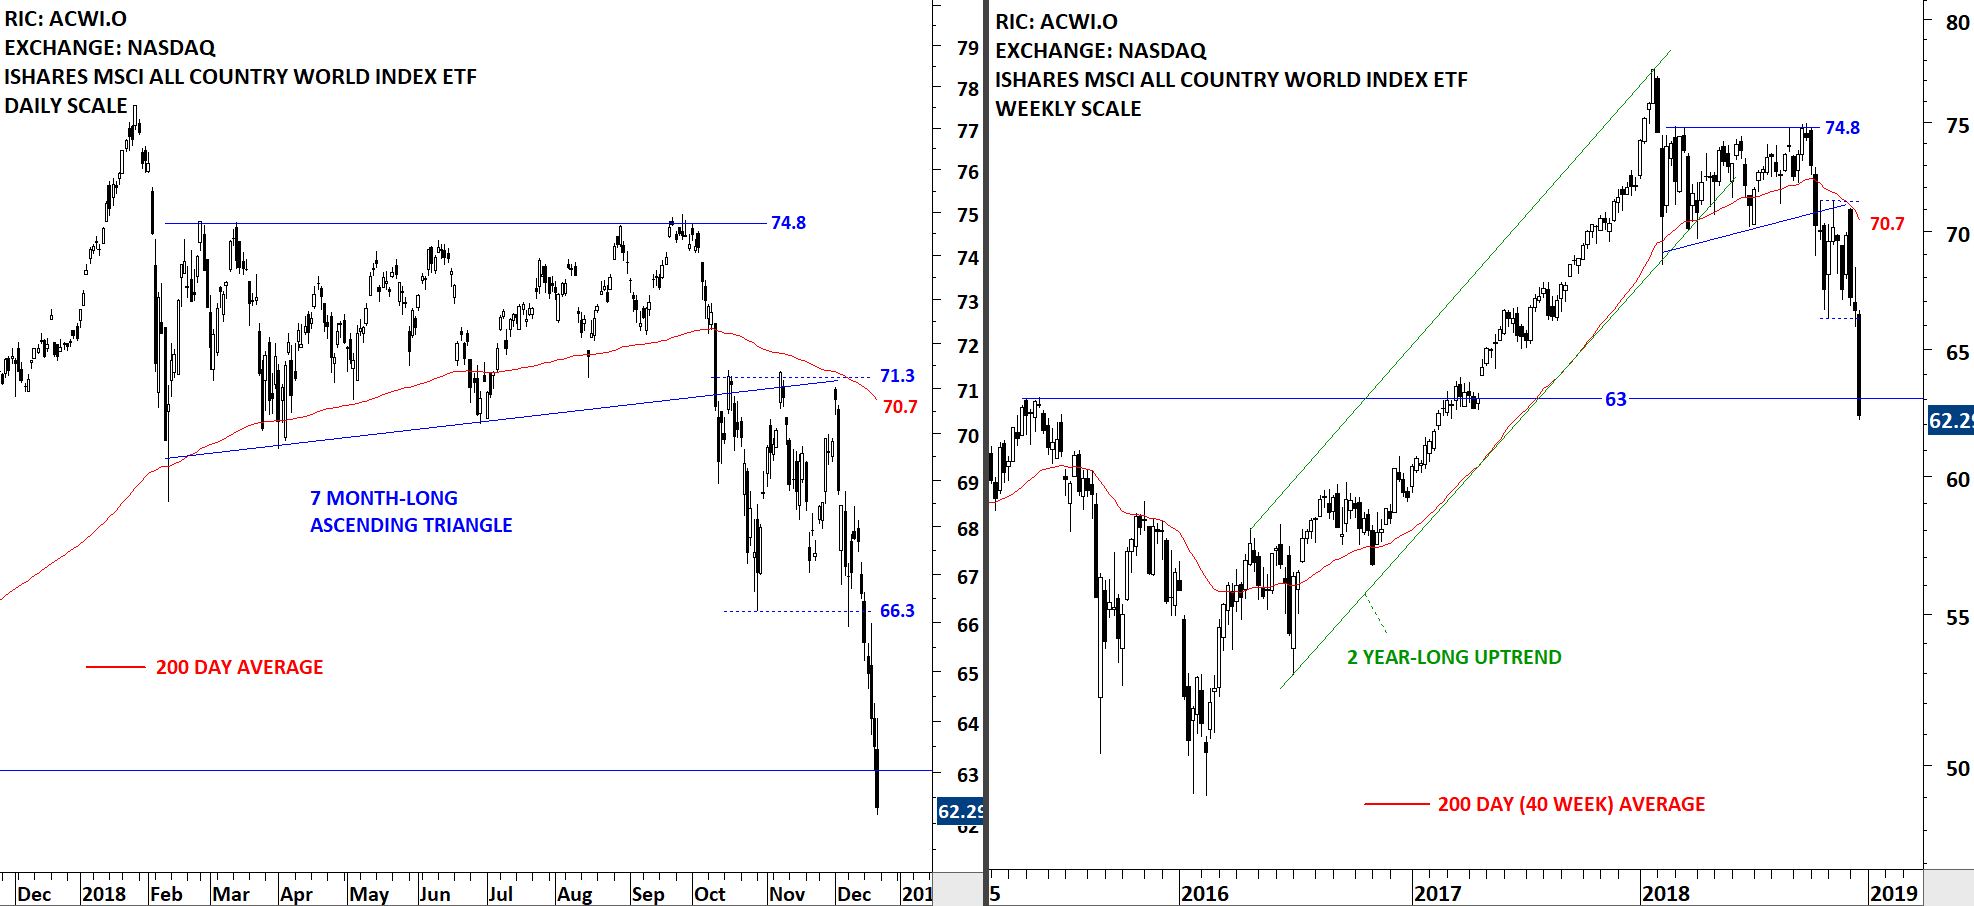
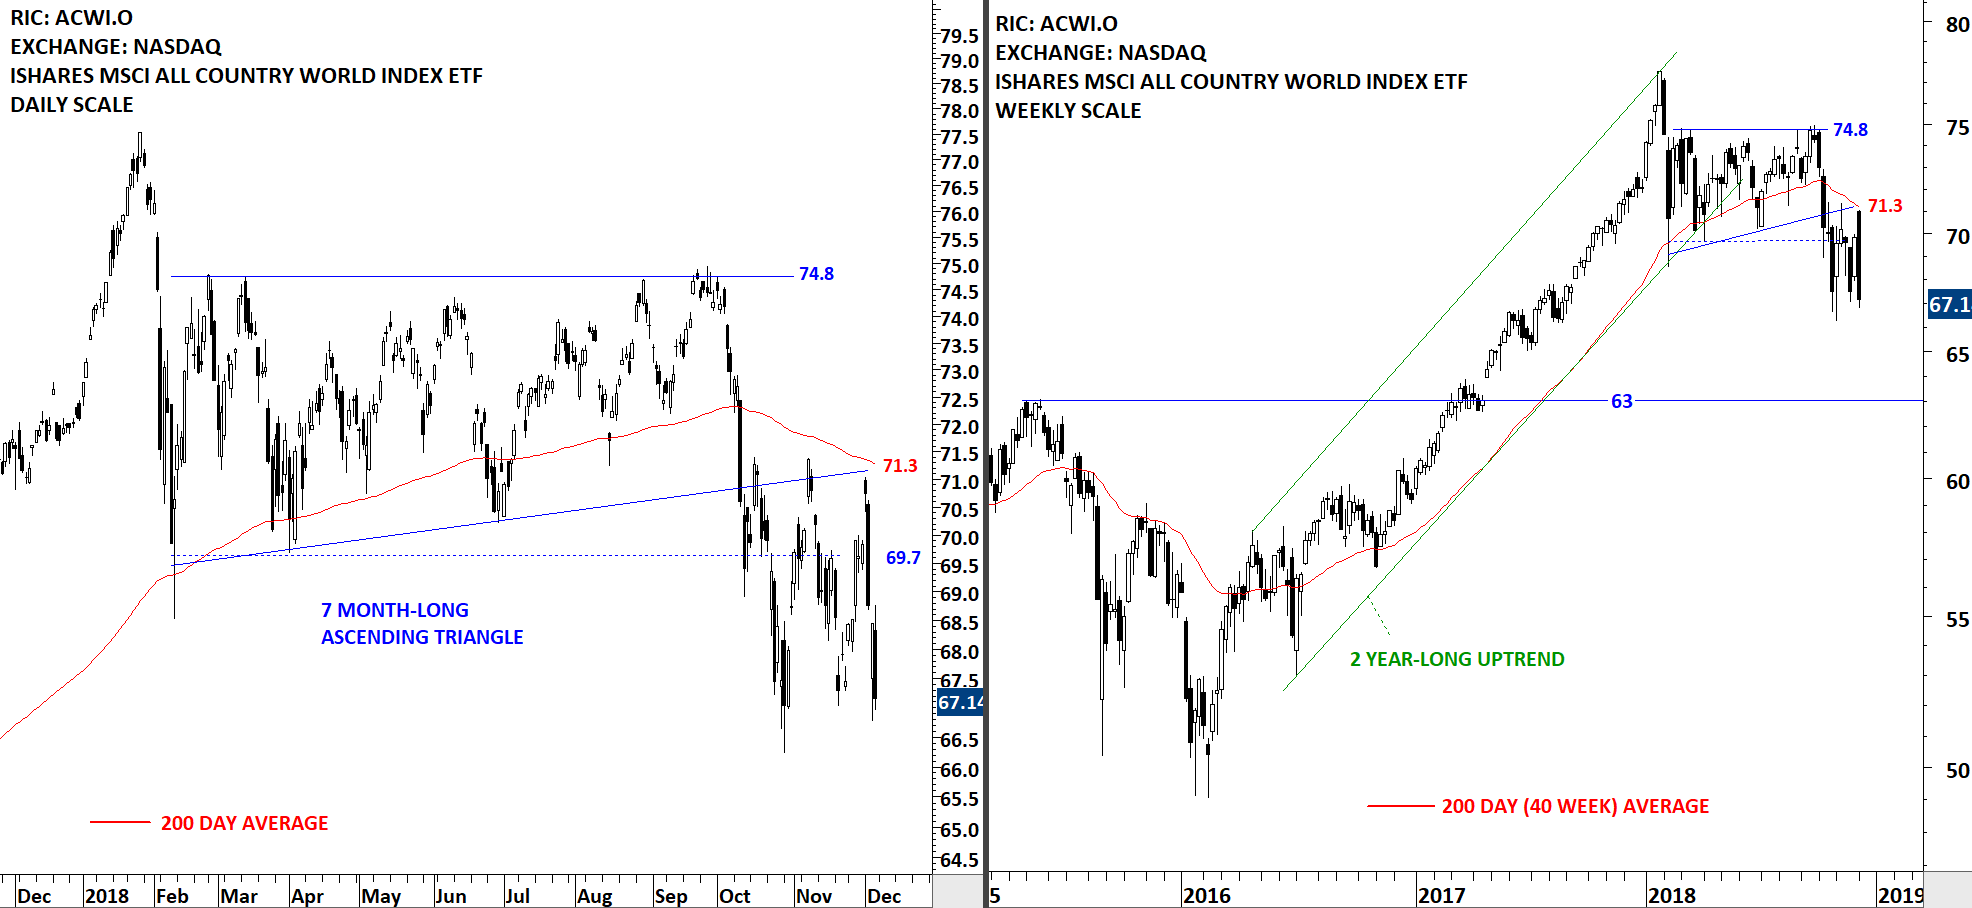
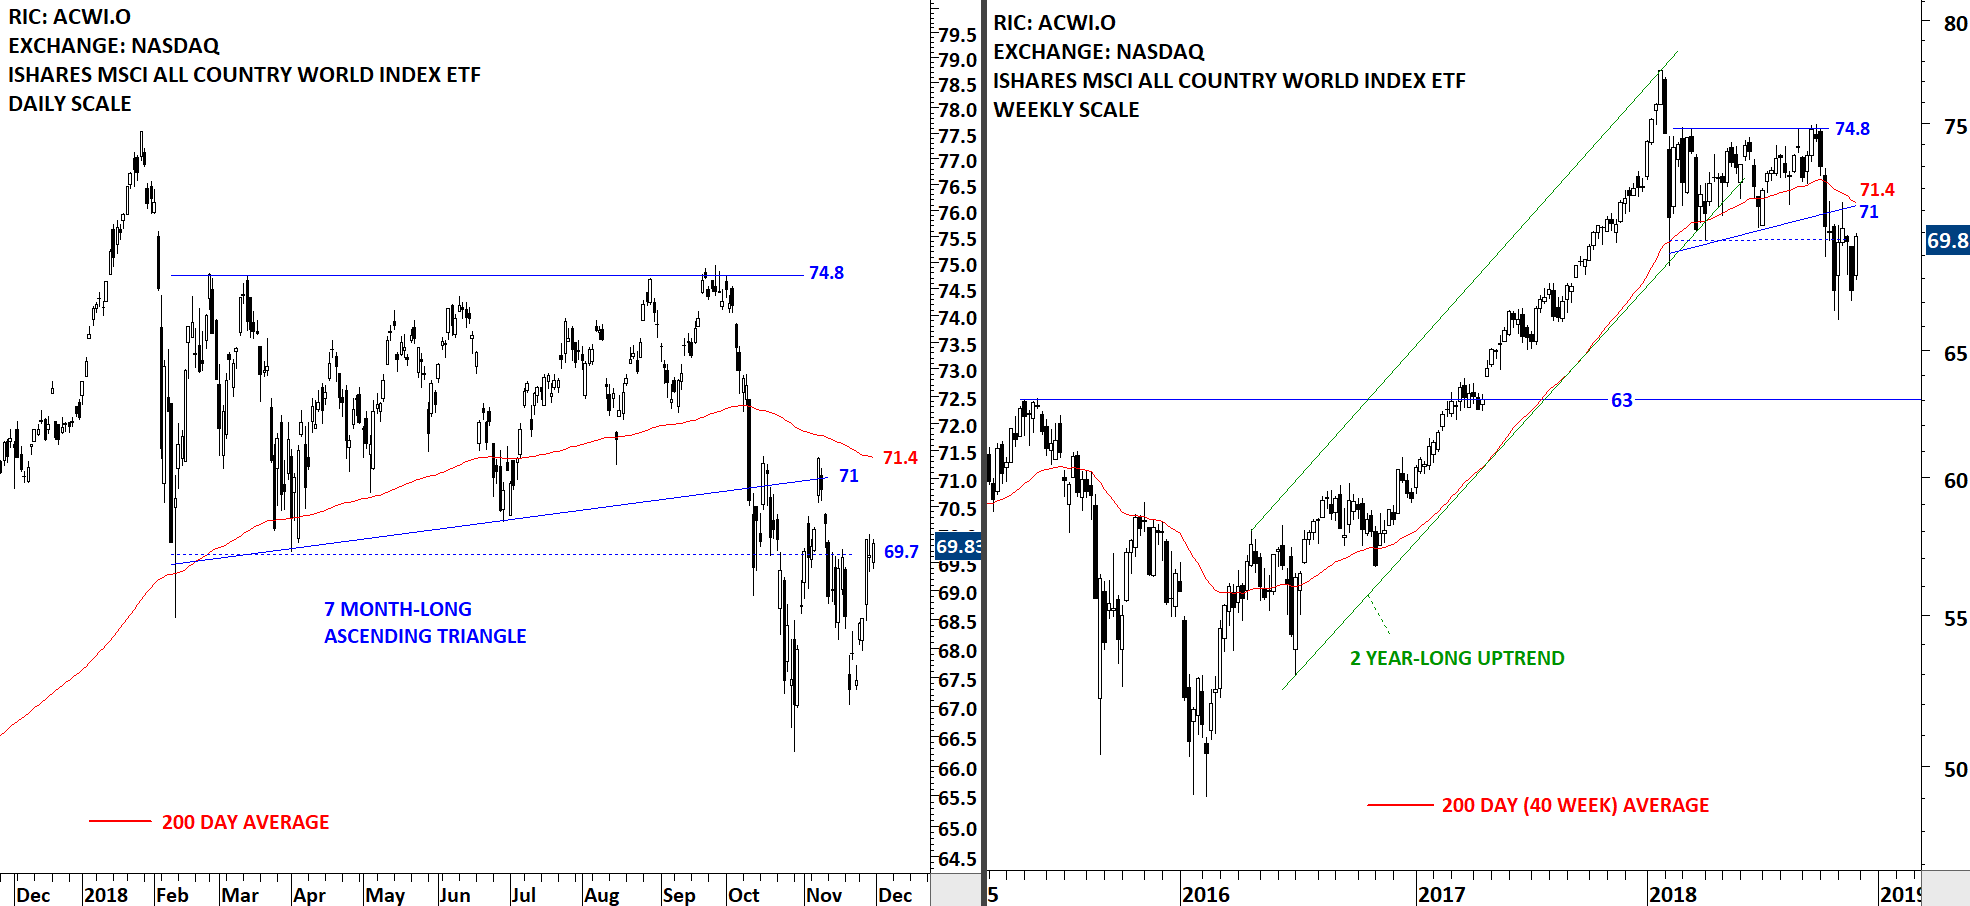
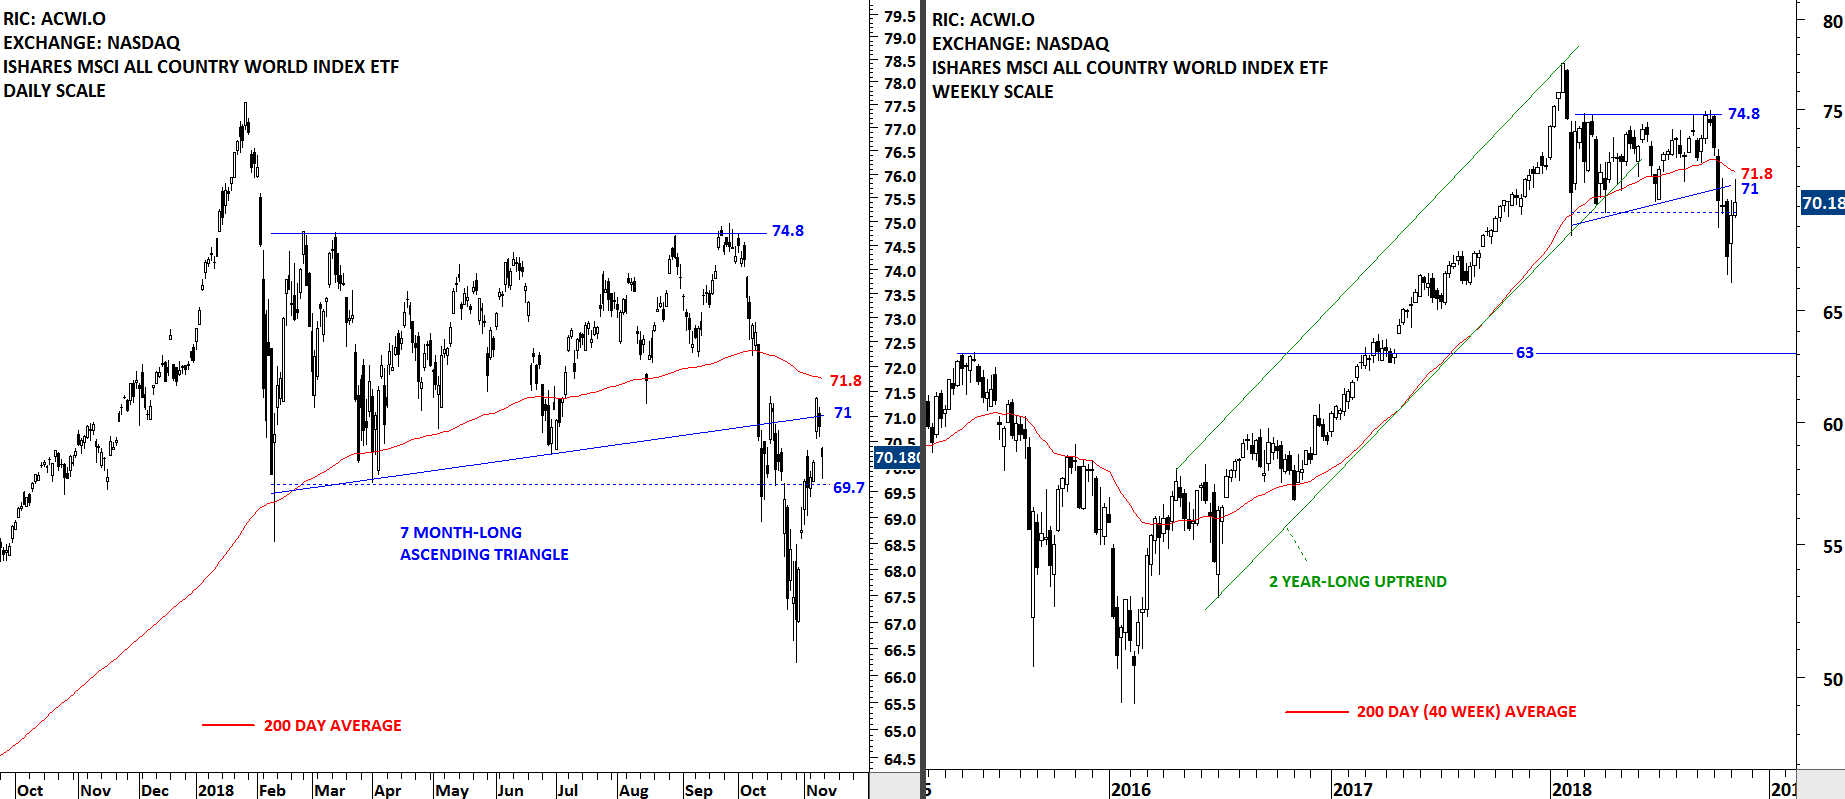
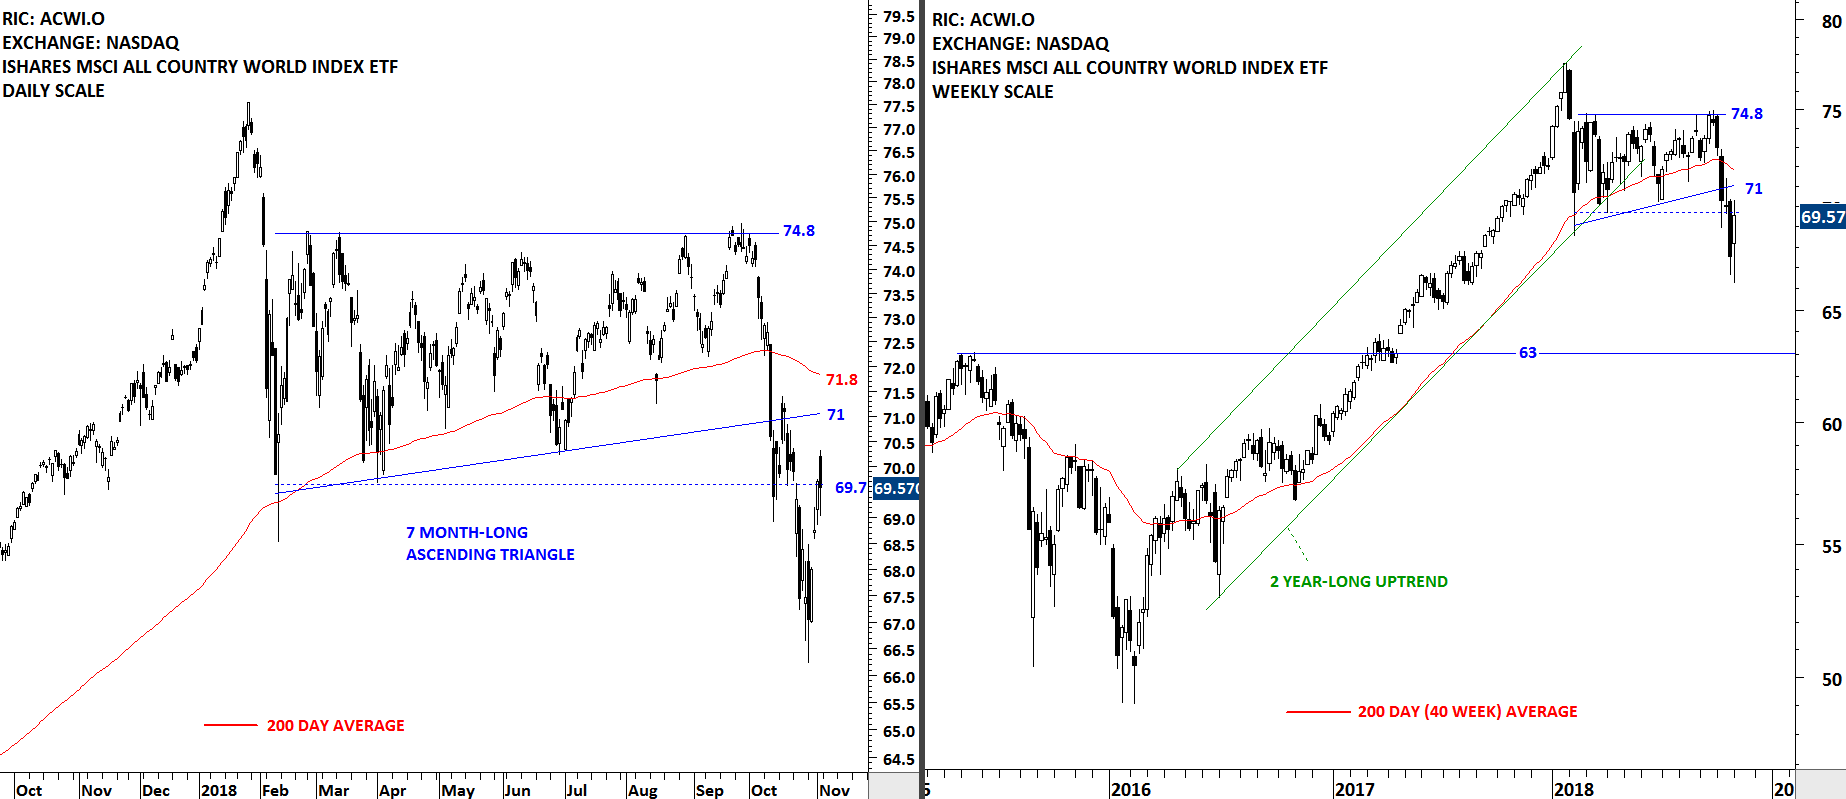
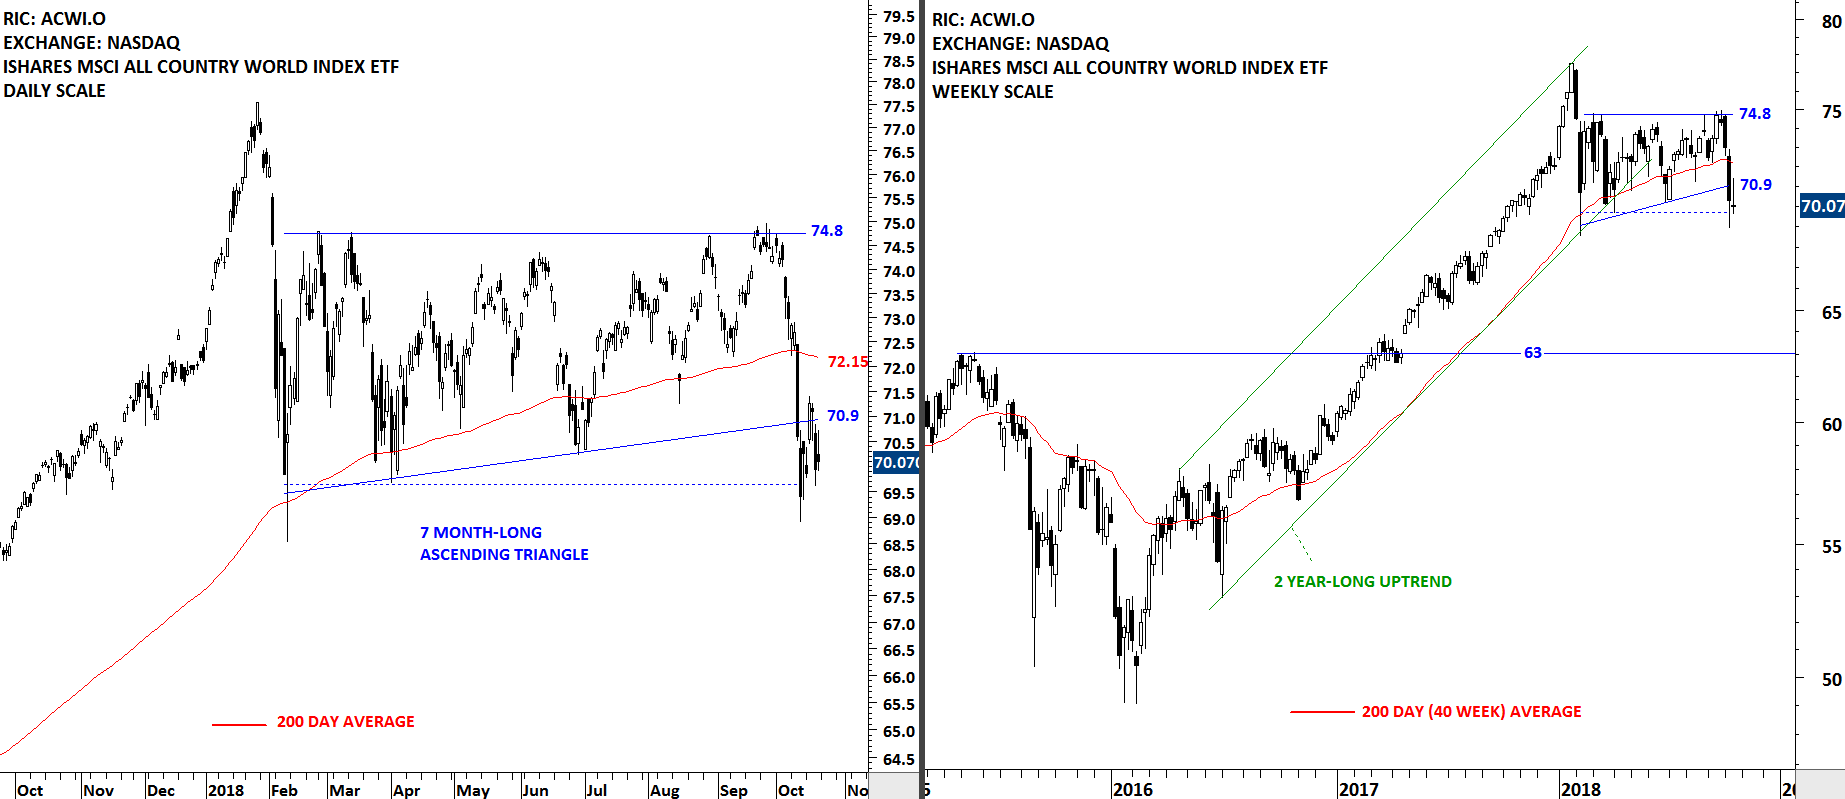
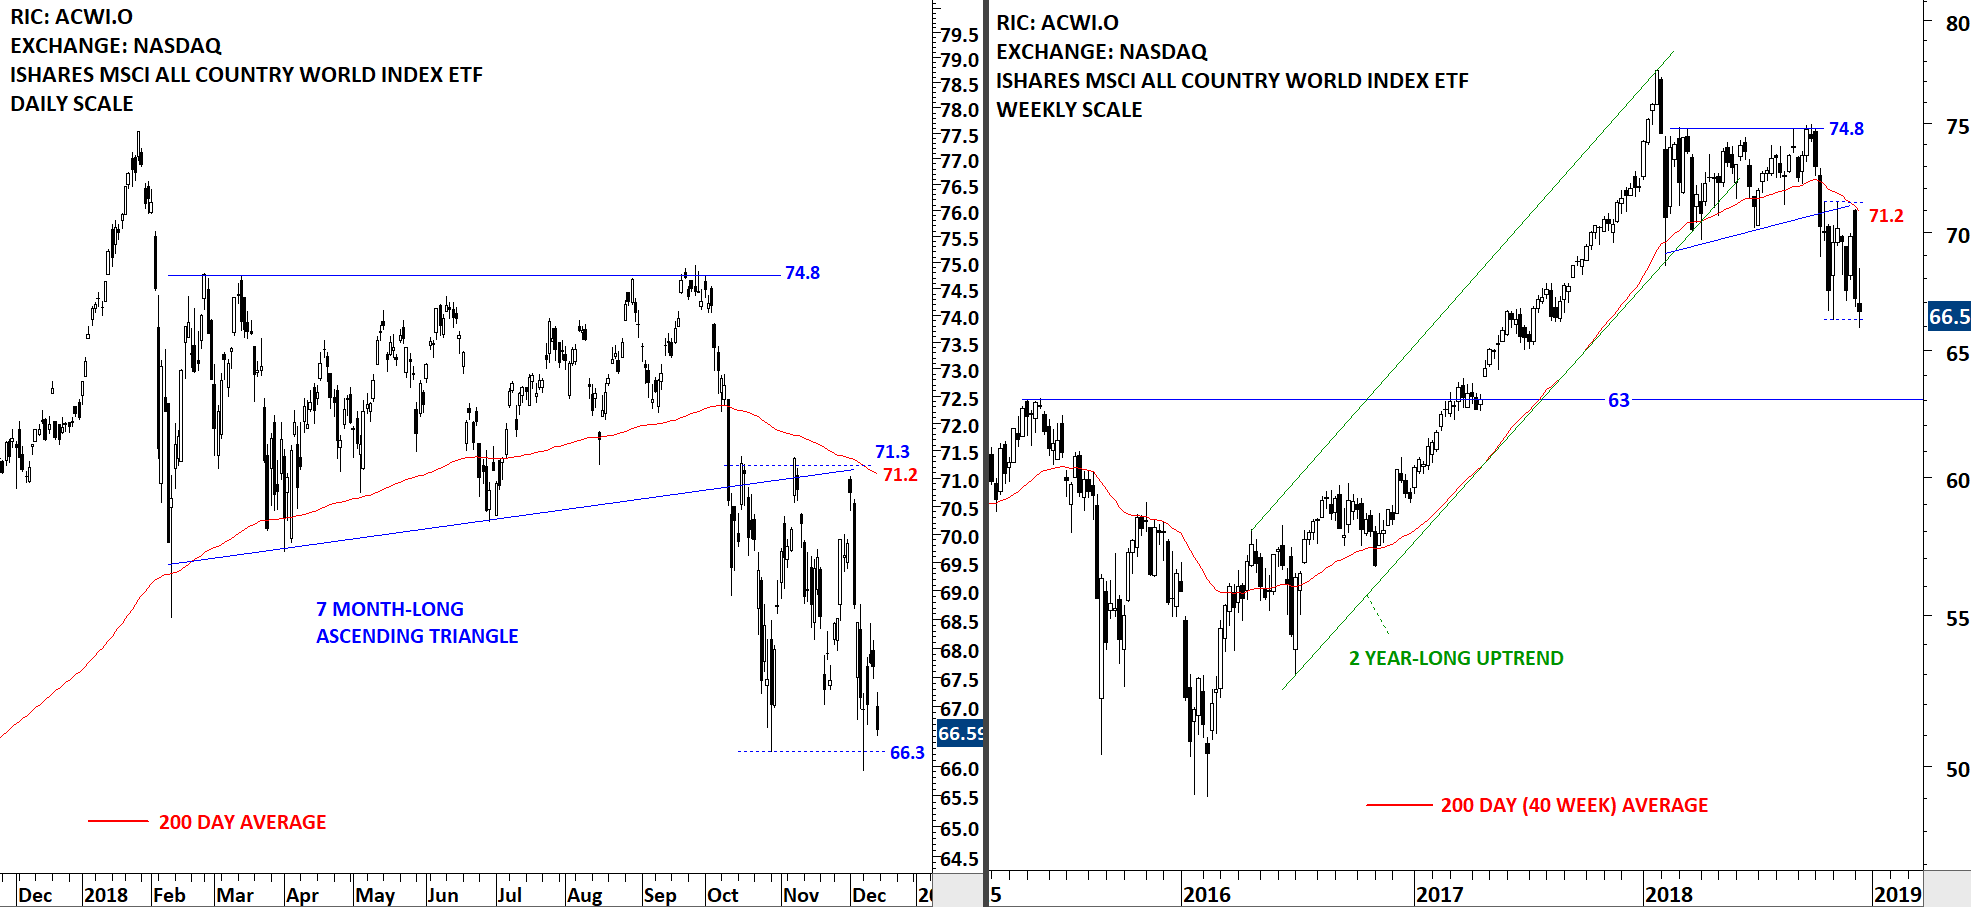
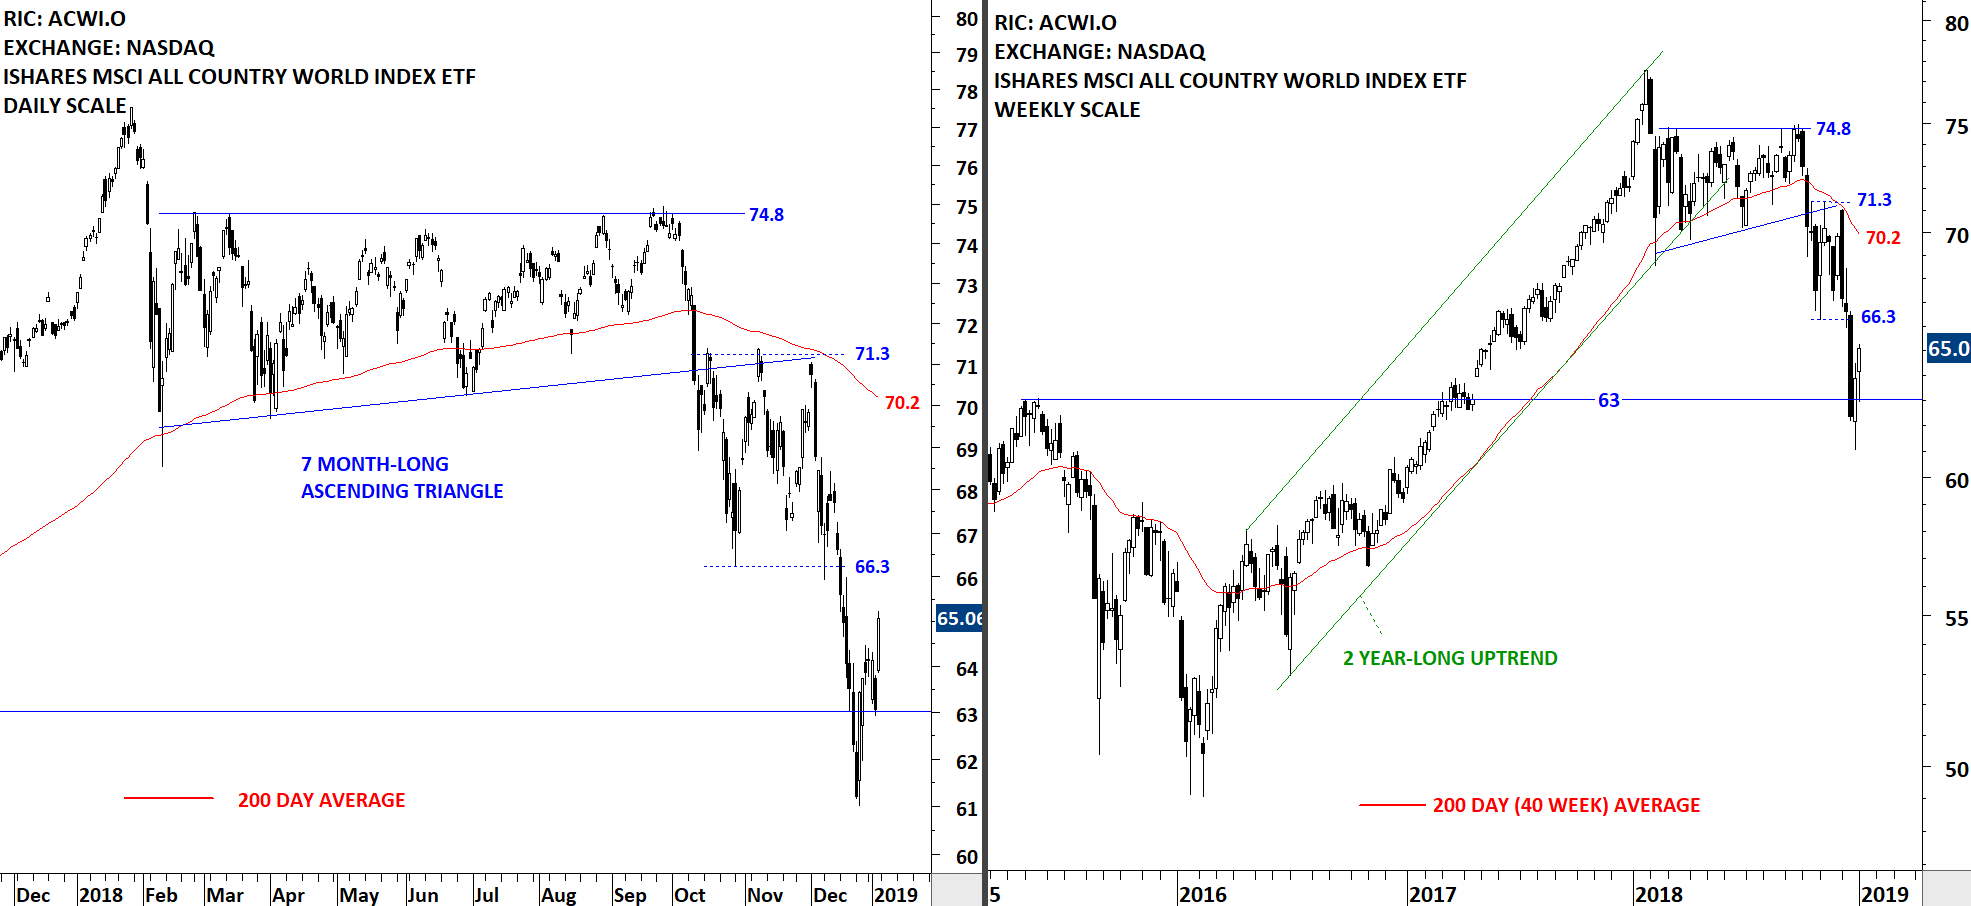
Global equity markets performance as measured by the iShares MSCI All Country World Index ETF (ACWI.O), formed a new trading range between 66.3 and 71.3 levels. Over the past 3 months the ETF has been consolidating in a wide range below its long-term (200-day) average. Breakdown of the wide 3 month-long consolidation can send the ETF towards the next support level at 63. If the ETF manages to hold above the support at 66.3 levels, we can expect further consolidation between 66.3 and 71.2.
 Read More
 Read More