EUROPE HEDGED EQUITY FUND (HEDJ.K)
Reminder:
Both Members and Non-Members are invited to join us for the public webinar on Thursday, May 17, 11am mountain: Tech Charts Year in Review. I will compare the before and after of charts shared with Members over the last year and go through some of the developing chart setups on equities and Global indices. I will also discuss some statistics on chart pattern reliability. As always, we’ll end the webinar with a live Q&A.
If you have any questions you’d like to submit, please send them to us via the “Contact” link under Support on our website.
Every week Tech Charts Global Equity Markets report features some of the well-defined, mature classical chart patterns under a lengthy watchlist and the chart pattern breakout signals that took place during that week. Global Equity Markets report covers single stocks from developed and emerging markets, ETF’s and global equity indices. The report starts with a review section that highlights the important chart developments on global equity benchmarks. This blog post features a recent breakout opportunity in European equity ETF listed on the NYSE.
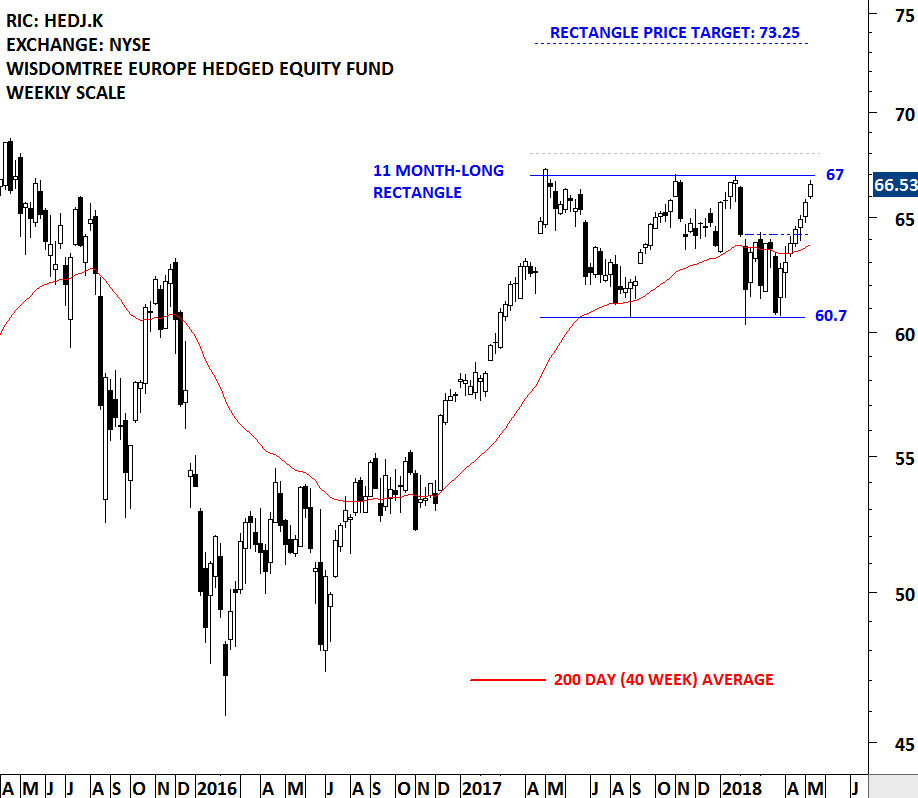
WISDOMTREE EUROPE HEDGED EQUITY FUND (HEDJ.K)
WISDOMTREE EUROPE HEDGED EQUITY FUND seeks results that correspond to the price and yield performance of the WisdomTree DEFA International Hedged Equity Index. The Index is designed to provide exposure to equity securities in Europe, Far East Asia and Australasia, while at the same time hedging exposure to fluctuations in the currency market. The ETF is listed on the New York Stock Exchange. Price chart is possibly forming a 11 month-long rectangle with the horizontal boundaries acting as resistance at 67 levels and support at 60.7 levels. Both boundaries are well-defined and were tested several times. Breakouts after several tests of chart pattern boundary can result in a strong directional movement. A daily close above 68 levels will confirm the breakout from the 11 month-long rectangle with the possible chart pattern price target of 73.25 levels.
Our year anniversary is fast approaching. In May our Tech Charts quarterly and yearly membership rates will increase. If you’re interested in becoming a Tech Charts member, get in NOW before this increase takes place. As a reminder your membership rate is locked in for the life of your active subscription.
Tech Charts Membership

By becoming a Premium Member, you’ll be able to improve your knowledge of the principles of classical charting.
With this knowledge, you can merge them with your investing system. In fact, some investors use my analyses to modify their existing style to invest more efficiently and successfully.

As a Premium Member of Aksel Kibar’s Tech Charts,
You will receive:
-
Global Equities Report. Delivered weekly.
-
Classical charting principles. Learn patterns and setups.
-
Actionable information. Worldwide indices and stocks of interest.
-
Risk management advice. The important trading points of each chart.
-
Information on breakout opportunities. Identify the ones you want to take action on.
-
Video tutorials. How patterns form and why they succeed or fail.
-
Watch list alerts. As they become available so you can act quickly.
-
Breakout alerts. Usually once a week.
-
Access to everything (now and as it becomes available)o Reports
o Videos and video series -
Multi-part webinar course. You learn the 8 most common charting principles.
-
Webinars. Actionable and timely advice on breaking out chart patterns.
For your convenience your membership auto renews each year.


