Posts

GLOBAL EQUITY MARKETS – October 21, 2017

REVIEW


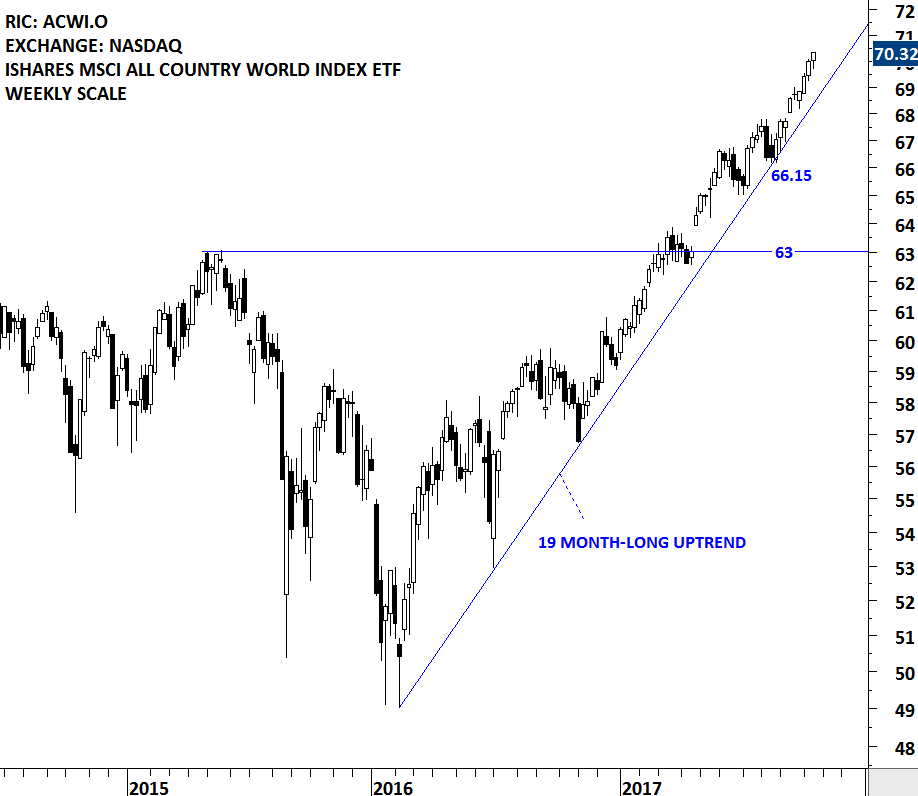
This was another week of strong global equity market performance. Benchmark for the global equity market performance, the MSCI All Country World Index ETF (ACWI.O) remains in an uptrend above its 19 month-long trend support. Both the long and short-term charts are showing steady uptrend for the ACWI. At this point there is no clear chart pattern that would suggest a reversal of the strong uptrend.

Read More

GLOBAL EQUITY MARKETS – September 30, 2017

REVIEW


Uptrend remains intact for the emerging markets index. MSCI Emerging Markets Index cleared decade-long trend resistance at 1,015 levels and continues to trend higher. Strong support remains between 1,000 and 1,015 levels. Last one week's pull back is possibly finding support at the lower boundary of the year-long upward trend channel. Weekly candlestick pattern (hammer) on iShares MSCI Emerging Markets Index ETF (EEM) is featured in the following chart. Hammer candlestick pattern at support area can signal a bullish reversal.

Read More

GLOBAL EQUITY MARKETS – August 26, 2017

REVIEW


Strong weekly performance of the Chinese SSE Composite Index is worth mentioning in this weeks update. Strength in the Chinese equities helped MSCI Emerging Markets Index to remain resilient during the last few week's of global equity market weakness. MSCI Emerging Markets index that cleared decade-long trend resistance in July, held on to its earlier gains during the month of  August.

Read More

EUROSTOXX 50 INDEX & EMERGING MARKETS

There is enough technical evidence that emerging markets found strong resistance around the current levels. The MSCI EM USD price index tested its decade-long trend line and also the upper boundary of its year-long trend channel. However, it is still early to call for a possible reversal from the strong resistance area. MSCI EM index is possibly forming a decade-long symmetrical triangle.

Read More

GLOBAL EQUITY MARKETS – July 8, 2017

REVIEW


It has been more than six months that the U.S. small caps are trading in a tight range. One of the well-defined chart patterns the weekly global equity markets report frequently discussed was the ISHARES CORE S&P Small-Cap ETF. IJR has a well-defined trading range between 66.9 and 70.8 levels. The ETFs price is holding above the 18 month-long upward trend line. A directional move should follow soon. The margin between the multi-month trend line and the upper boundary of the 6 month-long rectangle has narrowed. A daily close above 71.80 will confirm the breakout from the 5 month-long rectangle and suggest higher prices. A breach below the 18 month-long trend line can put pressure on the small caps and push prices towards the lower boundary of the rectangle at 66.9 levels.

Read More

GLOBAL EQUITY MARKETS – June 3, 2017

This week's Global Equity Markets report covers several ETFs and global equity indices and single stocks from Developed and Emerging countries. You will find that some of the themes are longer-term and can offer great opportunity once these chart patterns are resolved on the upside. The info-graphic below explains what each label on the charts and section headers stand for. I hope this will make it easier to navigate through the charts.

Read More