Posts

GLOBAL EQUITY MARKETS – March 3, 2018

Reminder on Live Webinar

Due to very positive feedback we got for the last webinar on rectangle chart patterns, we are continuing the webinar series with another reliable horizontal chart pattern; the ascending triangle. Live Webinar and Q&A with Aksel - Thursday, March 8, 11am mountain. You can register here (Register for the Live Webinar)


REVIEW


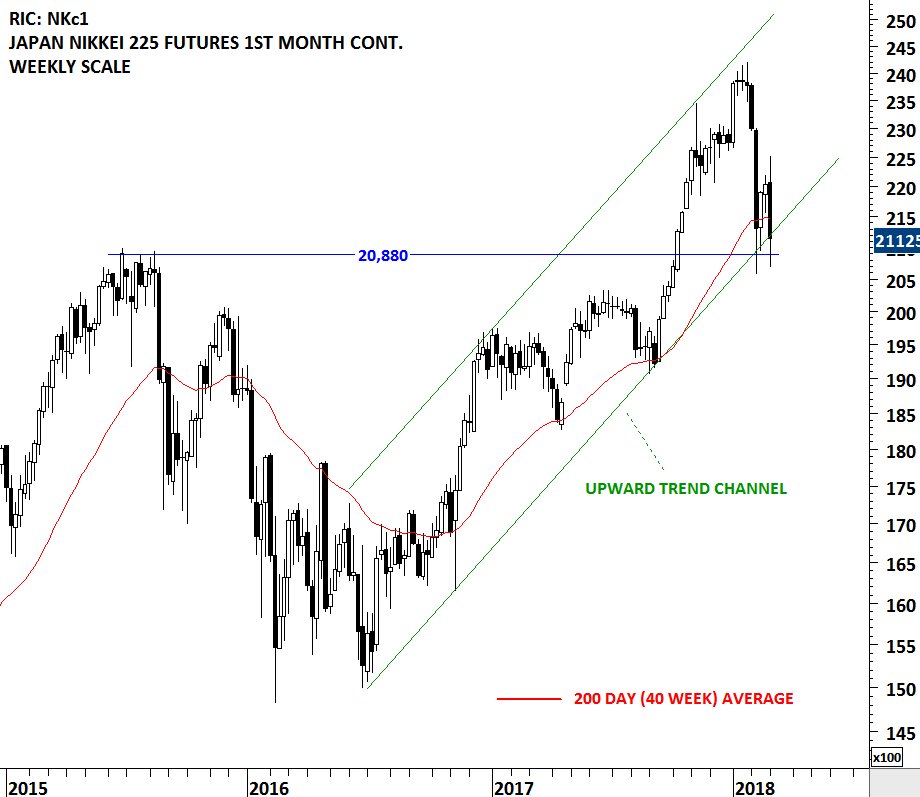
Equity indices that had weak rebound from the lows, tested the same support areas. Japan's Nikkei Index is one of them. On the weekly scale we can see that the upward trend channel is still intact with the support forming at 20,880 levels. On the daily scale price chart (futures price data to capture Friday's close) we can see that the Friday's recovery on U.S. indices helped the Nikkei Futures to form a Doji candlestick at the support. Failure to hold these levels can result in a larger scale correction. In the short-term Japan's Nikkei will try to find support around 20,880 levels and if it succeeds we will possibly label the price action as a double bottom.

Read More

GLOBAL EQUITY MARKETS – February 24, 2018

REVIEW


Global equity markets rebounded sharply and held on to last week's gains. I follow the iShares MSCI All Country World Index ETF (ACWI.O) as a benchmark for the Global equity markets performance. The ETF is in a steady uptrend above the long-term (200 day, 40 week) average. Volatility increased in the month of February after the sharp sell-off in the equity markets. The ACWI ETF tested its long-term average which is now acting as strong support at 70 levels. Choppy sideways price action can continue for some time until we see lower levels on volatility. Usually, markets go through a period of consolidation after sharp corrections. I think we are in that stage.

Read More

GLOBAL EQUITY MARKETS – February 17, 2018

REVIEW


Global Equity Markets had a strong rebound from their long-term averages. A benchmark for Global equity market performance; the iShares MSCI All Country World Index ETF rebounded from its 200-day (40 week) average and the lower boundary of its multi-month long upward trend channel. Long-term uptrend remains intact. In the following weeks Global equity indices will possibly continue to consolidate in a range until volatility is back to lower levels. In case of a re-test of last week's lows, both the lower boundary of the uptrend and the long-term average will act as strong support levels.

Read More

GLOBAL EQUITY MARKETS – February 10, 2018

REVIEW


Global equity benchmarks deviated far from the averages that a 10% correction in 2 weeks is still considered a reversion to the mean. With this week's continued sell-off both benchmarks for Global equities, the iShares MSCI All Country World Index ETF and the iShares MSCI Emerging Markets Index ETF reached their respective 200-day (40 week) moving averages. The 200-day moving average and the lower boundary of multi-month long upward trend channels are forming support around the same levels. Read More

GLOBAL EQUITY MARKETS – February 3, 2018

REVIEW


2018 started with strong weekly gains. The steady uptrend on the iShares MSCI All Country World Index ETF took a steep shape in January due to back to back long weekly candlesticks. This week's sharp reversal gave back last two week's gains. From a classical charting perspective we don't have enough evidence to call the latest reversal a "market top". Multi month-long uptrend is still intact. We are currently experiencing a reversion back to the averages or to the long-term trend line supports. Global equities can retrace further and major equity benchmarks can still remain in their long-term uptrends. We will need more evidence in the following weeks.

Read More

GLOBAL EQUITY MARKETS – January 27, 2018

REVIEW


This was another strong week for the Global Equity Markets. The iShares MSCI All Country World Index ETF, a benchmark for global equity markets performance, continued to resume its strong uptrend above the 21 month-long upward trend. The uptrend has taken a parabolic shape. Parabolic price action is not sustainable. Short-term pullback and reversion to the mean is a possibility. At this point there is no clear chart pattern that would suggest a trend reversal.

Read More

MSCI EMERGING MARKETS INDEX

Emerging Markets equities continue to remain strong. A widely followed benchmark for the Emerging Markets equity performance, MSCI Emerging Markets index resumes its multi-month uptrend in a steady parallel trend channel. Last one month's short-term consolidation can be identified as a possible flag; a bullish continuation chart pattern. The lower boundary of the flag at 1,100 level will act as a short-term support. Earlier in July 2017, the MSCI Emerging Markets index cleared a decade-long trend line resistance at 1,015 levels as shown on the monthly scale price chart.

Read More

GLOBAL EQUITY MARKETS – November 18, 2017

REVIEW


Emerging Markets equities continue to remain strong. A widely followed benchmark for the Emerging Markets equity performance, MSCI Emerging Markets index resumes its multi-month uptrend in a steady parallel trend channel. Last one month's short-term consolidation can be identified as a possible flag; a bullish continuation chart pattern. The lower boundary of the flag at 1,100 level will act as a short-term support. Earlier in July 2017, the MSCI Emerging Markets index cleared a decade-long trend line resistance at 1,015 levels as shown on the monthly scale price chart.

Read More

GLOBAL EQUITY MARKETS – October 28, 2017

REVIEW


The XAU is a capitalization-weighted index of thirty precious metal mining companies that has been traded on the Philadelphia Stock Exchange since 1983. As its name suggests it includes both gold and silver mining companies. In order to track gold and silver mining companies performance in an index there are several options available for investors, but the two most watched indices are: the NYSE Arca Gold BUGS (Basket of Unhedged Gold Stocks) Index (called the HUI Index) and Philadelphia Gold and Silver Index (called the XAU Index). Below chart features the Philadelphia Gold and Silver Index. Also this week's report highlights several great bearish chart setups on Silver mining equities and ETFs.

Over the past 10 months the Philadelphia Gold and Silver Index has been in a sideways consolidation. The index is possibly forming a symmetrical triangle that can act as a bearish continuation chart pattern. Several bearish chart setups in the junior mining companies and ETFs suggest that mining stocks can come under selling pressure in the following weeks. The lower boundary of the 10 month-long symmetrical triangle stands at 80.3 levels. This week's price action reached the lower boundary of the possible symmetrical triangle. I will monitor the strong support at 80.3 in the following weeks. A breakdown of the multi-month consolidation can result in a downward trend on the XAU index.

Read More