Posts

GLOBAL EQUITY MARKETS – May 5, 2018

Dear Tech Chart followers,

Every week Tech Charts Global Equity Markets report features some of the well-defined, mature classical chart patterns under a lengthy watch list and the chart pattern breakout signals that took place during that week. Global Equity Markets report covers single stocks from developed and emerging markets, ETF’s and global equity indices. The report starts with a review section that highlights the important chart developments on global equity benchmarks. Following the breakout alerts and the lengthy watch list, a section on correlation helps members to see the degree of relationship between the stocks and indices in the weekly report.

Below I'm sharing with you a sample report that was published on May 5, 2018. I hope this sample report will give you an idea of what to expect from the weekly Global Equity Markets report that Tech Charts Members receive.


REVIEW


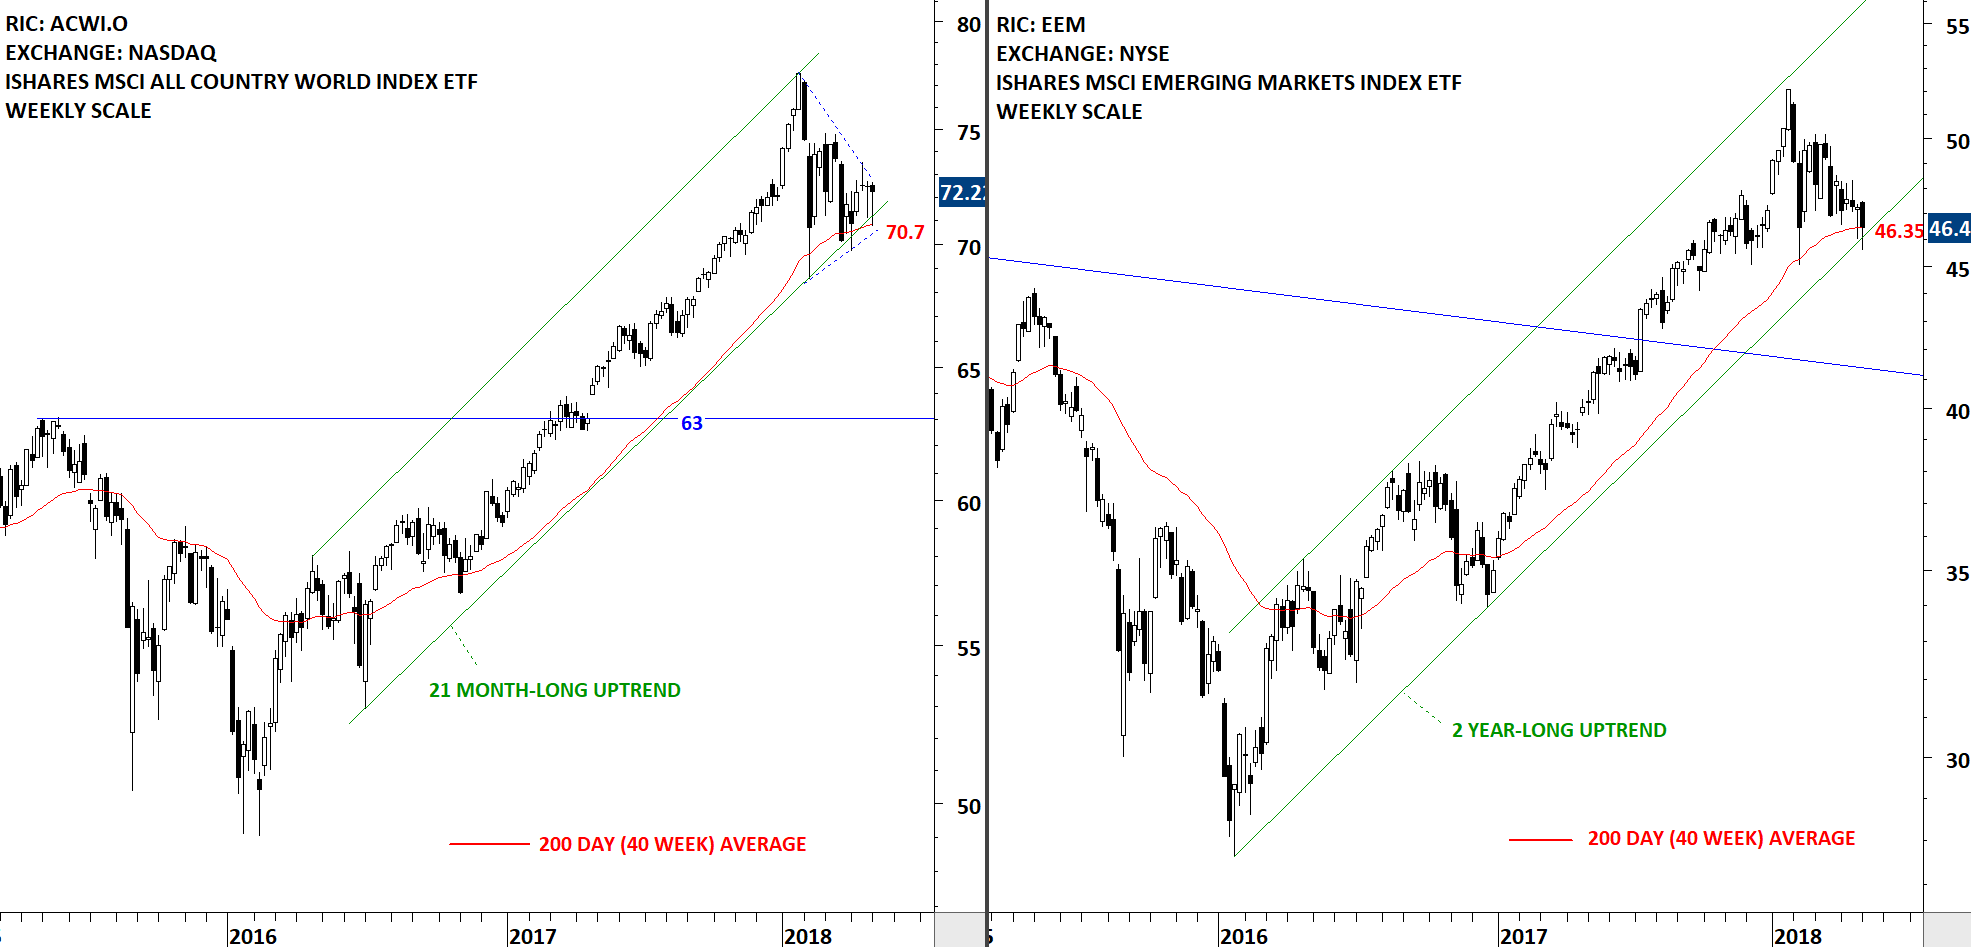
Global equity markets is getting closer to a strong directional movement. Tight consolidations on both the iShares MSCI All Country World Index ETF and the iShares MSCI Emerging Markets Index ETF suggest breakouts can result in a trend period. Consolidations are followed by trends and vice versa. Both ACWI and EEM are trading above their long-term moving averages and inside the boundaries of multi-month long uptrend channels. Breakdown below the long-term averages and the lower boundary of trend channels can result in a larger scale correction. At this point, with the current available information, we can conclude that the long-term uptrend is still intact. We are very close to the completion of last quarter's tight consolidation.
Read More

GLOBAL EQUITY MARKETS – May 5, 2018

Note on Dubai Traders Seminar:

Several Tech Charts members asked if the Dubai Traders Seminar presentation will be recorded and made available on Tech Charts website. Unfortunately the seminar was not recorded by the organizer. However, I will make this presentation available to our members via short educational videos in the following days/weeks. Each part of the presentation will address specific chart pattern examples presented in separate videos and will be archived under Educational Videos.

REVIEW


Global equity markets is getting closer to a strong directional movement. Tight consolidations on both the iShares MSCI All Country World Index ETF and the iShares MSCI Emerging Markets Index ETF suggest breakouts can result in a trend period. Consolidations are followed by trends and vice versa. Both ACWI and EEM are trading above their long-term moving averages and inside the boundaries of multi-month long uptrend channels. Breakdown below the long-term averages and the lower boundary of trend channels can result in a larger scale correction. At this point, with the current available information, we can conclude that the long-term uptrend is still intact. We are very close to the completion of last quarter's tight consolidation.

Read More

GLOBAL EQUITY MARKETS – April 14, 2017

Reminder: I will be speaking at the Dubai Traders Summit organized by MetaStock on April 26th. Over the past decade I worked for institutions in the region, managing funds & portfolios as well as analyzing Emerging and Frontier markets. At this one day event I hope to connect with Tech Charts members & followers, ex-colleagues and fellow traders to discuss some of the best classical chart patterns that helped me in making trading and investment decisions. Registration is free. You can follow this link to register >> DUBAI TRADERS SUMMIT APRIL 26th.

REVIEW


The benchmark for Global Equity Markets performance, iShares MSCI All Country World Index ETF is trying to rebound from strong support area formed by the 200-day (40 week) average and the lower boundary of upward trend channel. Failure to hold above support area can result in a larger scale correction. iShares MSCI Emerging Markets Index ETF (EEM) is also trying to find support around the long-term support area. While the long-term uptrend is still intact, we are possibly due for more choppy price action in the coming weeks. Several major Global equity indices are forming well-defined trading ranges. Charts below show the boundaries of these consolidations.

Read More