
GLOBAL EQUITY MARKETS – May 5, 2018
Dear Tech Chart followers,
Every week Tech Charts Global Equity Markets report features some of the well-defined, mature classical chart patterns under a lengthy watch list and the chart pattern breakout signals that took place during that week. Global Equity Markets report covers single stocks from developed and emerging markets, ETF’s and global equity indices. The report starts with a review section that highlights the important chart developments on global equity benchmarks. Following the breakout alerts and the lengthy watch list, a section on correlation helps members to see the degree of relationship between the stocks and indices in the weekly report.
Below I’m sharing with you a sample report that was published on May 5, 2018. I hope this sample report will give you an idea of what to expect from the weekly Global Equity Markets report that Tech Charts Members receive.
![]()
REVIEW
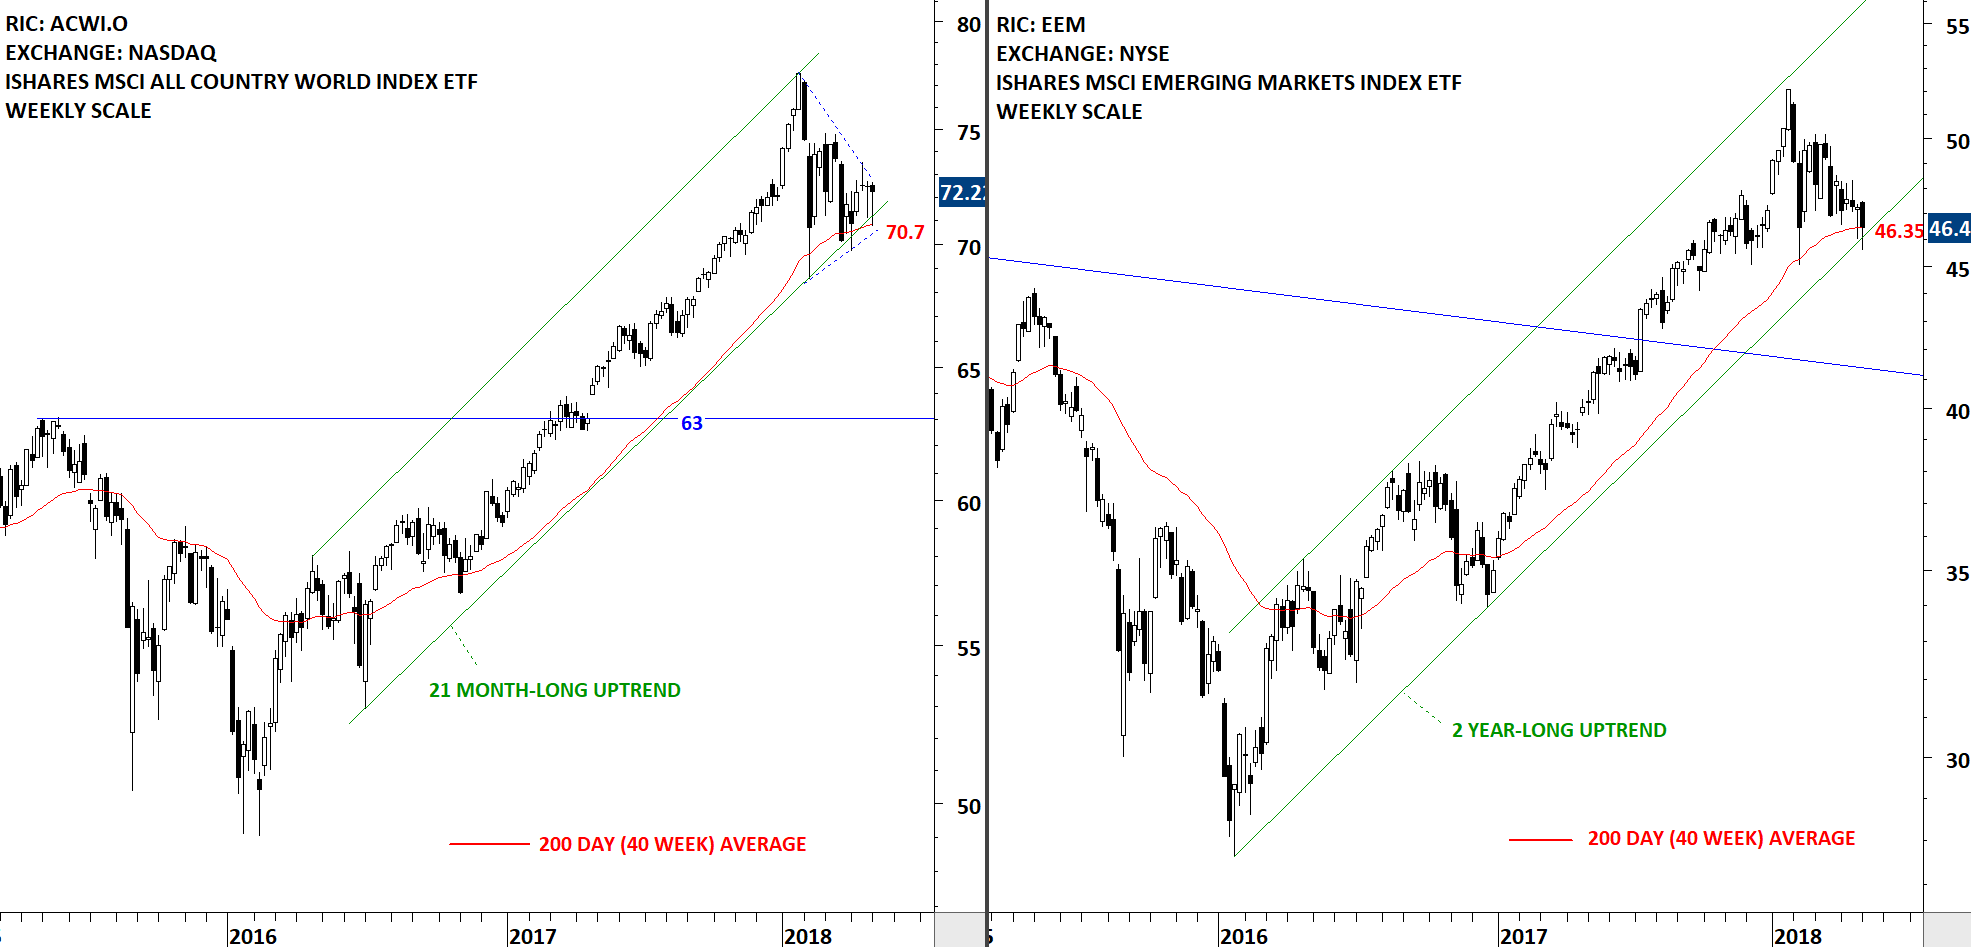
Global equity markets is getting closer to a strong directional movement. Tight consolidations on both the iShares MSCI All Country World Index ETF and the iShares MSCI Emerging Markets Index ETF suggest breakouts can result in a trend period. Consolidations are followed by trends and vice versa. Both ACWI and EEM are trading above their long-term moving averages and inside the boundaries of multi-month long uptrend channels. Breakdown below the long-term averages and the lower boundary of trend channels can result in a larger scale correction. At this point, with the current available information, we can conclude that the long-term uptrend is still intact. We are very close to the completion of last quarter’s tight consolidation.
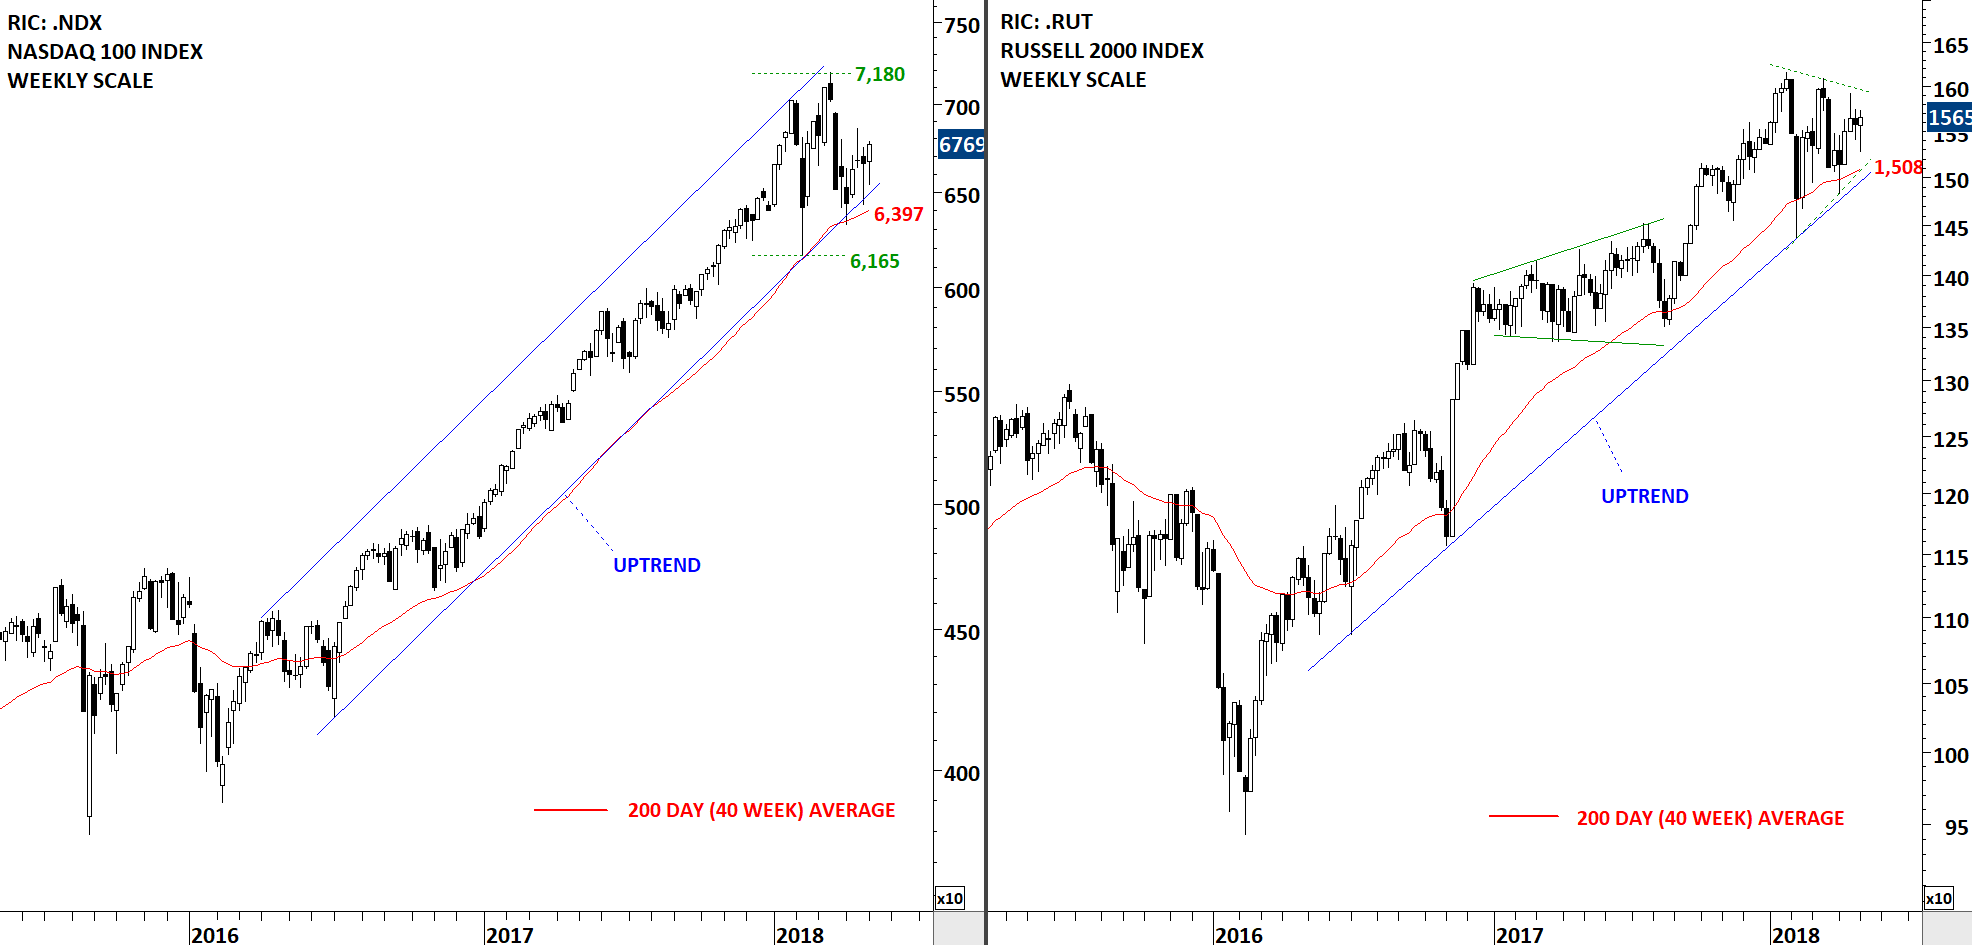
The benchmark for U.S. small cap equity performance, the Russell 2000 Index is holding well above its long-term average. The index is possibly forming a symmetrical triangle/pennant that can act as a continuation chart pattern. Long-term uptrend is still intact and we are getting closer to a directional movement. Similar price action can be seen on the Nasdaq 100. The index is holding above the long-term average (200 day (40 week) average) and inside the multi-month long uptrend channel. We can conclude that the long-term uptrend is still intact.
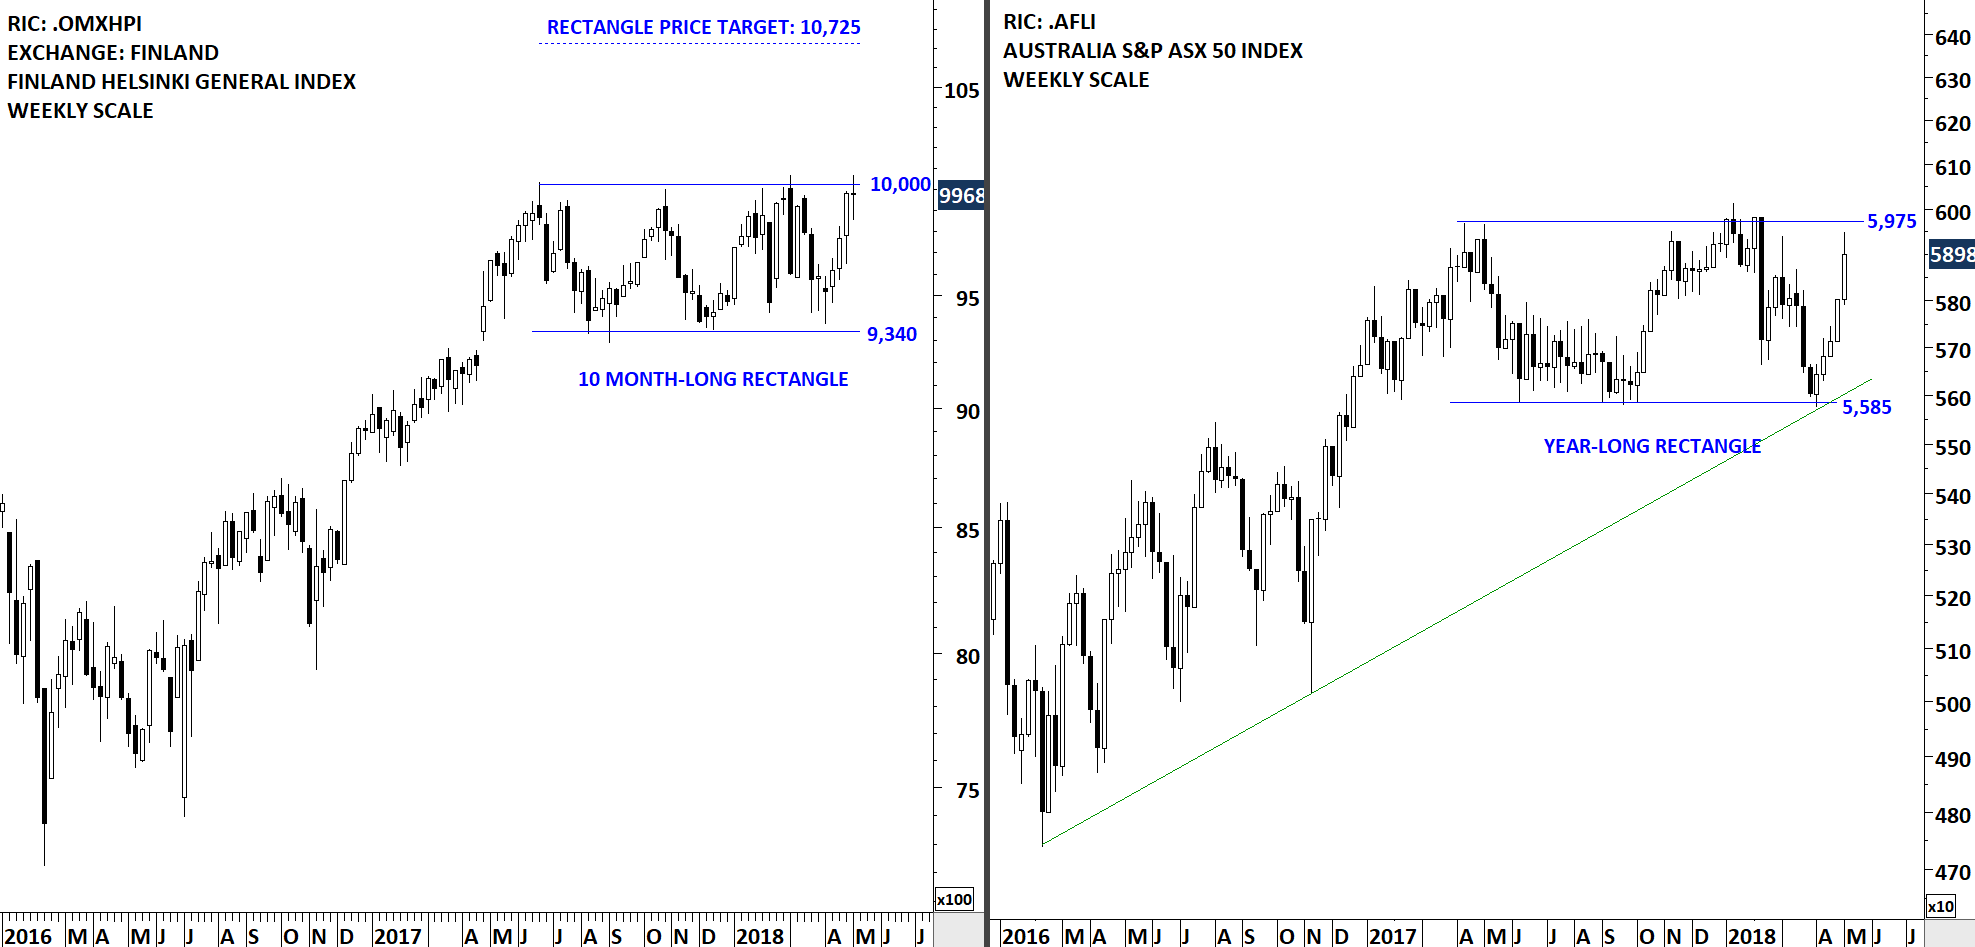
Previous updates featured Global equity benchmarks that have been consolidating in well-defined trading ranges. These charts offered great trading opportunities at a time when major global indices have been going through corrective periods. Both Finland Helsinki General Index and Australia S&P ASX 50 Index are featured below. Price charts formed multi-month long rectangles with well-defined boundaries. Finland’s equity benchmark tested the both chart pattern boundaries for several times. These rectangle chart patterns can act as bullish continuations. Strong resistance for Finland Helsinki General Index stands at 10,000 and for Australia S&P ASX 50 Index at 5,975 levels. Breakouts from multi-month long sideways consolidations can result in a strong trend period.
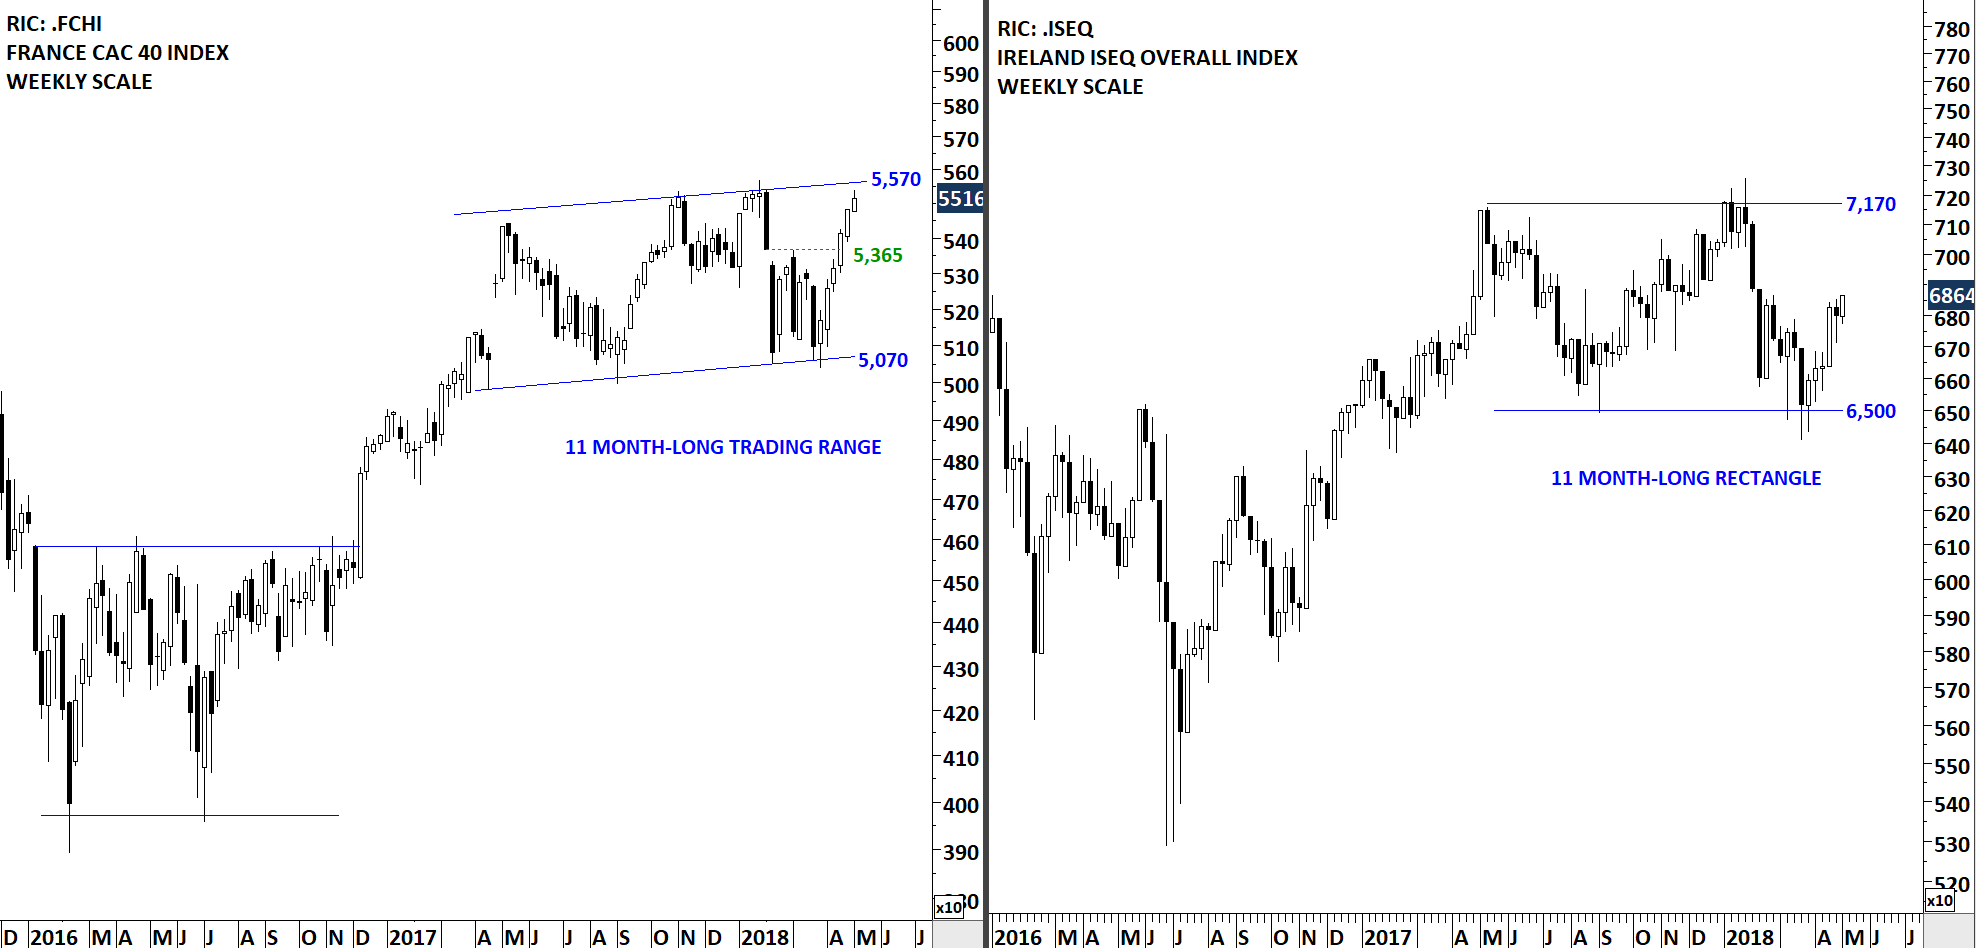
Other two well-defined trading ranges were highlighted on France CAC 40 Index and Ireland ISEQ Overall Index. CAC 40 Index reached the upper boundary of its 11 month-long trading range at 5,570 levels. We can expect this level to act as a short-term resistance. Ireland’s ISEQ Overall Index rebounded from the lower boundary of its 11 month-long consolidation and is still far from the upper boundary at 7,170 levels; a possible technical resistance.
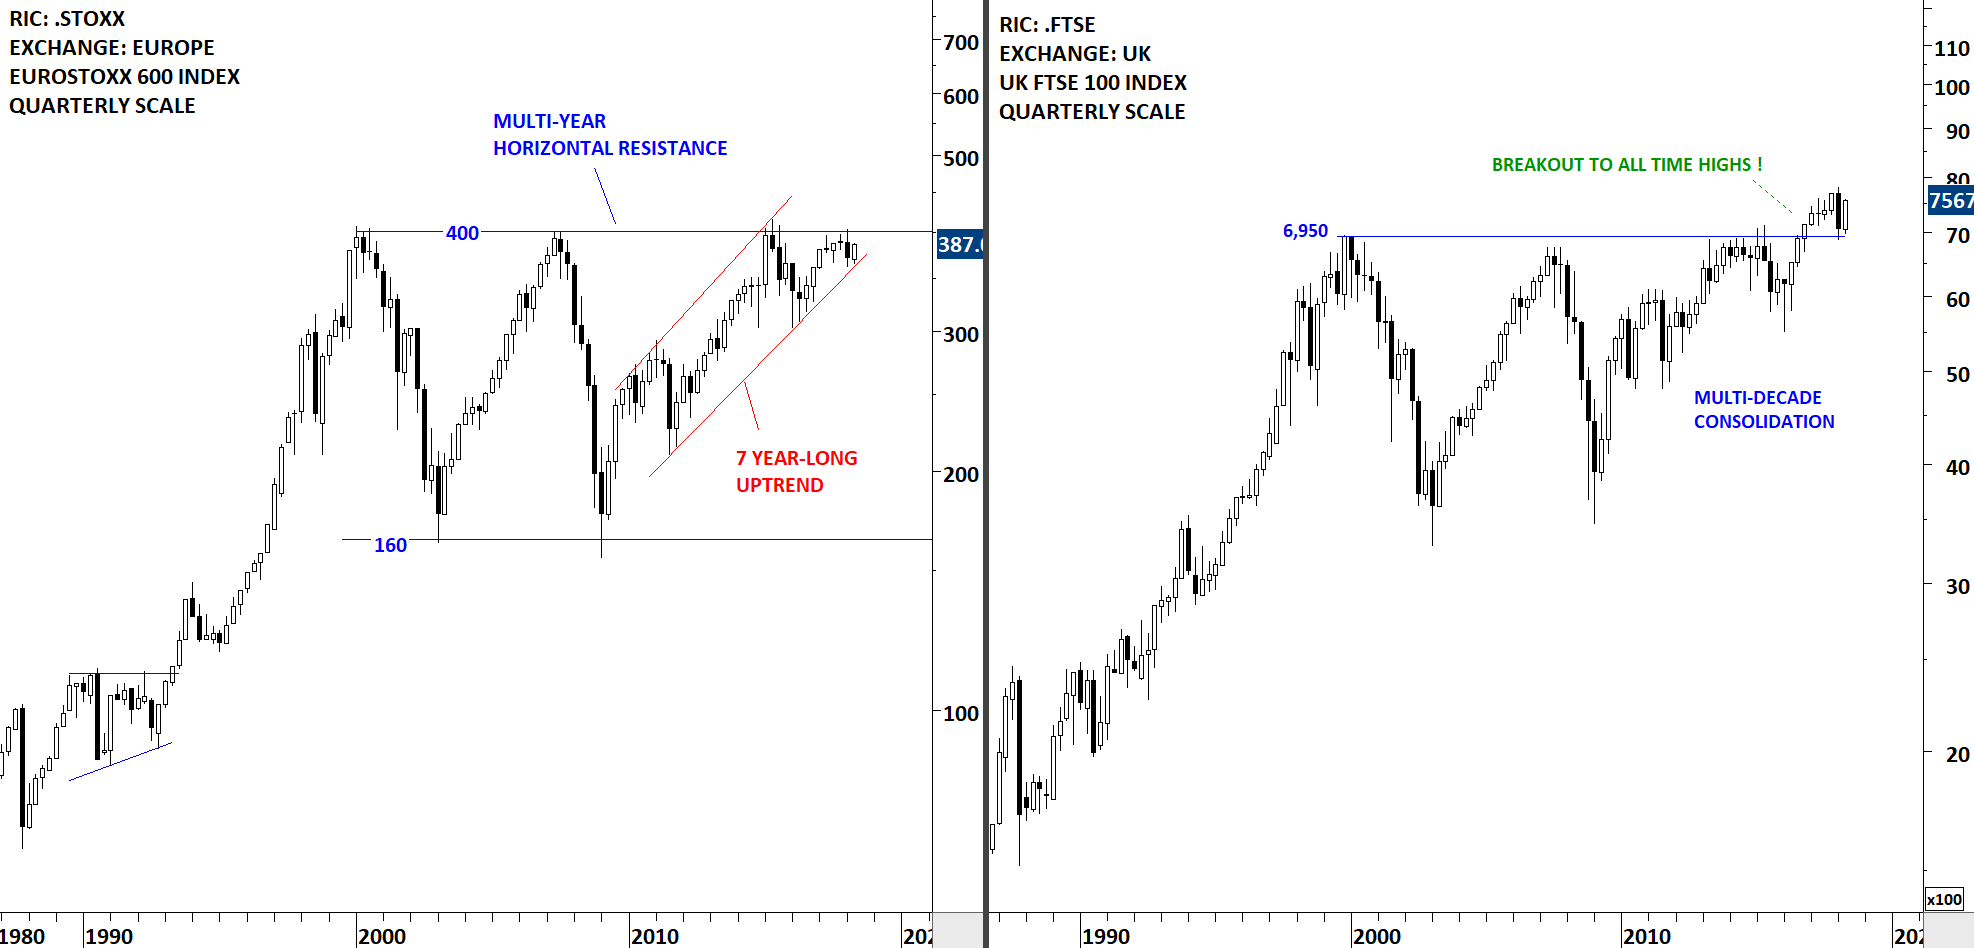
Previous resistance becomes the new support. After breaking out to all-time highs, UK FTSE 100 Index found support at the strong horizontal support at 6,950 levels. Strong rebound from the important technical level suggest that the uptrend is still intact and the long-term breakout is valid. Another European equity benchmark Euro Stoxx 600 Index is holding below the strong multi-year resistance at 400 levels. Euro Stoxx 600 Index has been in a steady uptrend over the past few years. Several tests of strong horizontal boundary can be an early indication of a possible long-term breakout. I continue to watch this long-term chart with a bullish bias.
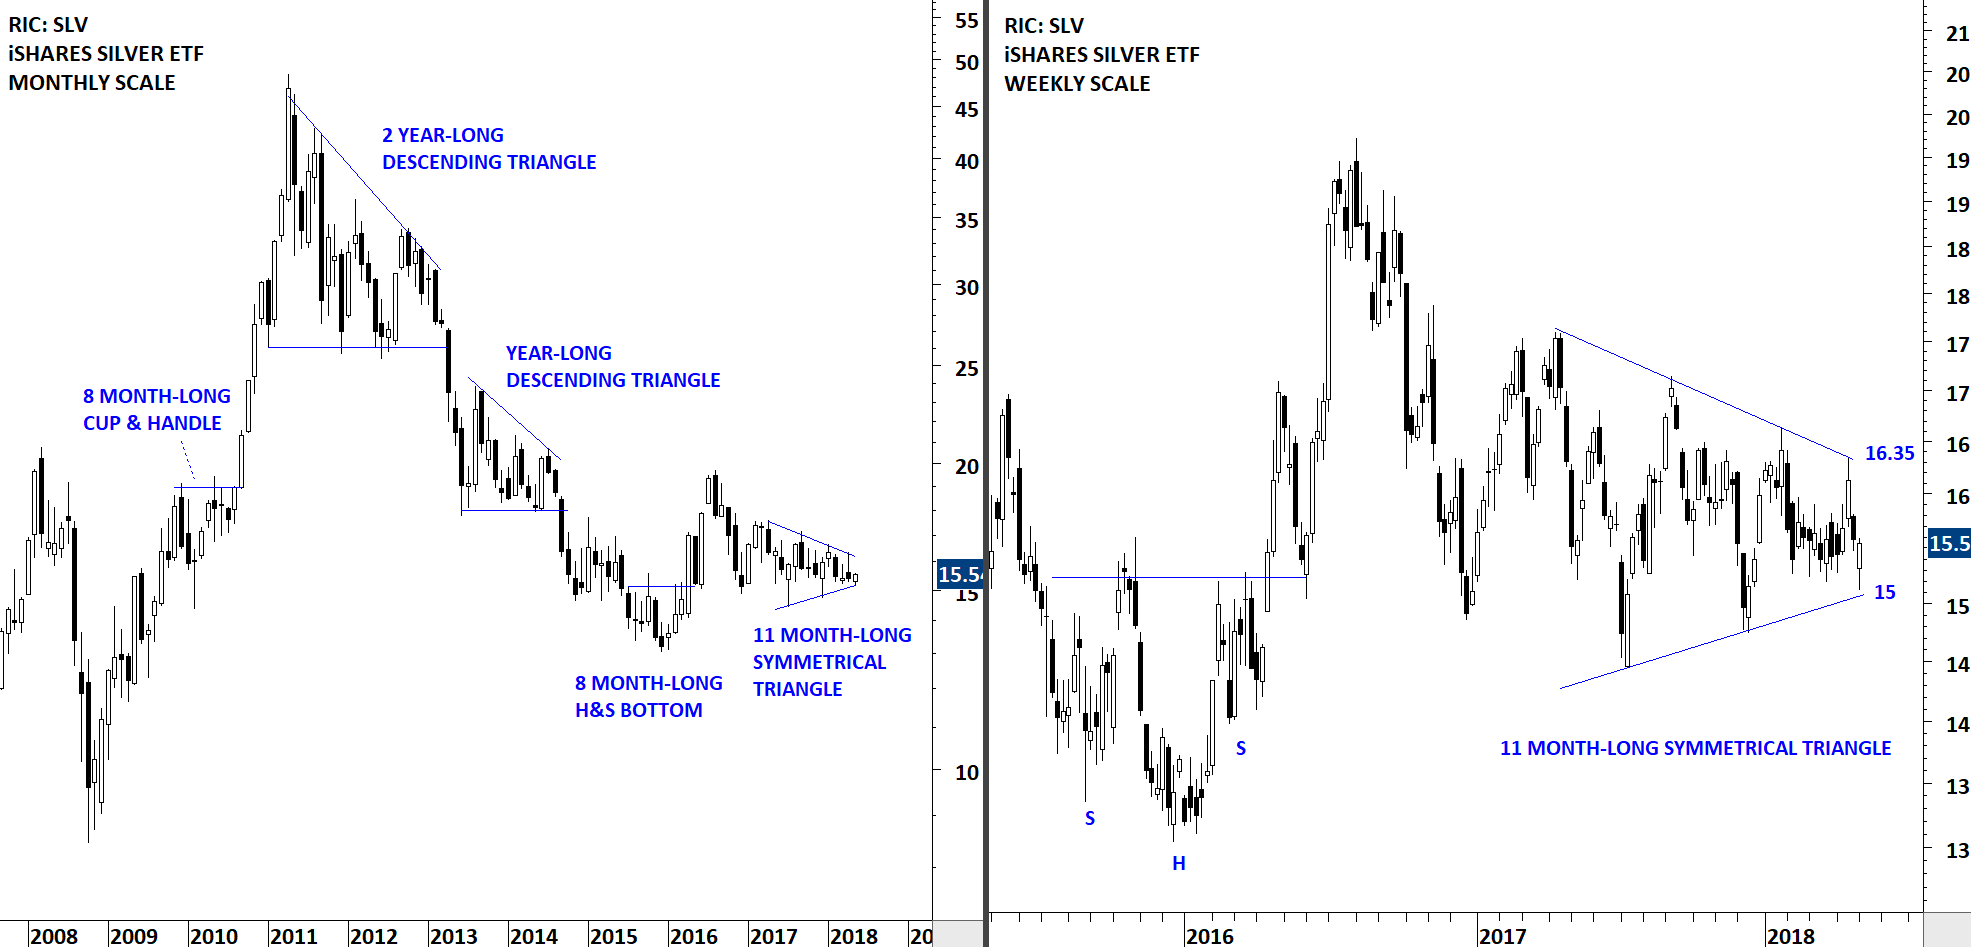
Silver ETF is another instrument with well-defined chart pattern boundaries. I like to see several tests of chart pattern boundaries before a breakout takes place. Several tests of chart pattern boundary confirms the recognition of these technical hurdles by market participants. Breakouts after several tests of chart pattern boundaries are usually followed by strong directional movement. iShares SILVER ETF continues to consolidate between the boundaries of a possible 11 month-long symmetrical triangle. The lower boundary is acting as support at 15 levels and the upper boundary as resistance at 16.35 levels. Breakout will possibly result in a strong directional movement. Silver ETF is on my radar.
There are 4 new chart pattern breakout signals.
TECH CHARTS ALERT
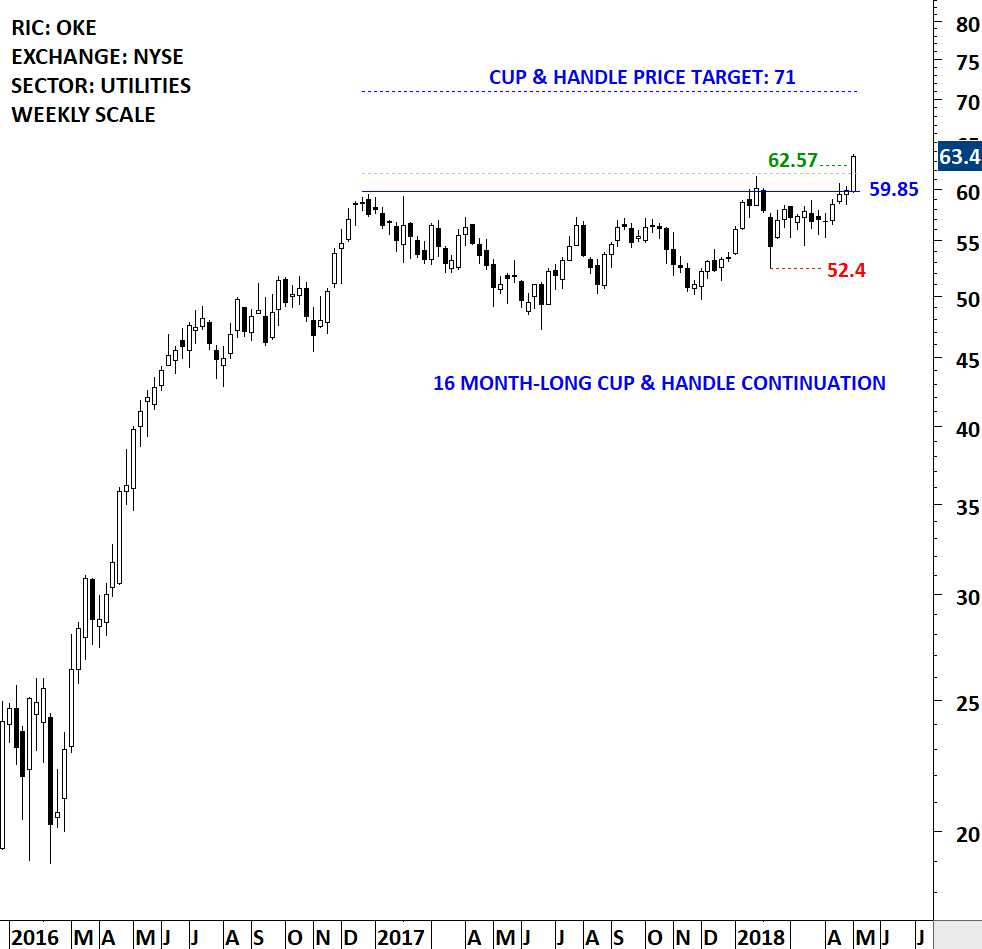
ONEOK INC (OKE)
ONEOK, Inc. is an energy midstream service provider in the United States. The Company owns and operates natural gas liquids (NGL) systems, and is engaged in the gathering, processing, storage and transportation of natural gas. The Company’s operations include a 38,000-mile integrated network of NGL and natural gas pipelines, processing plants, fractionators and storage facilities in the Mid-Continent, Williston, Permian and Rocky Mountain regions. The Company operates through three business segments. The Natural Gas Gathering and Processing segment provides midstream services to contracted producers in North Dakota, Montana, Wyoming, Kansas and Oklahoma. The Natural Gas Liquids segment owns and operates facilities that gather, fractionate, treat and distribute NGLs and store NGL products primarily in the Mid-Continental, Permian Basin and the Rocky Mountain regions. The Natural Gas Pipelines segment provides transportation and storage services to end users. The stock is listed on the New York Stock Exchange. Price chart formed a 16 month-long cup & handle continuation with the horizontal boundary acting as strong resistance at 59.85 levels. The daily close above 61.65 levels confirmed the breakout from the 16 month-long cup & handle continuation with the possible chart pattern price target of 71 levels.
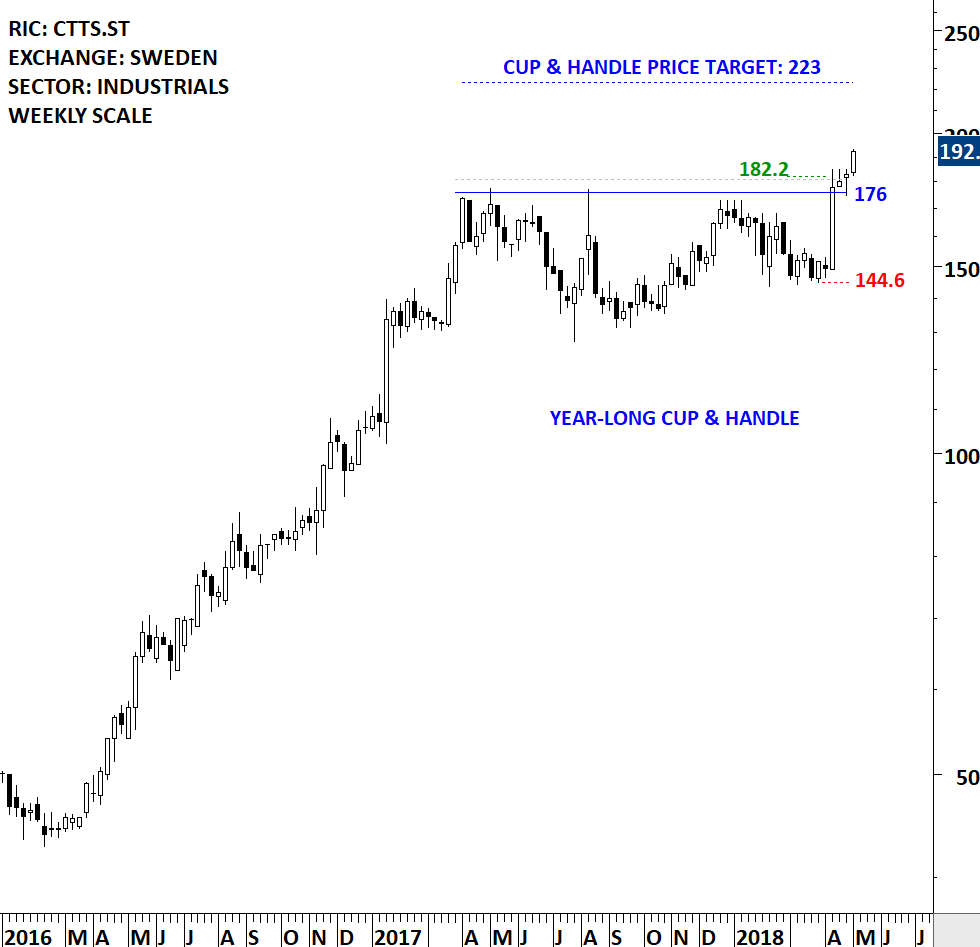
CTT SYSTEMS AB (CTTS.ST)
CTT Systems AB is a Sweden-based technology company engaged in the aviation industry. The Company develops, manufactures and sells humidity control systems for commercial aircrafts. The stock is listed on the Stockholm Stock Exchange. Price chart formed a year-long cup & handle continuation chart pattern with the horizontal boundary acting as strong resistance at 176.0 levels. The horizontal boundary was tested several times over the course of the chart pattern. The daily close above 181 levels confirmed the breakout from the year-long cup & handle continuation with the possible chart pattern price target of 223 levels. Please note that this is a small-cap company and liquidity is low.
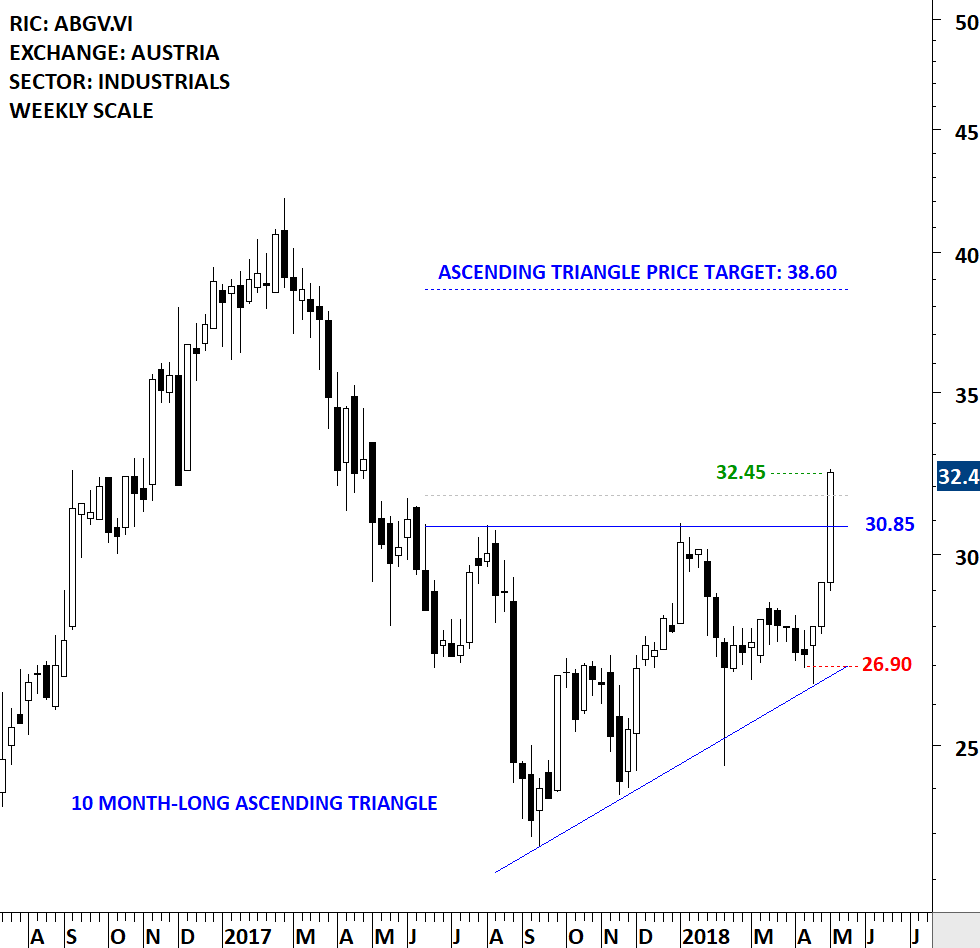
PORR AG (ABGV.VI)
Porr AG, formerly known as Allgemeine Baugesellschaft A Porr AG, is an Austrian holding and construction company. The Company provides services diversified into building construction, civil engineering, infrastructure construction, project development and environmental engineering. The Company has a number of offices located in Central, Eastern and South-Eastern Europe. Its services range from residential construction to infrastructure projects. The building construction services cover offices, hotels, universities and football stadiums, among others. The civil engineering services cover tunnels, bridges, railways and power plants, among others. The infrastructure construction services cover traffic infrastructure. The project development services are carried out by the Company’s subsidiaries Strauss & Partner Development GmbH, PORREAL Immobilien Management GmbH and UBM Realitaetenentwicklung AG. The environmental engineering services include design, financing and operation of plants. The stock is listed on the Vienna Stock Exchange. Price chart formed a 10 month-long ascending triangle that is possibly acting as a bottom reversal. Ascending triangle is a bullish chart pattern. Rising lows and horizontal resistance gives the chart pattern its bullish bias. The horizontal boundary was tested several times over the course of the chart pattern. The daily close above 31.75 levels confirmed the breakout from the 10 month-long ascending triangle with the possible chart pattern price target of 38.6 levels.
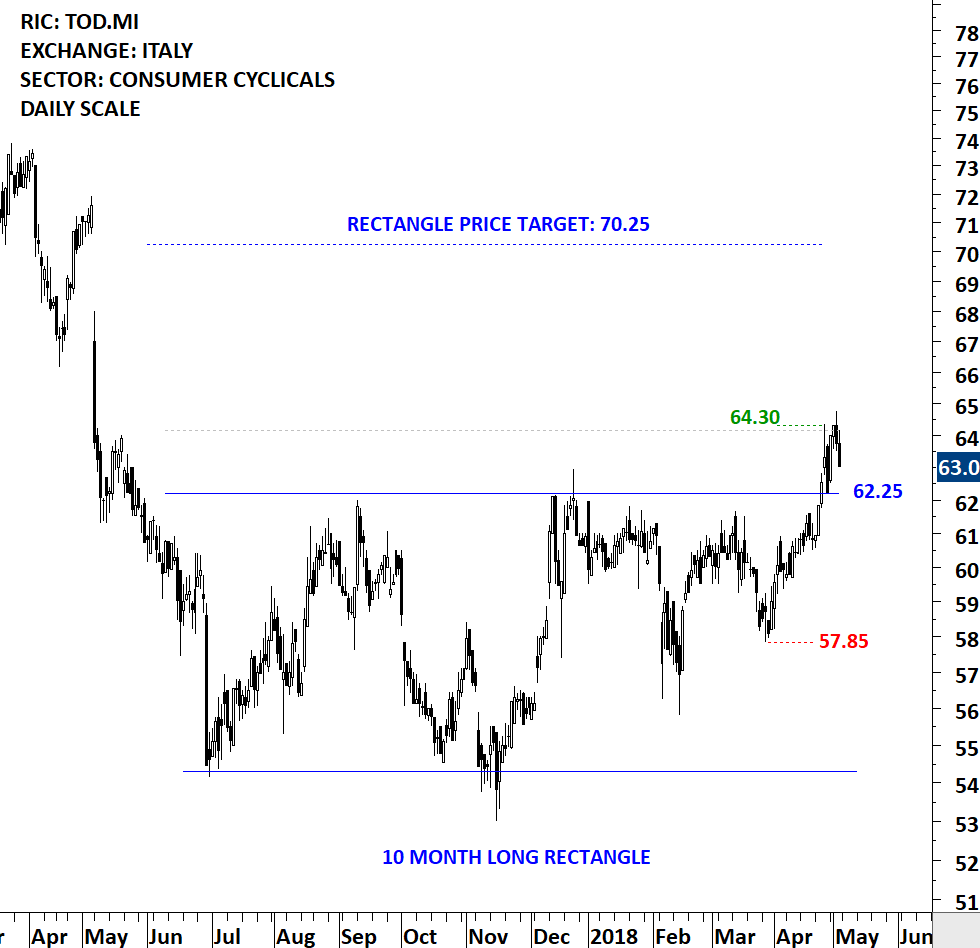
TOD’S SPA (TOD.MI)
TOD’S S.p.A. is a holding company. The Company creates, produces and distributes shoes, leather goods and accessories, and apparel. The Company operates in the luxury sector under its brands, TOD’S, HOGAN and FAY, and licensed brand, ROGER VIVIER. It produces shoes and leather goods in its plants, with partial outsourcing to specialized workshops. The Company offers its products to customers through a network of specialized stores. The TOD’S brand offers shoes and luxury leather goods. The stock is listed on the Milan Stock Exchange. Price chart formed a 10 month-long rectangle with the upper boundary acting as strong resistance at 62.25 levels. Rectangle chart pattern is possibly acting as a bottom reversal. The upper boundary was tested several times over the course of the chart pattern. The daily close above 64.15 levels confirmed the breakout from the 10 month-long rectangle with the possible chart pattern price target of 70.25 levels.
There are 9 additions to the Tech Charts Watchlist.
TECH CHARTS WATCHLIST
AMERICAS
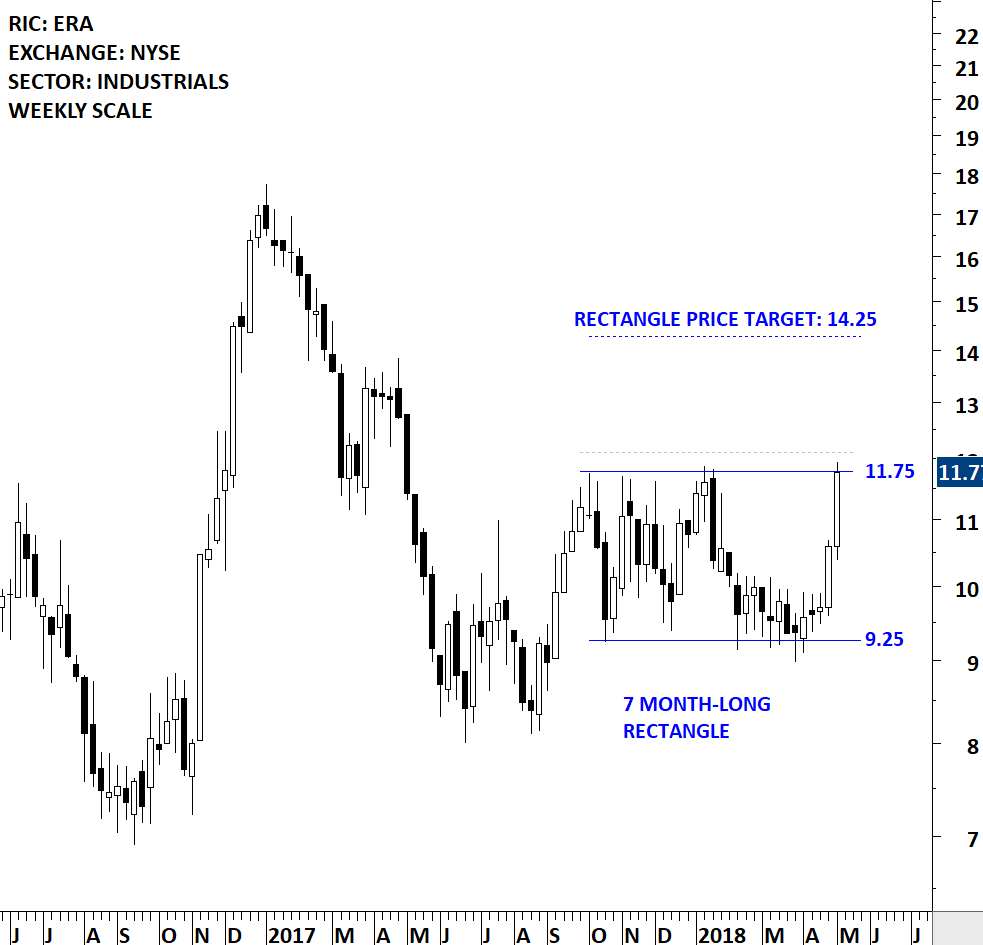
ERA GROUP INC (ERA)
Era Group Inc. is engaged in operating helicopters. The Company’s helicopters transport personnel to, from and between offshore oil and gas production platforms, drilling rigs and other installations. The Company also dry-leases helicopters to third-party helicopter operators and foreign affiliates. The primary users of the Company’s helicopter services are international, integrated and independent oil and gas exploration, development and production companies. In addition to serving the oil and gas industry, it provides air medical services; utility services, including support of firefighting, mining, power line and pipeline survey activities, and Alaska flightseeing tours, among other activities. It owns and operates a range of classes of helicopters, such as Heavy helicopters, Medium helicopters and Light helicopters. Heavy helicopters have twin engines and passenger capacity ranging from 16 to 19. Medium helicopters have twin engines and passenger capacity ranging from 11 to 12. The stock is listed on the New York Stock Exchange. Price chart formed a 7 month-long rectangle with the upper boundary acting as strong resistance at 11.75 levels. The upper boundary was tested several times over the course of the chart pattern. A daily close above 12.10 levels will confirm the breakout from the 7 month-long rectangle with the possible chart pattern price target of 14.25 levels.
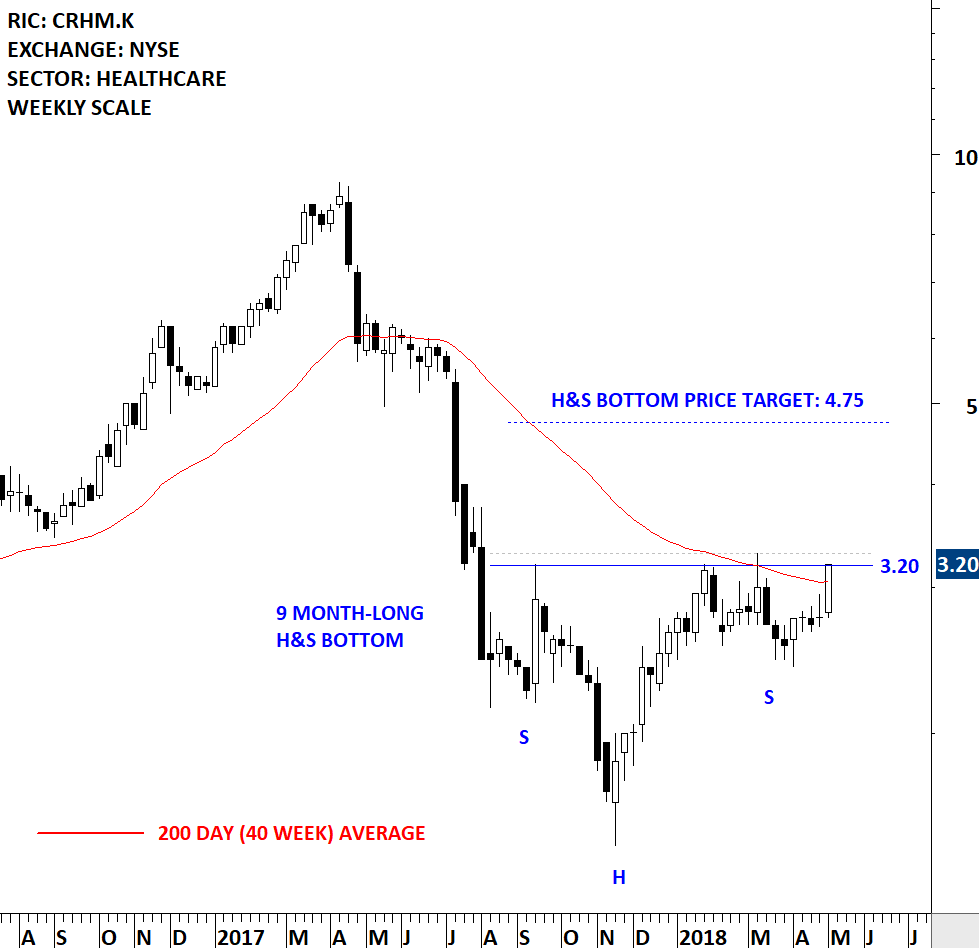
CRH MEDICAL CORP (CRHM.K)
CRH Medical Corporation is a Canada-based healthcare products and services company. The Company focused on providing physicians with services and products for the treatment of gastrointestinal diseases. The Company also provides anesthesiology services to gastroenterologists in the United States through its subsidiaries. The Company specializes in the treatment of hemorrhoids utilizing its treatment protocol and technology. The Company’s product distribution strategy focuses on physician education, patient outcomes, and patient awareness. The Company’s CRH O’Regan System, platform that provides gastrointestinal is a single use, disposable, hemorrhoid banding technology for treating hemorrhoid grades I-IV. The Company distributes the CRH O’Regan System, treatment protocols, operational and marketing expertise as a package to physicians. The Company’s subsidiary, Gastroenterology Anesthesia Associates, LLC, provides anesthesiology services for gastroenterology procedures. The stock is listed on the New York Stock Exchange. Price chart formed a 9 month-long head and shoulder bottom with the horizontal boundary acting as strong resistance at 3.20 levels. The neckline was tested several times over the course of the chart pattern. A daily close above 3.30 levels will confirm the breakout from the 9 month-long head and shoulder bottom with the possible chart pattern price target of 4.75 levels.
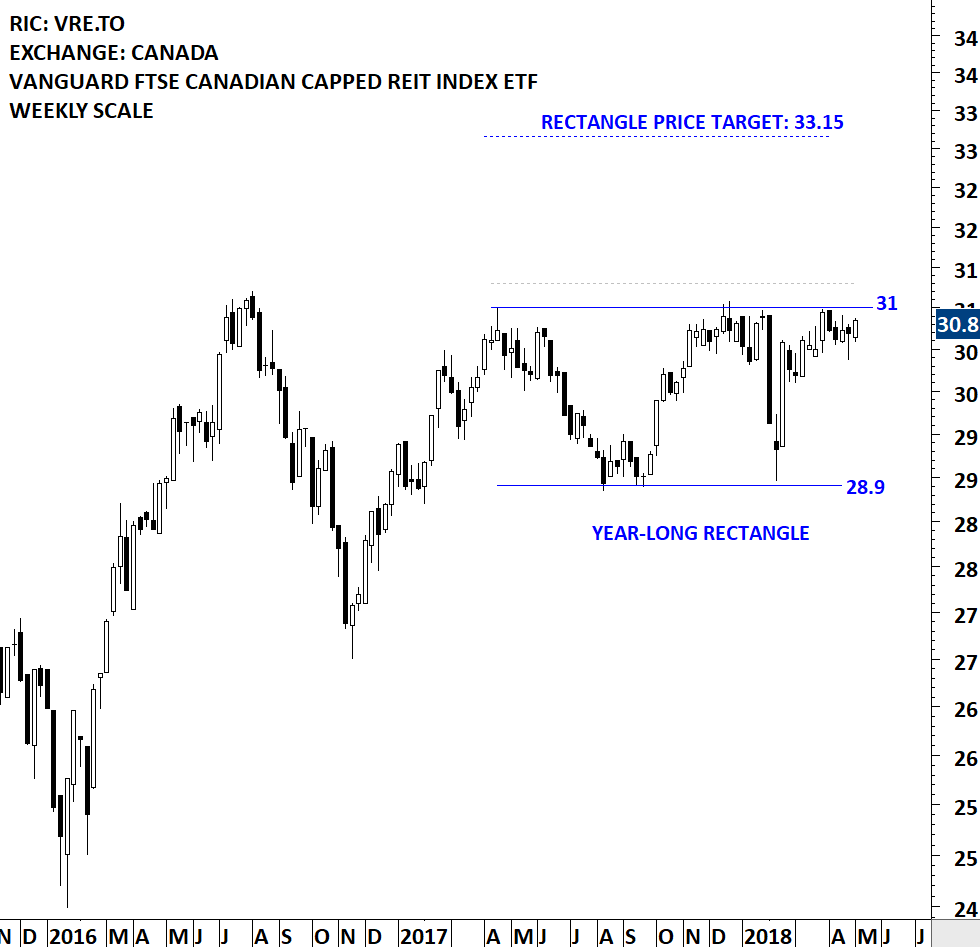
VANGUARD FTSE CANADIAN CAPPED REIT INDEX ETF (VRE.TO)
Vanguard FTSE Canadian Capped REIT Index ETF seeks to track, to the extent reasonably possible and before fees and expenses, the performance of a broad Canadian real estate equity index that measures the investment return of publicly traded securities in the Canadian real estate sector. Currently, this Vanguard ETF seeks to track the FTSE Canada All Cap Real Estate Capped 25% Index (or any successor thereto). It invests primarily in stocks of companies in the Canadian real estate sector. The ETF is listed on the Toronto Stock Exchange. Price chart formed a year-long rectangle with the strong horizontal boundary acting as resistance at 31 levels. The rectangle chart pattern can be part of a larger scale bullish ascending triangle. A daily close above 31.3 levels will confirm the breakout from the year-long consolidation with the possible chart pattern price target of 33.15 levels. Please note that, Vanguard FTSE Canadian Capped REIT Index ETF is not liquid. However, a breakout from the lengthy consolidation can have long-term positive implications for the Real Estate sector in Canada. Other Canadian Real Estate ETFs are XRE.TO and ZRE.TO.
EUROPE
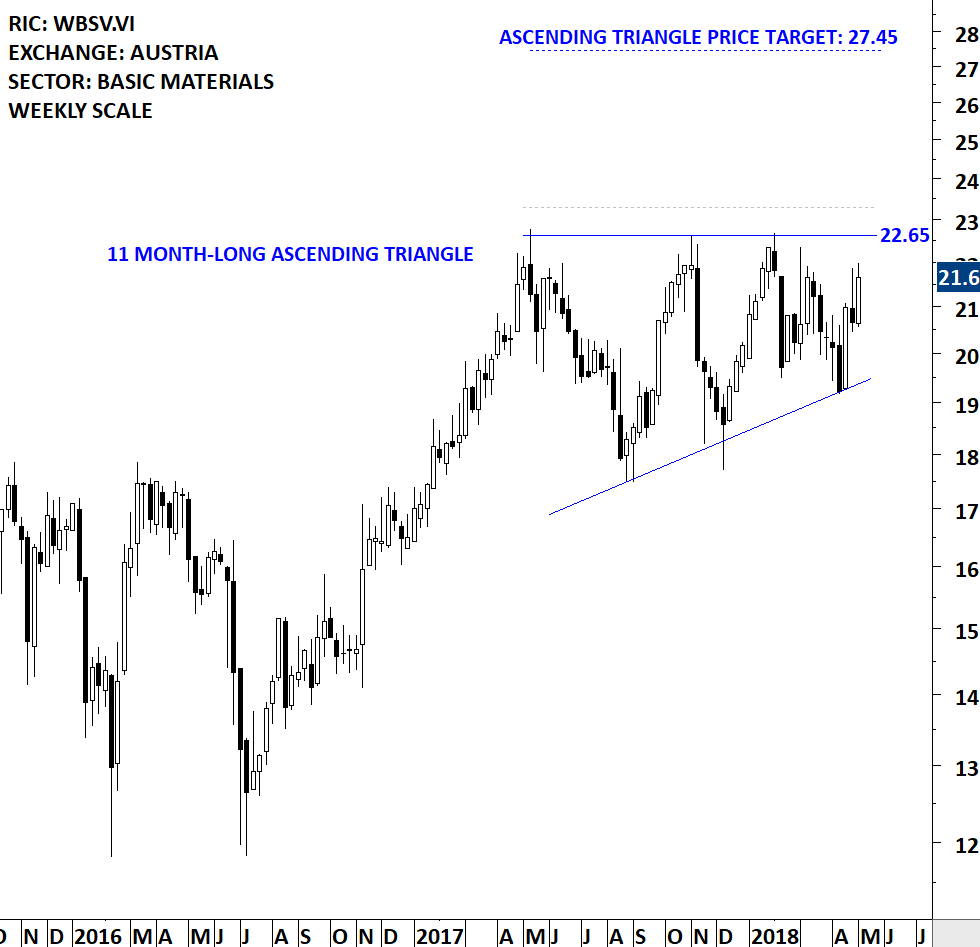
WIENERBERGER AG (WBSV.VI)
Wienerberger AG is an international building materials company. The Company is the parent company of a building materials group whose business activities are classified into six segments: Clay Building Materials Eastern Europe, Clay Building Materials Western Europe, Pipes & Pavers Eastern Europe, Pipes & Pavers Western Europe, North America and Holding & Others. The Clay Building Materials Europe division covers activities in the areas of clay blocks, facing bricks and roof tiles. The Pipes & Pavers Europe division’s product portfolio covers system solutions for building installations, fresh water supply, irrigation, wastewater and rainwater management, drainage, energy supply and data transfer, as well as special products for industrial applications and pavers. The North America division covers activities in the areas of facing bricks, plastic pipes and concrete products. The Holding & Others division covers activities in the areas of clay blocks and others. The stock is listed on the Vienna Stock Exchange. Price chart formed an 11 month-long ascending triangle with the horizontal boundary acting as strong resistance at 22.65 levels. The upper boundary was tested several times over the course of the chart pattern. A daily close above 23.30 levels will confirm the breakout from the 11 month-long ascending triangle with the possible chart pattern price target of 27.45 levels.
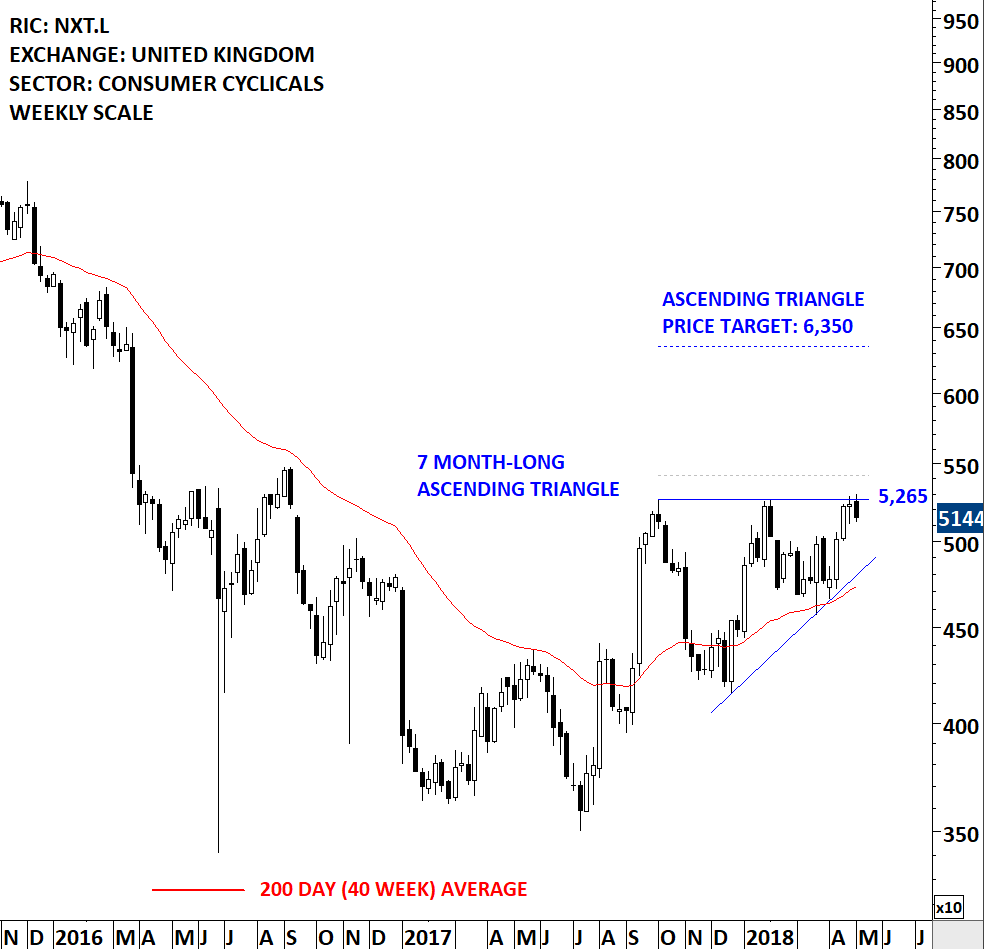
NEXT PLC (NXT.L)
NEXT plc is a United Kingdom-based retailer offering clothing, footwear, accessories and home products. The Company’s segments include NEXT Retail, a chain of over 500 stores in the United Kingdom and Eire; NEXT Directory, an online and catalogue shopping business with over four million active customers and international Websites serving approximately 70 countries; NEXT International Retail, with approximately 200 mainly franchised stores; NEXT Sourcing, which designs and sources NEXT branded products; Lipsy, which designs and sells Lipsy branded younger women’s fashion products, and Property Management, which holds properties and property leases which are sub-let to other segments and external parties. Lipsy also sells directly through its own stores and Website, to wholesale customers and to franchise partners. The Company’s franchise partners operate approximately 180 stores in over 30 countries. The stock is listed on the London Stock Exchange. Price chart formed a 7 month-long ascending triangle with the horizontal boundary acting as resistance at 5,265 levels. A daily close above 5,425 levels will confirm the breakout from the 7 month-long ascending triangle with the possible chart pattern price target of 6,350 levels.
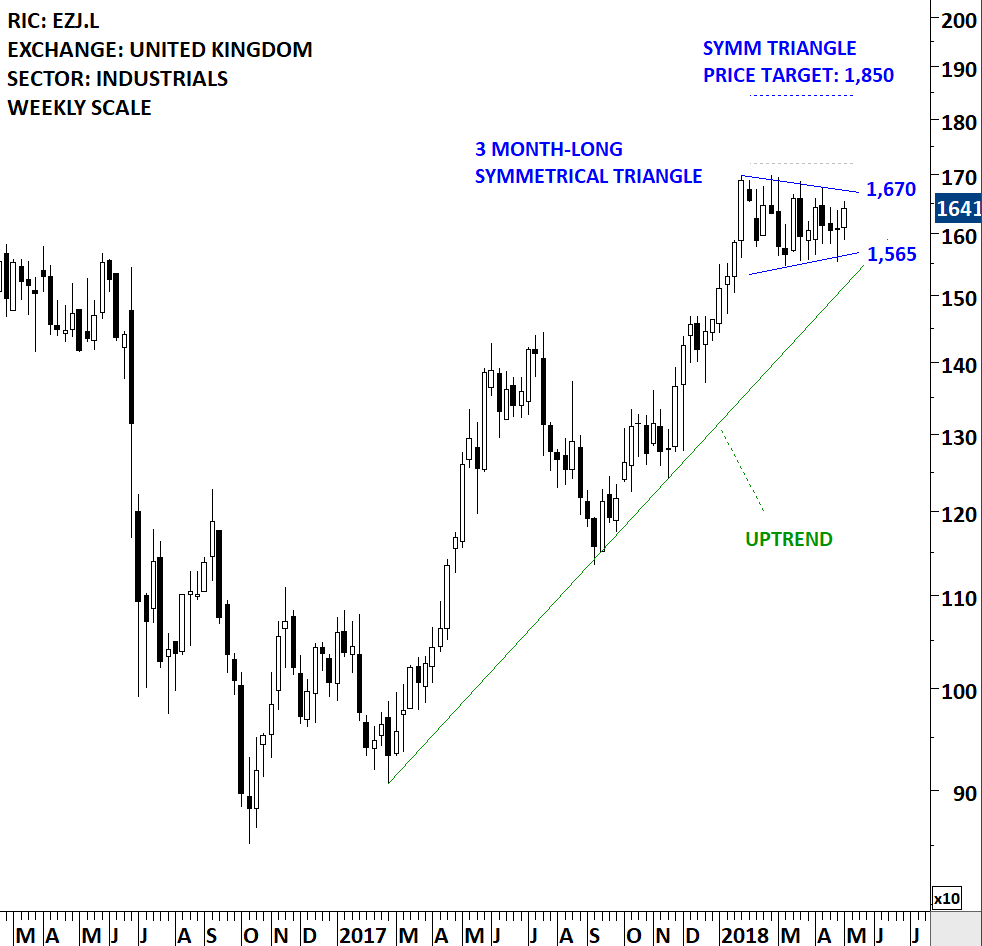
EASYJET PLC (EZJ.L)
EasyJet plc is a United Kingdom-based low-cost airline carrier. The Company operates as a low-cost European point-to-point short-haul airline. The Company operates through its route network segment. The Company operates on over 820 routes across more than 30 countries with its fleet of over 250 Airbus aircrafts. The Company’s total fleet of aircrafts is split between 156-seat Airbus A319s, 180-seat A320s and 186-seat A320s. It is also focused on operating its fleet of A320neo aircrafts. The Company’s bases include the United Kingdom, Switzerland, Italy, France (Paris, Charles de Gaulle, Lyon and Toulouse), Amsterdam, Venice, Oporto, Lisbon and Barcelona. It operates in airports, such as Gatwick, Edinburgh, Nice, Milan Malpensa, Venice Marco Polo, Naples, Basel and Geneva. The Company offers a mobile application-only proposition, targeting customers wishing to switch flights at short notice on the day of travel, and also offers pre-purchased in-flight vouchers. The stock is listed on the London Stock Exchange. Price chart formed a 3 month-long symmetrical triangle or pennant with the upper boundary acting as resistance at 1,670 levels. Symmetrical triangle can act as a bullish continuation chart pattern. Over the past two years Easy Jet has been in a steady uptrend. A daily close above 1,720 levels will confirm the breakout from the 3 month-long symmetrical triangle with the possible chart pattern price target of 1,850 levels.
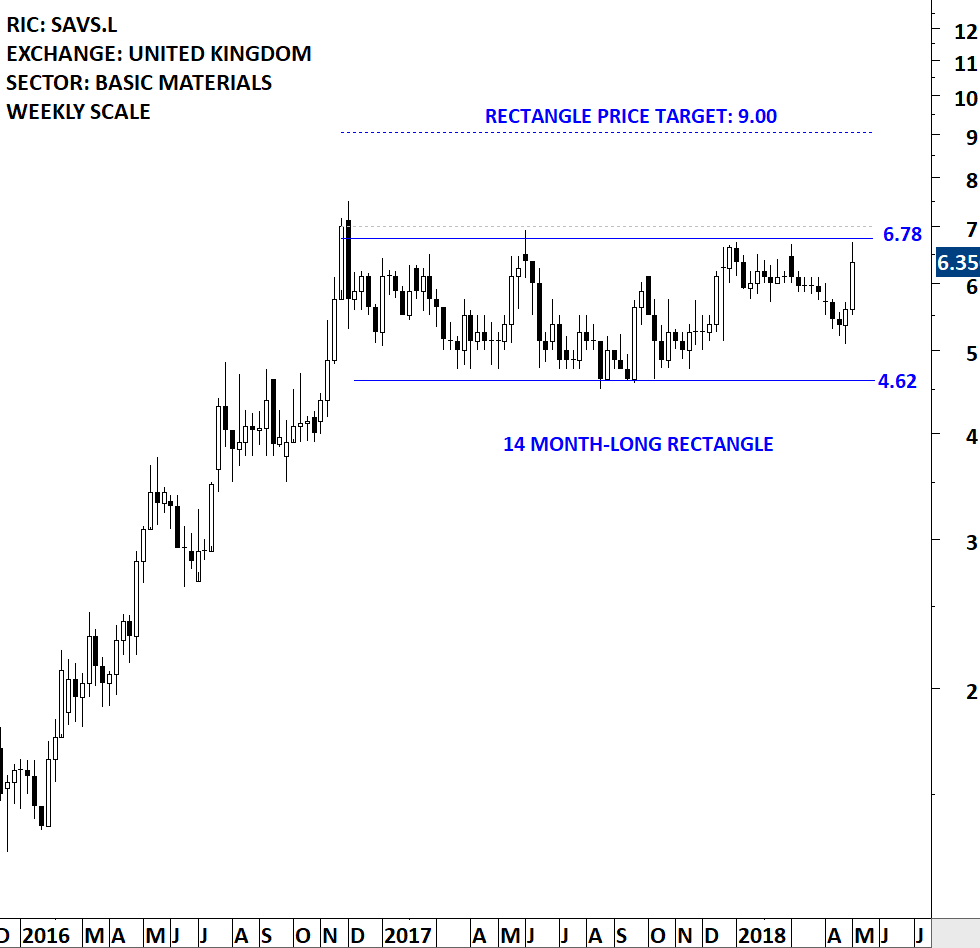
SAVANNAH RESOURCES PLC (SAVS.L)
Savannah Resources Plc is a United Kingdom-based multi -commodity and multi-geographic development company. The Company’s principal activities include the exploration for copper in Oman and enhancement of the Company’s heavy mineral sands Project in Mozambique. The Company’s segments include Oman Copper, Mozambique Mineral Sands, Headquarter administration and corporate, and Investments. The Company is developing its copper and gold portfolio in Oman towards production (Block 4, 5 and 6). The Company is advancing its Jangamo/Mutamba Heavy Mineral Sands Project in Mozambique. The Company has rights to approximately three blocks covering over 1,270 square kilometers in the Semail Ophiolite belt in the Sultanate of Oman. The three blocks are located approximately 180 kilometers northwest of Muscat, Oman. The Company’s high priority areas include the Mahab 4 and Maqail South deposits in Block 5, and the Aarja and Bayda and Lasail deposits in Block 4. The stock is listed on the London Stock Exchange. Price chart formed a 14 month-long rectangle with the upper boundary acting as strong resistance at 6.78 levels. The upper boundary was tested several times over the course of the chart pattern. A daily close above 7.00 levels will confirm the breakout from the 14 month-long rectangle with the possible chart pattern price target of 9.00 levels.
MIDDLE EAST & AFRICA
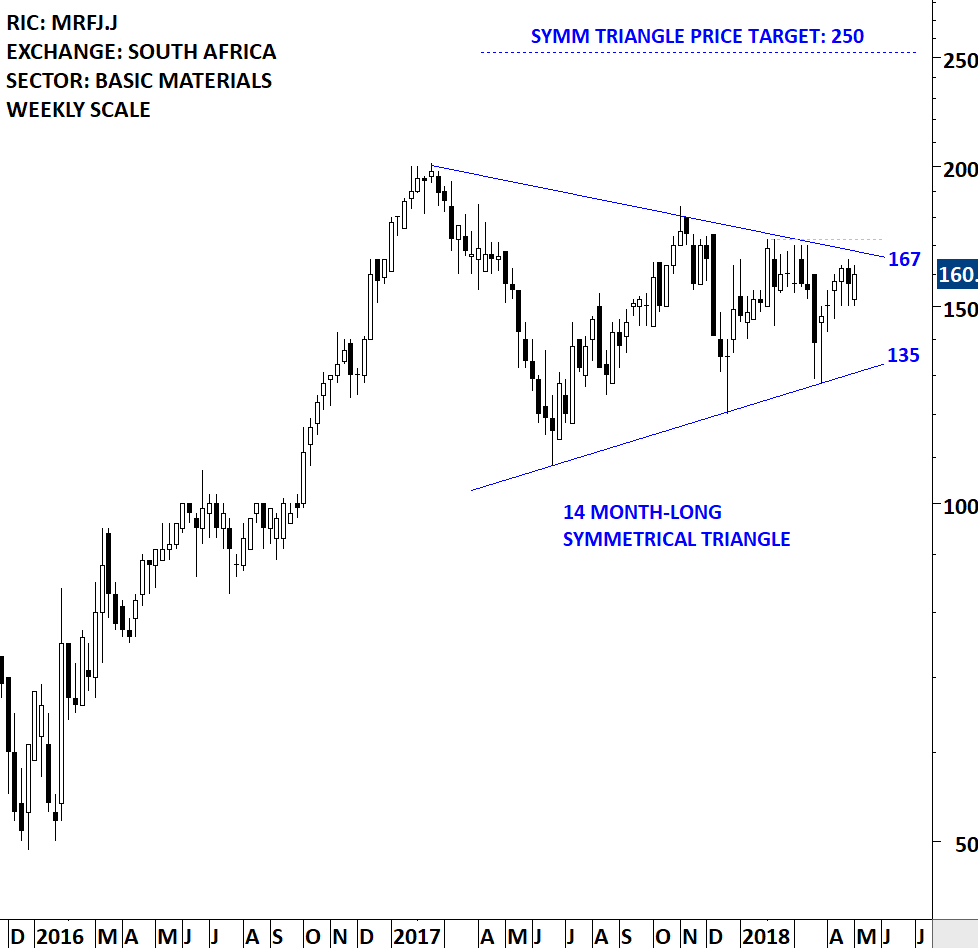
MERAFE RESOURCES LTD (MRFJ.J)
Merafe Resources Limited (Merafe), through its subsidiary, Merafe Ferrochrome and Mining Proprietary Limited (Merafe Ferrochrome) and through a pooling and sharing Venture with Glencore Operations South Africa Proprietary Limited (Glencore), participates in chrome mining and the beneficiation of chrome ore into ferrochrome. The stock is listed on the Johannesburg Stock Exchange. Price chart formed a 14 month-long symmetrical triangle with the upper boundary acting as strong resistance at 167 levels. The upper boundary was tested several times over the course of the chart pattern. A daily close above 172 levels will confirm the breakout from the 14 month-long symmetrical triangle with the possible chart pattern price target of 250 levels.
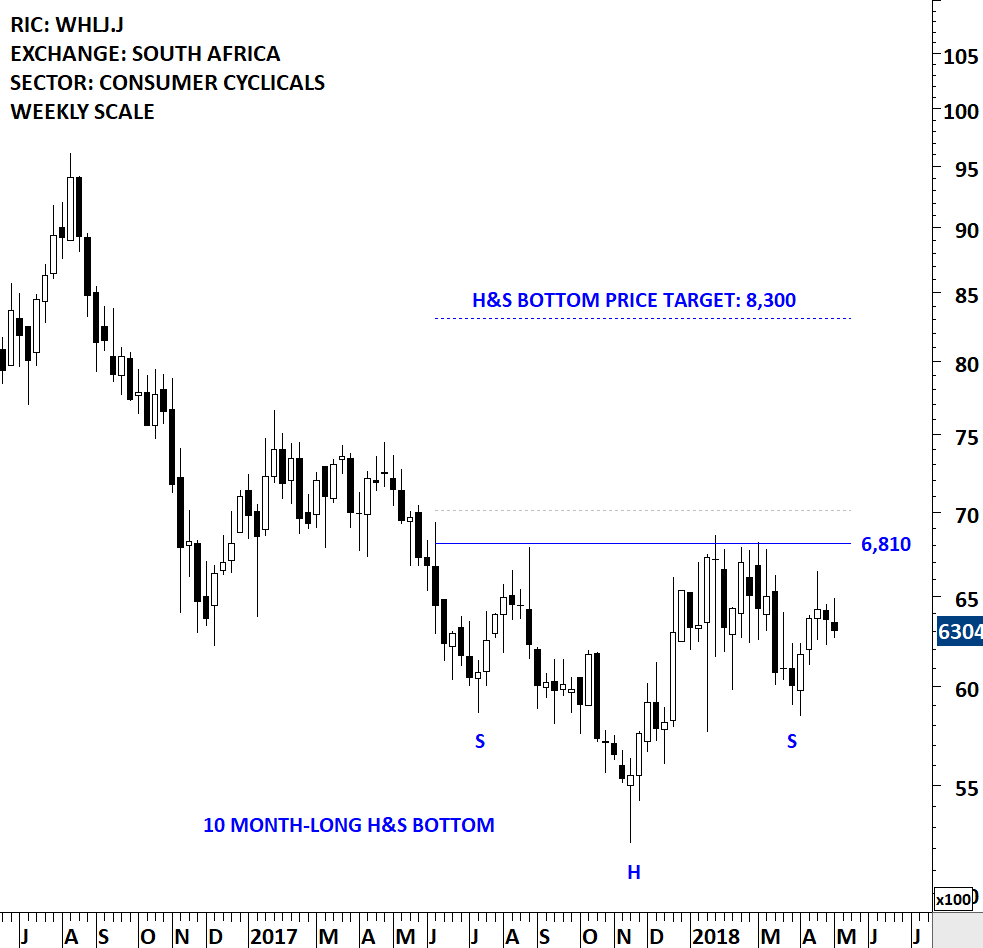
WOOLWORTHS HOLDINGS LTD (WHLJ.J)
Woolworths Holdings Limited is a retail company. The Company operates through seven segments: Woolworths Clothing and General Merchandise (C&GM), which includes clothing, home ware, beauty and other lifestyle products; Woolworths Food; Woolworths Logistics; David Jones, which is a department store clothing retailer; Country Road Group, which is a clothing retailer that includes the Witchery Group; Woolworths Financial Services (WFS), which includes financial products and services, and Treasury, which includes cash and debt management activities. The Company’s geographical segments include South Africa, Rest of Africa and Australasia. The Company operates through its subsidiaries, which include Woolworths Proprietary Limited (WSA), David Jones Proprietary Limited (DJ) and Country Road Group Proprietary Limited (CRG), and a joint venture, Woolworths Financial Services Proprietary Limited (WFS). The stock is listed on the Johannesburg Stock Exchange. Price chart formed a 10 month-long head and shoulder bottom with the horizontal boundary acting as strong resistance at 6,810 levels. The neckline was tested several times over the course of the chart pattern. A daily close above 7,015 levels will confirm the breakout from the 10 month-long head and shoulder bottom with the possible chart pattern price target of 8,300 levels.
ASIA
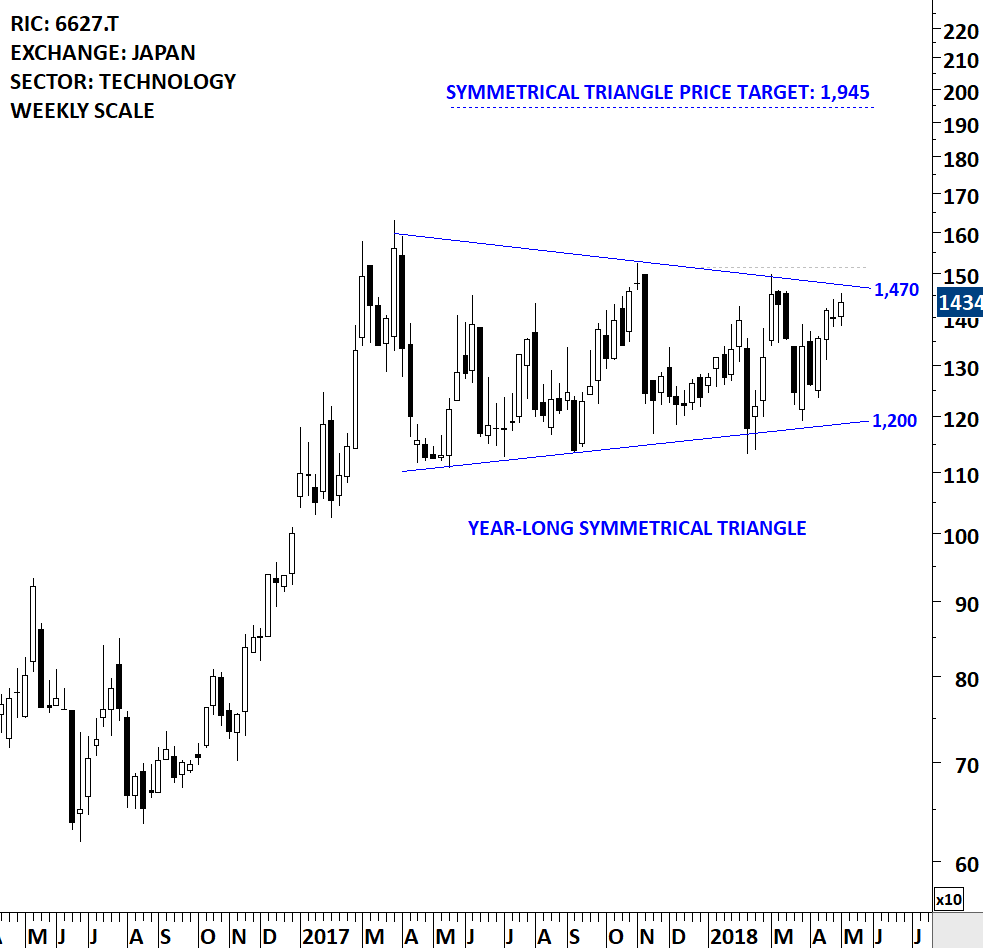
TERA PROBE INC (6627.T)
Tera Probe, Inc. is a Japan-based company mainly engaged in wafer testing, and contract wafer level package (WLP) service. The Company operates in two business segments. The Memory segment is mainly engaged in the contract wafer testing business of dynamic random access memory (DRAM) produced by semiconductor manufacturers and fabrication factories. The System Large-scale Integration (LSI) segment is principally involved in the contract wafer testing business of semiconductor products such as System on Chips (SoCs), image sensors and analogs produced by domestic and international semiconductor manufacturers and fabrication factories. This segment also operates contract final testing business. On October 1, 2013, it merged with a wholly owned subsidiary Teramikros, Inc. as the surviving company. The stock is listed on the Tokyo Stock Exchange. Price chart formed a year-long symmetrical triangle with the upper boundary acting as strong resistance at 1,470 levels. The upper boundary was tested several times over the course of the chart pattern. A daily close above 1,515 levels will confirm the breakout from the year-long symmetrical triangle with the possible chart pattern price target of 1,945 levels.
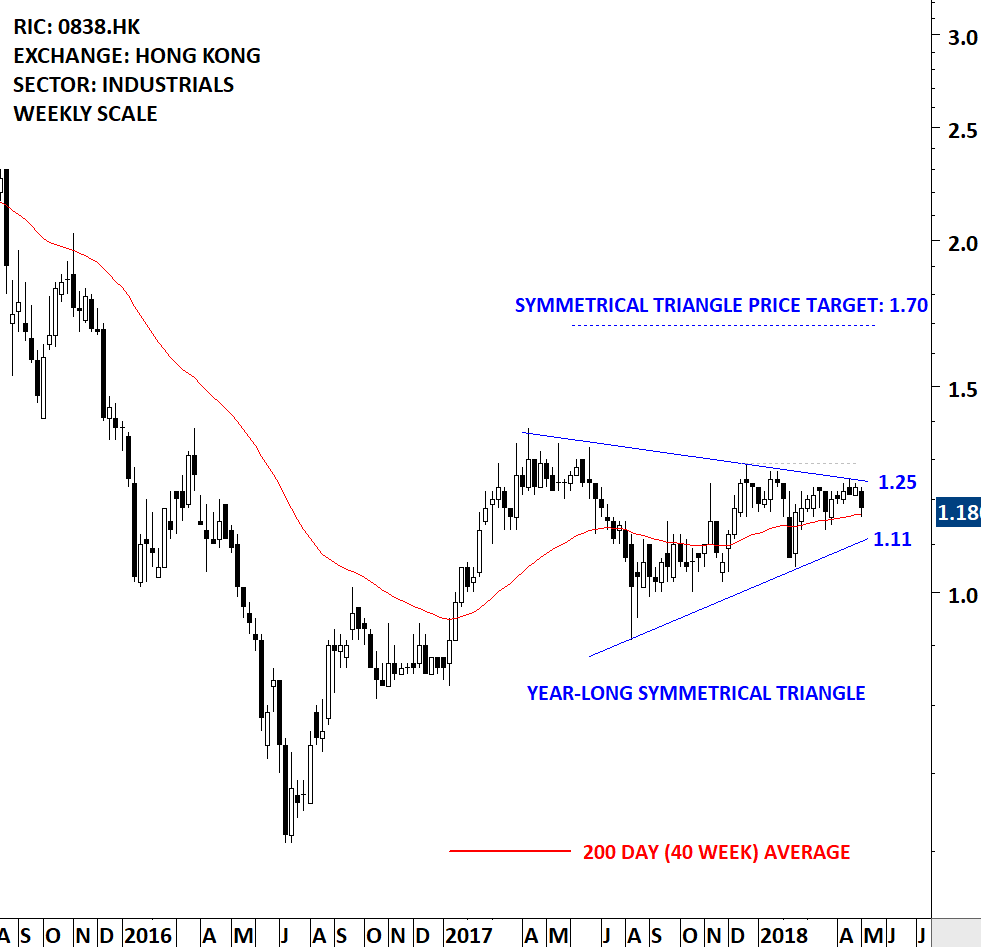
EVA PRECISION INDUSTRIAL HOLDINGS LTD (0838.HK)
EVA Precision Industrial Holdings Limited is a Hong Kong-based investment holding company principally engaged in the manufacture of stamping molds and plastic injection molds. The stock is listed on the Hong Kong Stock Exchange. Price chart formed a year-long symmetrical triangle with the upper boundary acting as strong resistance at 1.25 levels. Symmetrical triangle can act as a bullish continuation chart pattern. A daily close above 1.29 levels will confirm the breakout from the year-long symmetrical triangle with the possible chart pattern price target of 1.70 levels.
2 Year Weekly Correlation Matrix
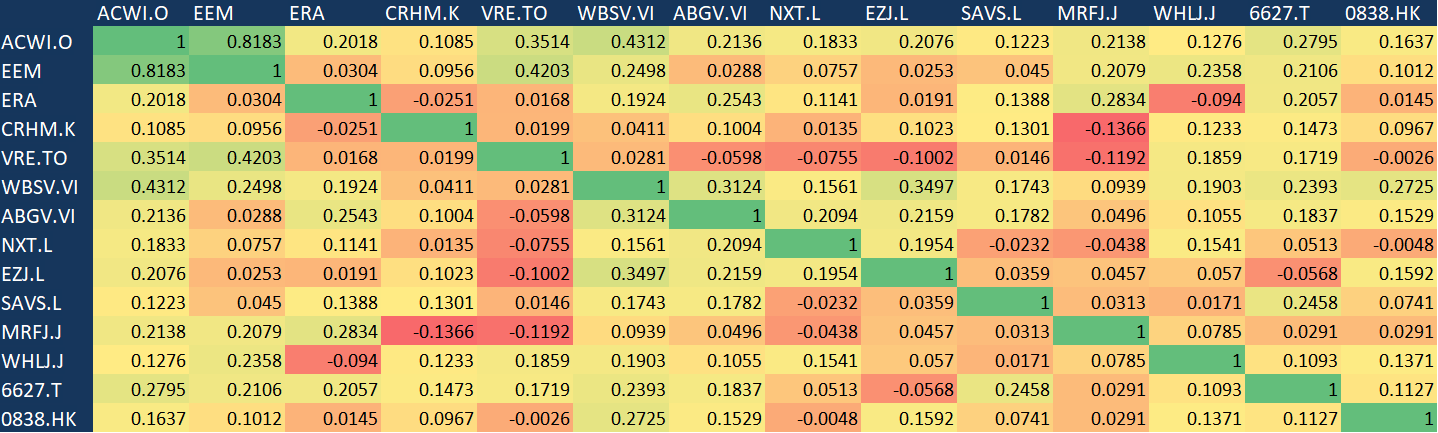
Note: If you are having difficulty viewing the correlation matrix table due to font size, you can right click on the image and open image in a new tab.
Tech Charts Membership

By becoming a Premium Member, you’ll be able to improve your knowledge of the principles of classical charting.
With this knowledge, you can merge them with your investing system. In fact, some investors use my analyses to modify their existing style to invest more efficiently and successfully.

As a Premium Member of Aksel Kibar’s Tech Charts,
You will receive:
-
Global Equities Report. Delivered weekly.
-
Classical charting principles. Learn patterns and setups.
-
Actionable information. Worldwide indices and stocks of interest.
-
Risk management advice. The important trading points of each chart.
-
Information on breakout opportunities. Identify the ones you want to take action on.
-
Video tutorials. How patterns form and why they succeed or fail.
-
Watch list alerts. As they become available so you can act quickly.
-
Breakout alerts. Usually once a week.
-
Access to everything (now and as it becomes available)o Reports
o Videos and video series -
Multi-part webinar course. You learn the 8 most common charting principles.
-
Webinars. Actionable and timely advice on breaking out chart patterns.
For your convenience your membership auto renews each year.


