Reminder:
Both Members and Non-Members are invited to join us for the public webinar on Thursday, May 17, 11am mountain: Tech Charts Year in Review. I will compare the before and after of charts shared with Members over the last year and go through some of the developing chart setups on equities and Global indices. I will also discuss some statistics on chart pattern reliability. As always, we’ll end the webinar with a live Q&A.
If you have any questions you’d like to submit, please send them to us via the “Contact” link under Support on our website.
CLICK HERE to register
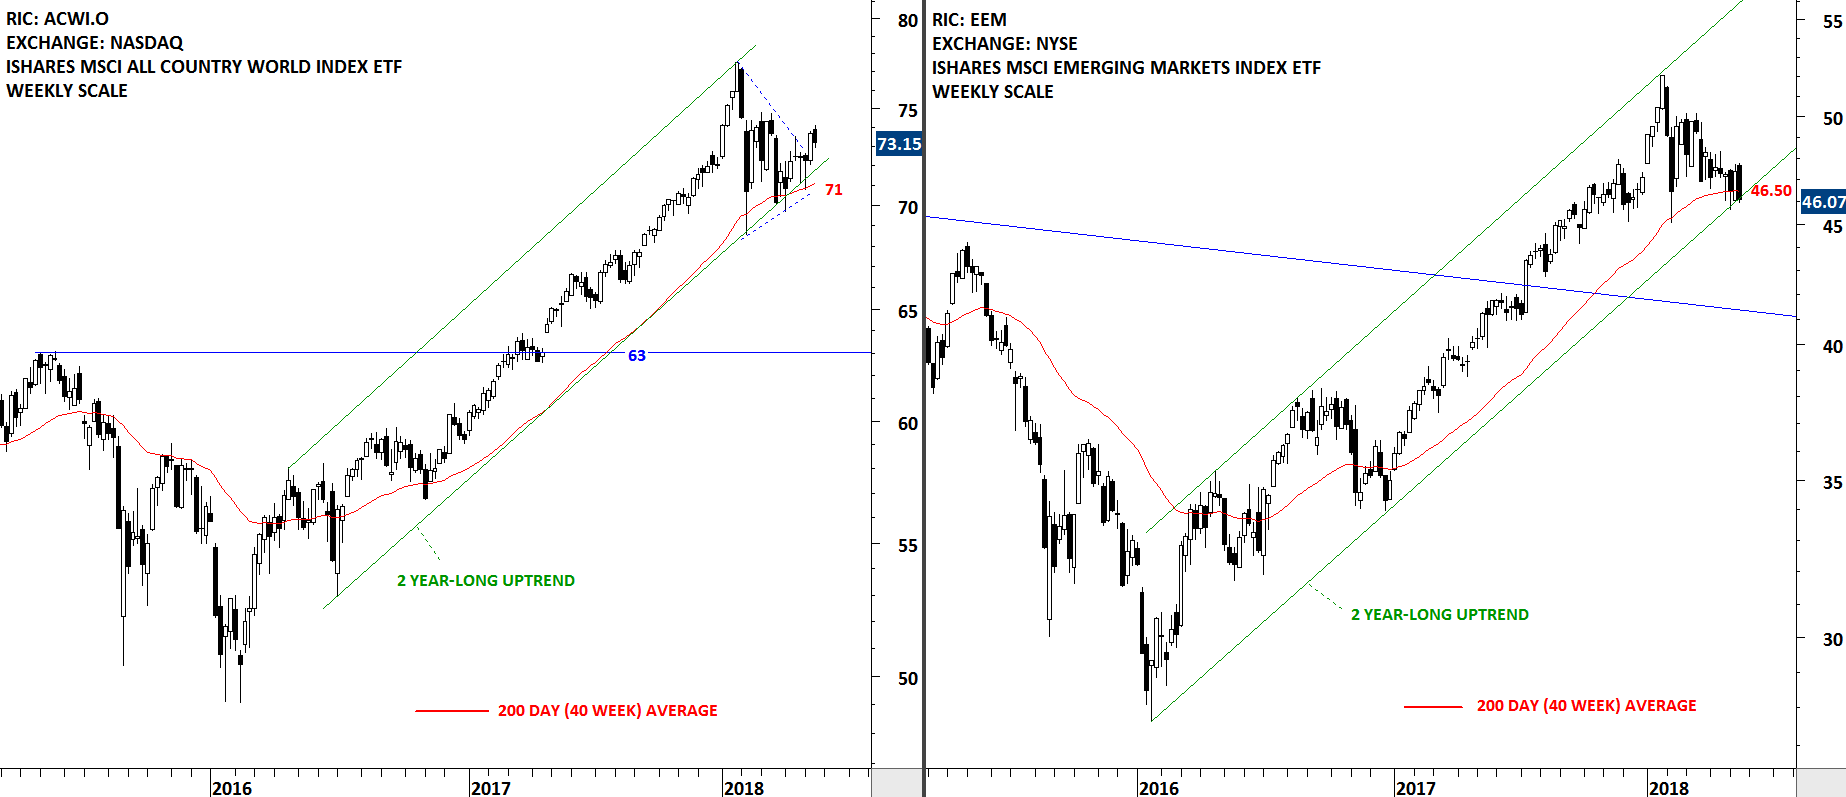
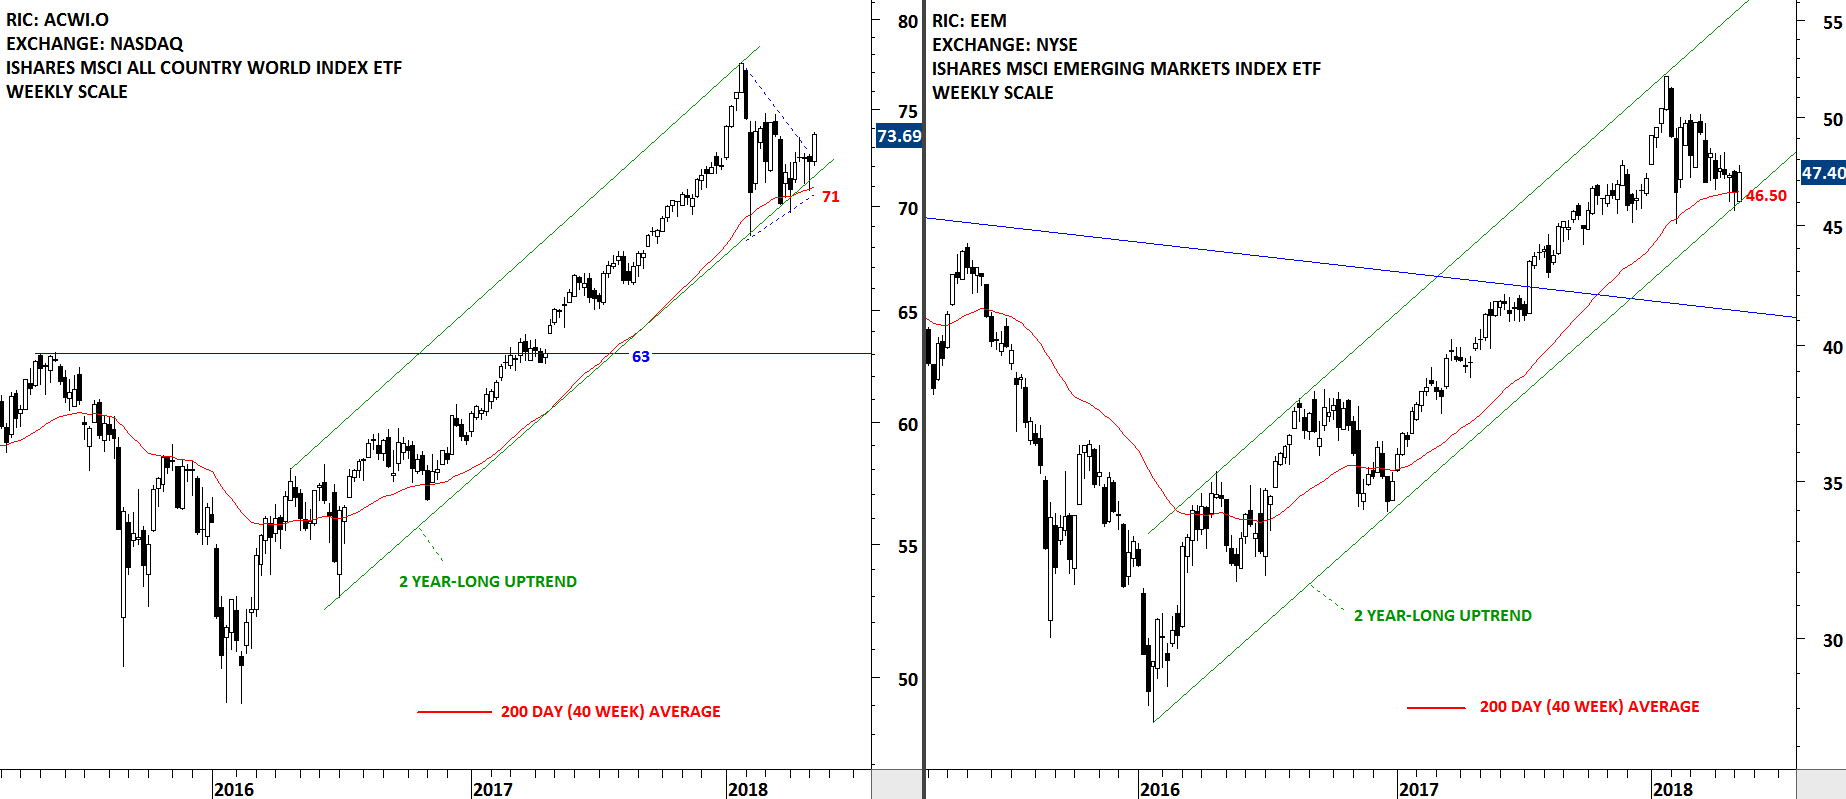
Every week Tech Charts Global Equity Markets report features some of the well-defined, mature classical chart patterns under a lengthy watchlist and the chart pattern breakout signals that took place during that week. Global Equity Markets report covers single stocks from developed and emerging markets, ETF’s and global equity indices. The report starts with a review section that highlights the important chart developments on global equity benchmarks. This blog post features a recent breakout opportunity in European equity ETF listed on the NYSE.
Read more