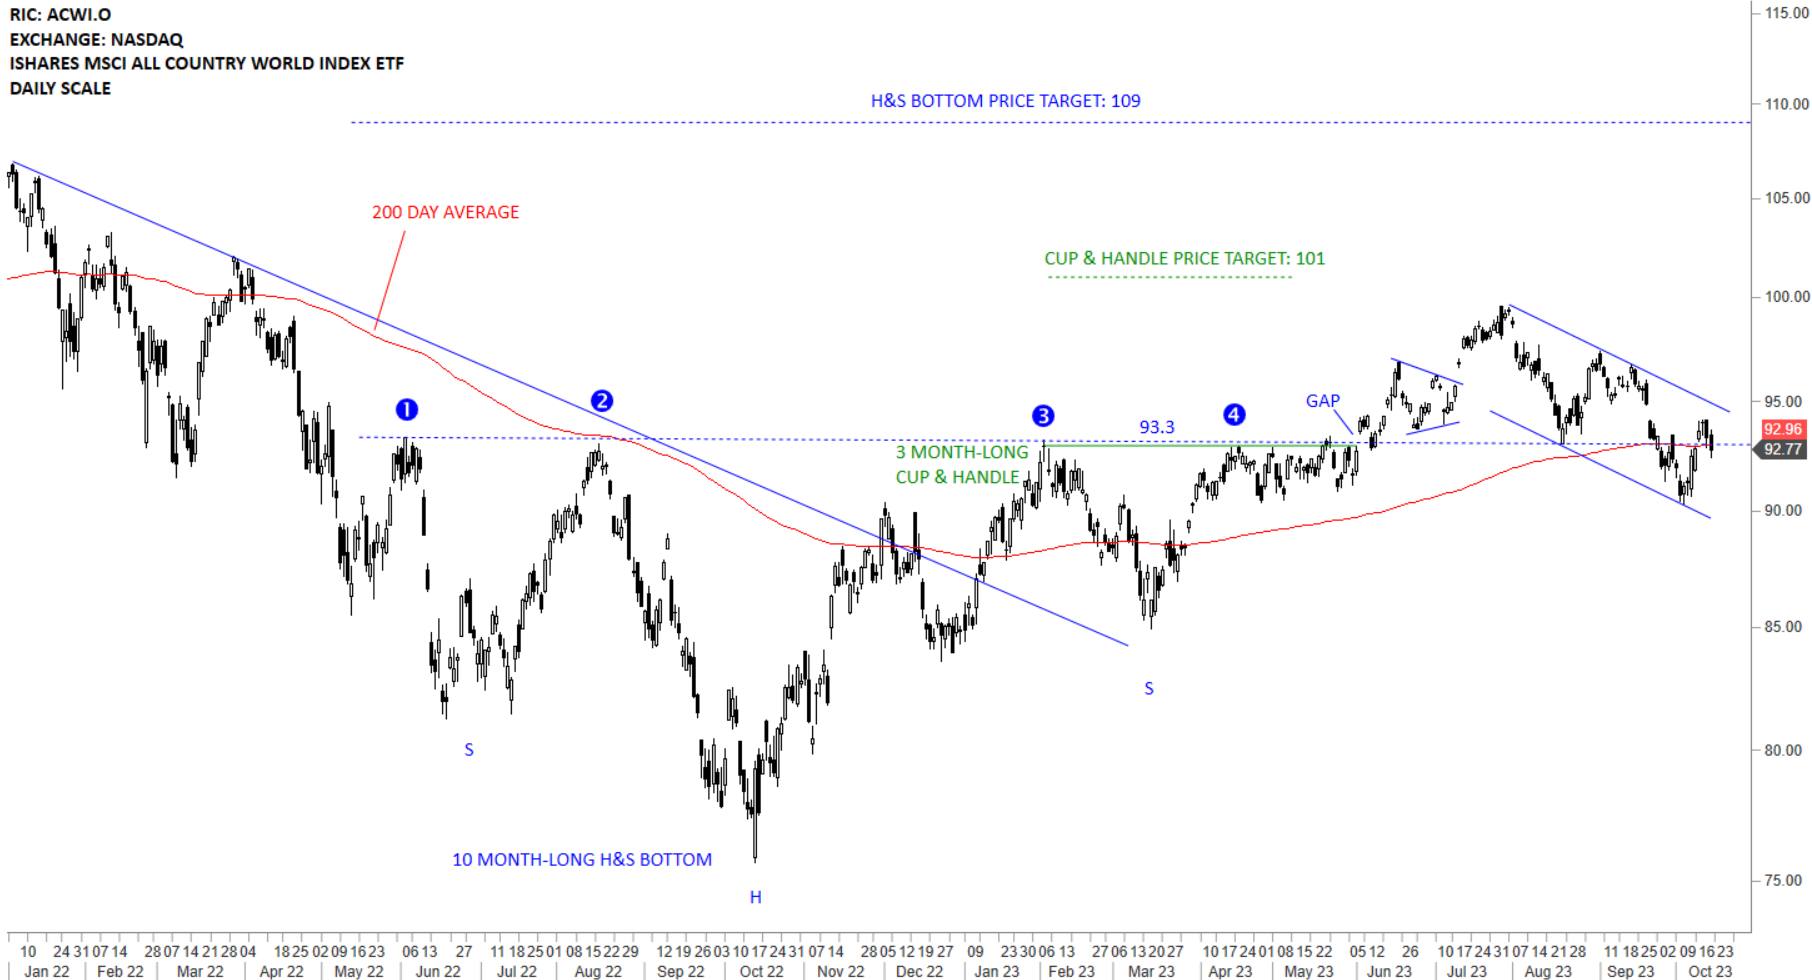
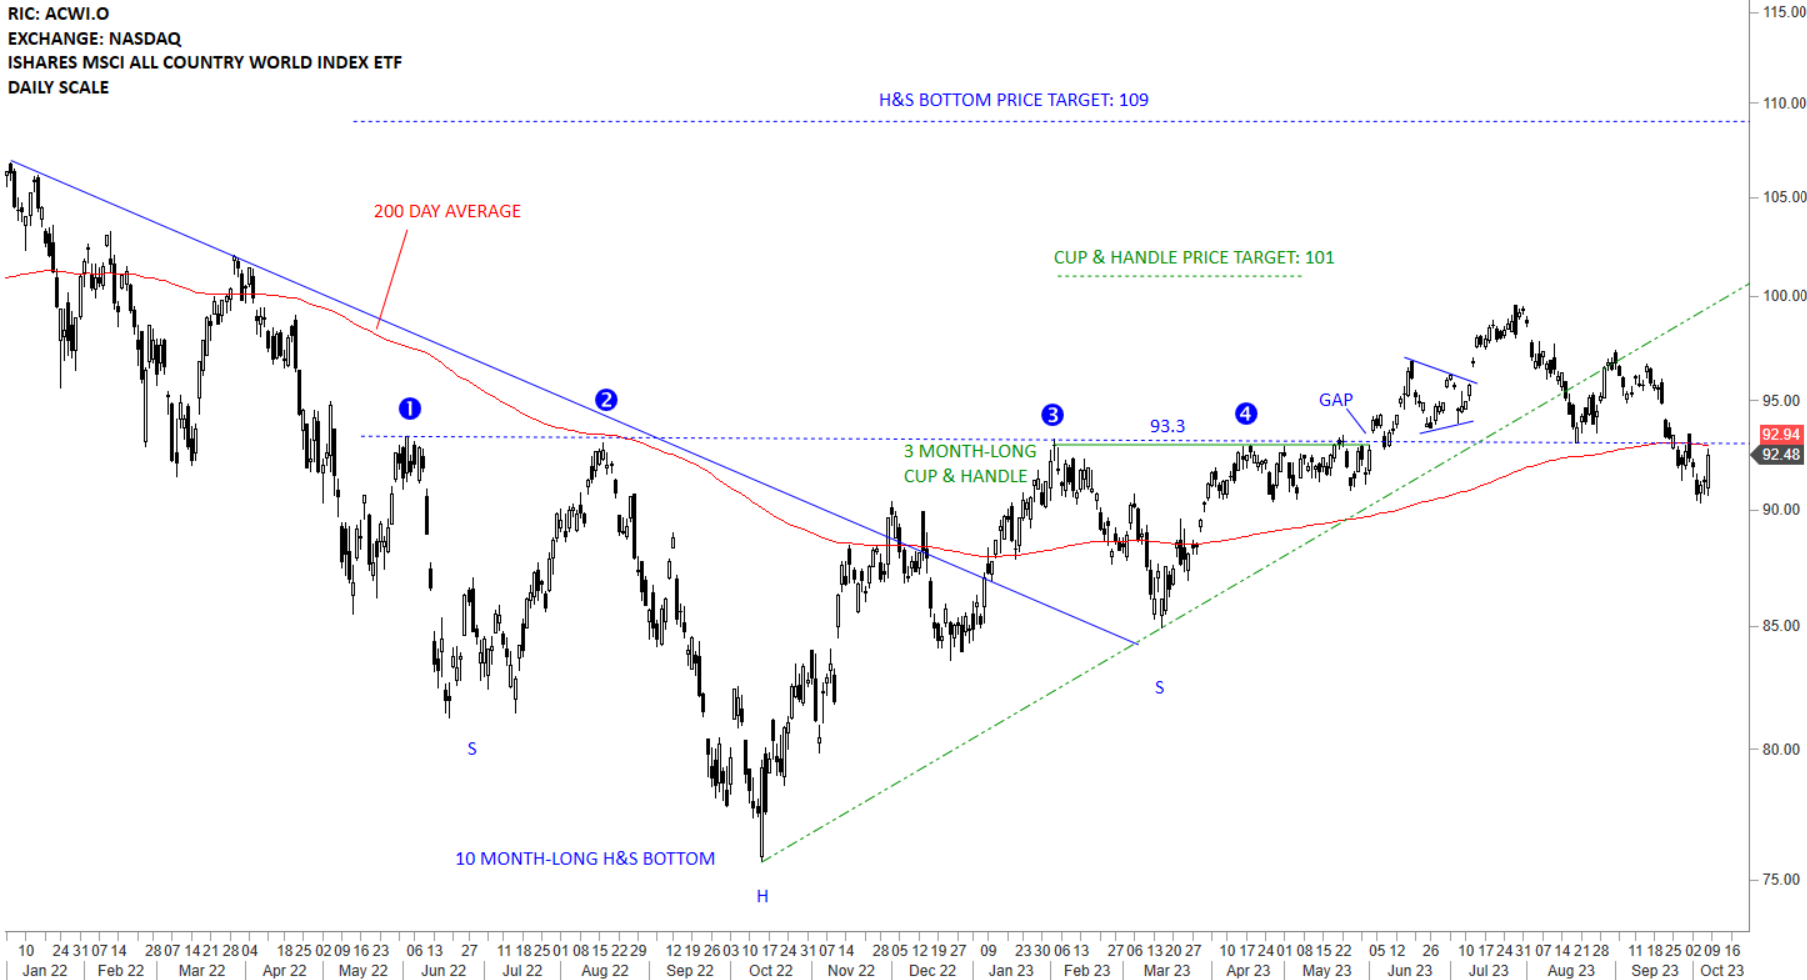
INTERIM UPDATE – October 19, 2023

During the daily charts review I came across those text-book opportunities which I think are time sensitive and fresh opportunities as breakdown candidates. Below are the latest additions to Tech Charts watchlist. These charts will also be included in the weekly update.

Read more

INTERIM UPDATE – October 17, 2023

During the weekend research and daily charts review I came across those text-book opportunities which I think are time sensitive. Below are the latest additions to Tech Charts watchlist. These charts will also be included in the weekly update.

Read more

CRYPTOCURRENCIES – October 15, 2023

Bullish outlook on BTCUSD remains intact. Important support level at 25K level. A re-test of 28K levels can increase the likelihood of a bottom reversal, possibly a double bottom. ETHUSD chart is possibly morphing with a possible short-term rectangle on daily scale price chart.
Read more

GLOBAL EQUITY MARKETS – October 14, 2023

REVIEW


The benchmark for the Global equity markets performance, the iShares MSCI All Country World Index ETF (ACWI.O) rebounded towards the resistance at 93 levels. Previous support at 93 levels become the new resistance. Failure to recover above 93 levels can result in further weakness below the long-term average. A sharp recovery above 93 levels can result in a bear trap and resume the uptrend on the Global Equity benchmark. For the uptrend to resume in Global Equities, it will be important for the ETF to stabilize above the long-term average.

Read more

INTERIM UPDATE – October 12, 2023

I start my research on Mondays and finalize by end of day Thursday. Friday is dedicated to putting all ideas to the report format. During the week I come across good setups and those are featured in the weekly report. However, there are those that pop during the week and is worth bringing to your attention before the week finalizes. Below are the latest additions to Tech Charts watchlist. These charts will also be included in the weekly update.

Read more

ZSCALER INC (ZS.OQ)

Every week Tech Charts Global Equity Markets report features some of the well-defined, mature classical chart patterns under a lengthy watchlist and the chart pattern breakout signals that took place during that week. Global Equity Markets report covers single stocks from developed, emerging and frontier markets, ETF’s, select commodities, cryptocurrencies and global equity indices. Below chart, Zscaler, Inc. (ZS.OQ) is from the watchlist section of the weekly report. It is featuring possible rectangle continuation.

Read more

GLOBAL EQUITY MARKETS – October 7, 2023

REVIEW


The benchmark for the Global equity markets performance, the iShares MSCI All Country World Index ETF (ACWI.O) breached the support formed by the 200-day average and the horizontal support at 93 levels. Friday’s sharp rebound closed around the 200-day average and the previous support which is now the resistance at 93 levels. Failure to recover above 93 levels can result in further weakness below the long-term average. A sharp recovery above 93 levels can result in a bear trap and resume the uptrend on the Global Equity benchmark.

Read more

CRYPTOCURRENCIES – October 1, 2023

Bullish outlook on BTCUSD remains intact. Important support level at 25K level. A re-test of 28K levels can increase the likelihood of a bottom reversal, possibly a double bottom. ETHUSD chart is possibly morphing with not a clear chart pattern development at this stage.
Read more

GLOBAL EQUITY MARKETS – September 30, 2023

REVIEW


The benchmark for the Global equity markets performance, the iShares MSCI All Country World Index ETF (ACWI.O) is testing its 200-day average and the horizonal support at 93 levels. It could still be early to call this week’s price action as a breakdown but clearly price action is showing weakness. Unless we see a quick recovery above 93 levels in the following week, the ETF can establish a downtrend below the 200-day average. Before I call this a change of trend from up to down, I would like to see few more daily closes below the long-term average. A sharp recovery and stability above the 200-day average can still be considered as part of a reversion to the mean.

Read more

Is Classical Charting Still Valid? – September 2023 Tech Charts & Factor Webinar

Is Classical Charting Still Valid? – September 2023 Tech Charts & Factor Webinar

Join Peter Brandt and Aksel Kibar as they answer this question. 

Webinar Outline

  • Chart pattern reliability statistics (what is performing better)
  • Looking at today’s markets from Richard W. Schabacker’s perspective
  • Markets of interests, what we are currently focusing on
  • More on classical charting principles
  • Q&A

Live Questions from Members

  1. Is this strategy scalable? Are there any scaled funds (>$1bn AUM) that use Classic Charting exclusively? 55:17
  2. Can this strategy be fully or partially automated via codifying the clearly defined classical charting defined principles? 58:08
  3. After I started to look at the Stochastic Oscillator, I realized that most breakout from patterns occurs when the indicator is overbought/sold on a higher timeframe. Doesn’t this affect somehow the reliability of the breakout, with a higher probability of a false breakout when this situation presents itself? 59:34
  4. What does Profit Factor mean? 1:00:46
  5. What are your thoughts on trading classical patterns on intraday charts 1h, 4h or even on 15-min? 1:02:49
  6. Why do we focus so much on win rate (batting average). Don’t we care more about “slugging percentage”? 1:05:04
  7. Please explain all the Breakout Types again 1:06:13
  8. I have a question for Peter. From your Factor Member alerts, I note that you rarely, if ever, trade the USDJPY (while Aksel’s long-term chart shows a clear break out). I am curious to know if there is any reason or past experience or learning here? 1:07:47
  9. In the past statistics, is there any overlap of patterns – head and shoulders continuation and then ascending triangle overlapping at the breakout point? Are they both included in the stats, or do you maintain the longer duration pattern? 1:10:06
  10. Have you experienced a drawdown like this before? Is this typical in what you have seen in your past? And will you ever adjust your strategy during long stretches of losing trades? Are you sizing down during long losing streaks or shortening your PT or tightening/loosening risk? 1:11:13
  11. Do you ever consider sitting entirely in cash when the breadth of the market is the way it is, and not seeing your breakouts work? 1:13:21
  12. How many times will you let yourself reenter a position that stops you out and do you change the ATR breakout level? 1:13:32
  13. Instead of trading a Forex currency pair such as AUD/CAD is it possible to create a synthetic forex position by trading the futures contracts for AUD and CAD, being long AUD and short CAD if you were trying to long /CAD, and short AUD and long CAD if you were trying to be short AUD/CAD. 1:15:04
  14. To clarify, is Peter bearish on the Russell 2000? 1:16:47
  15. Is it a 200-period moving average on the DXY chart? 1:18:01

Recorded live 09.20.2023

Read more