GLOBAL EQUITY MARKETS – November 18, 2023
REVIEW
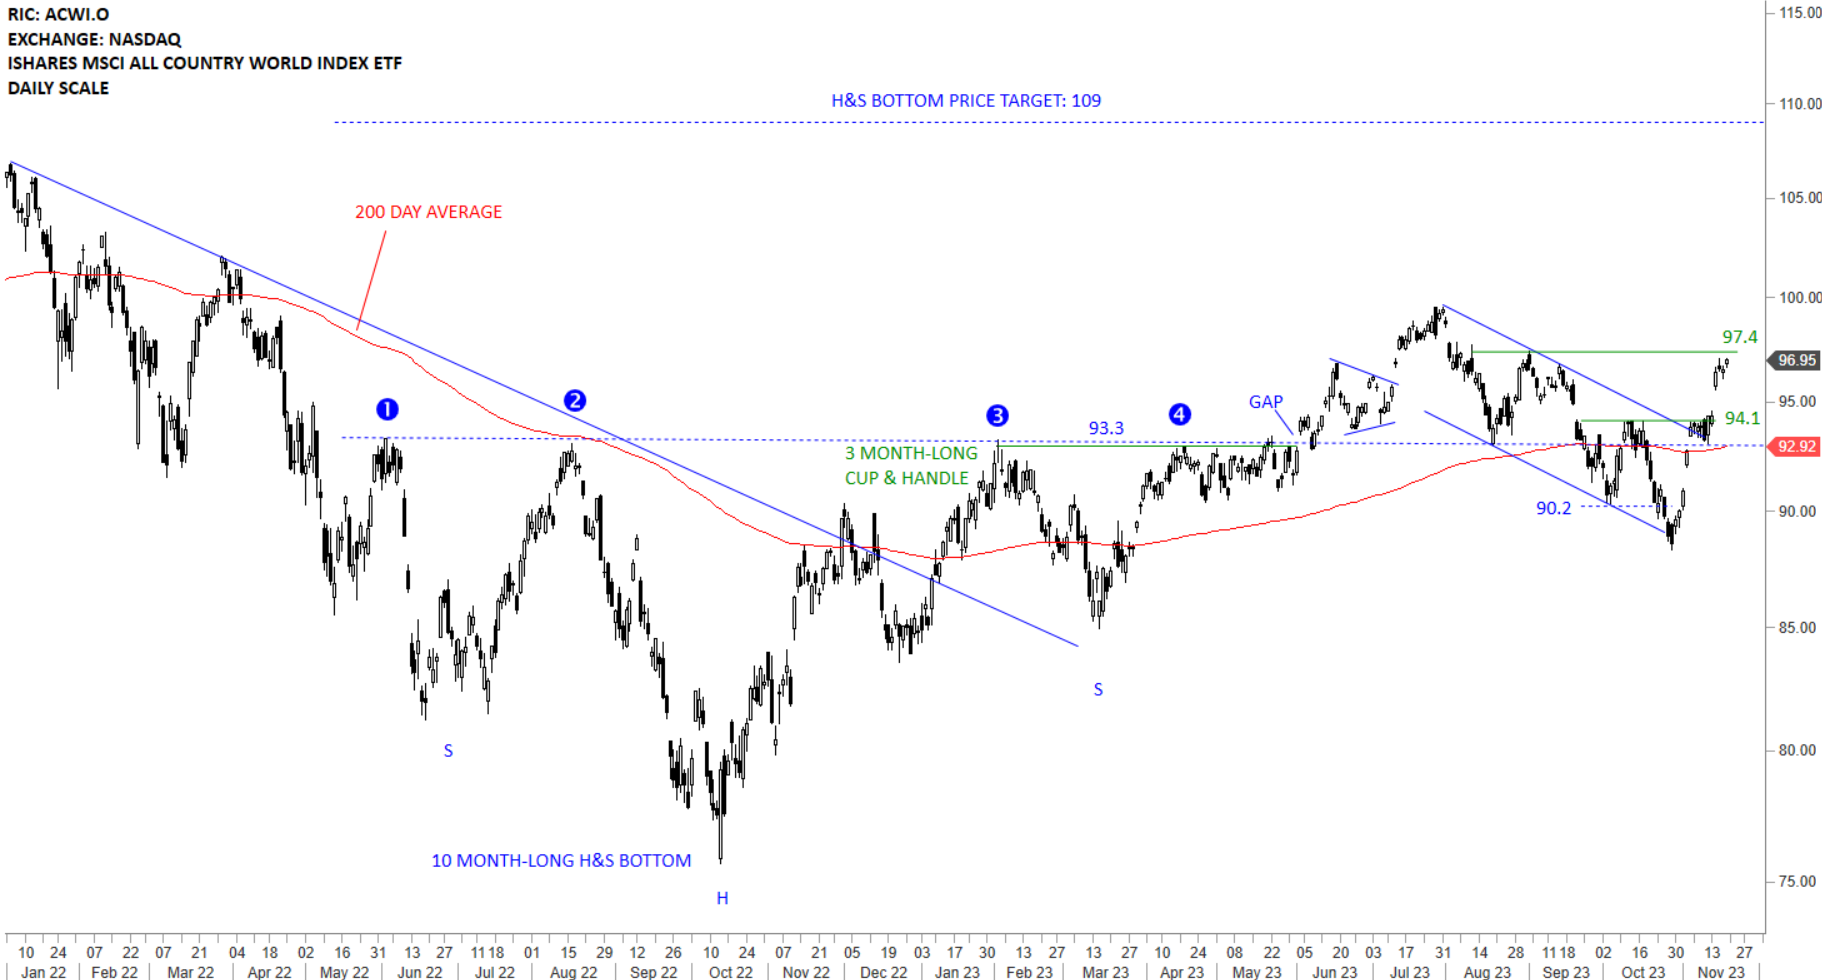
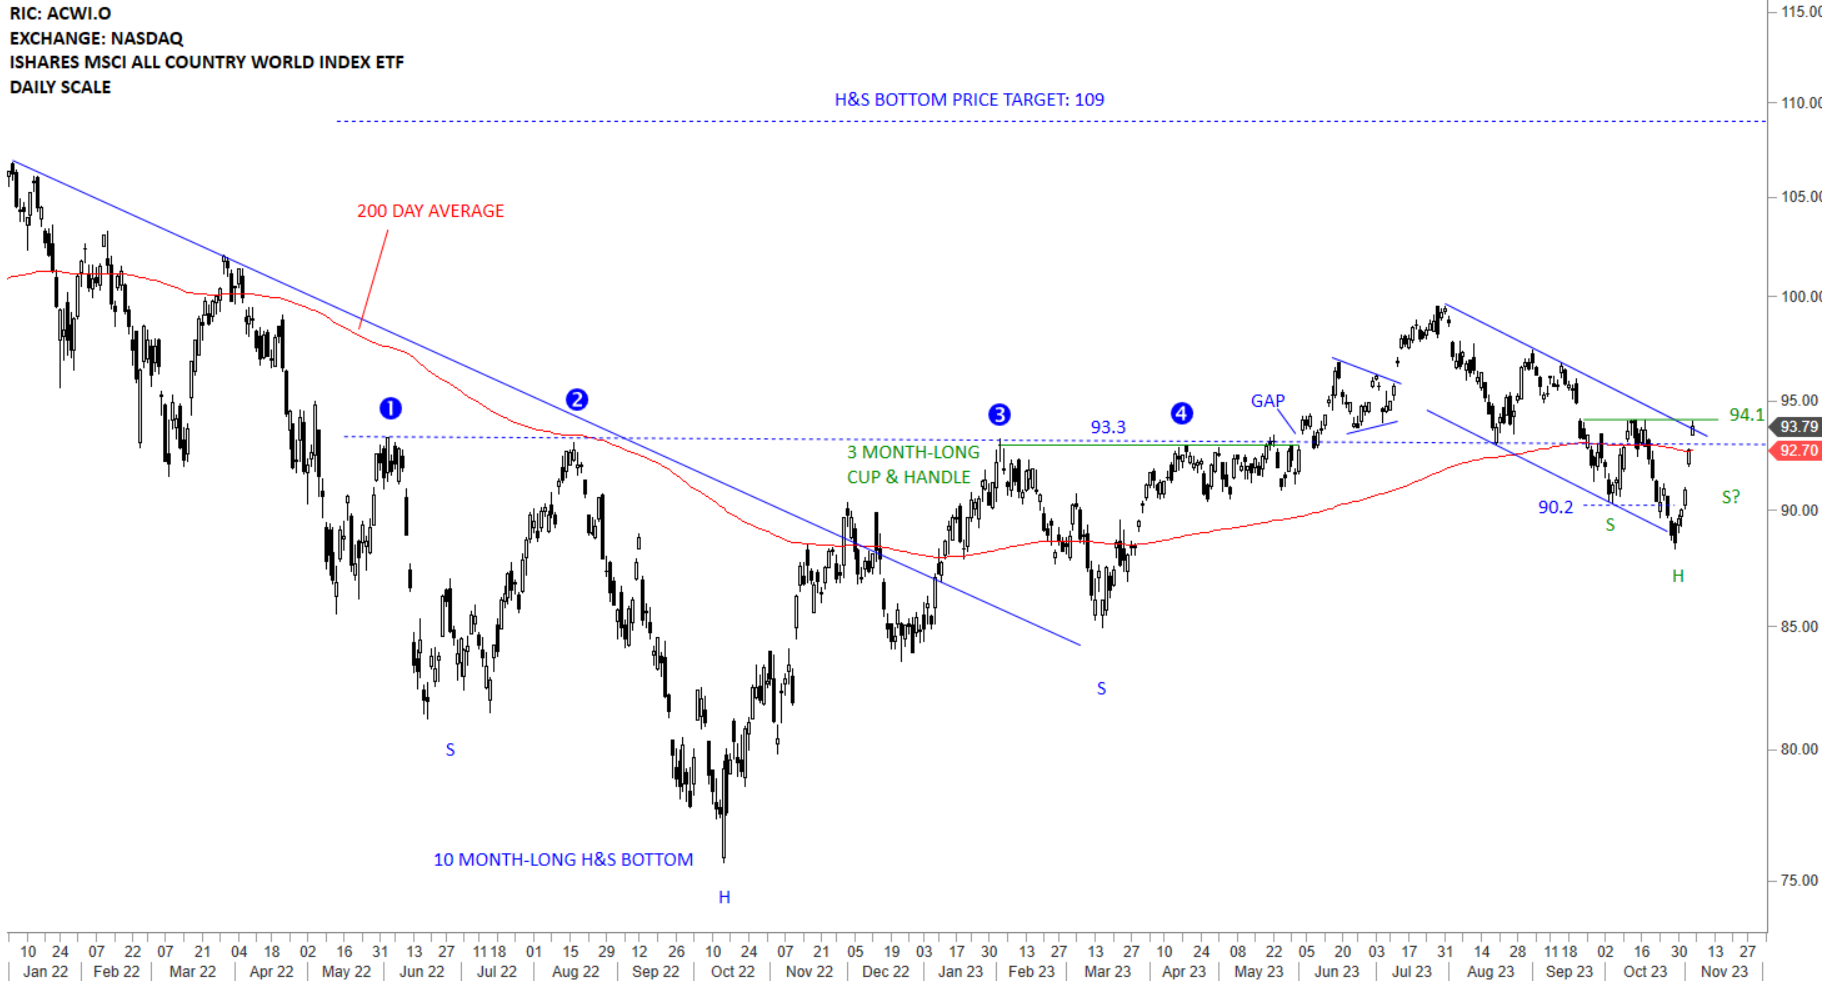
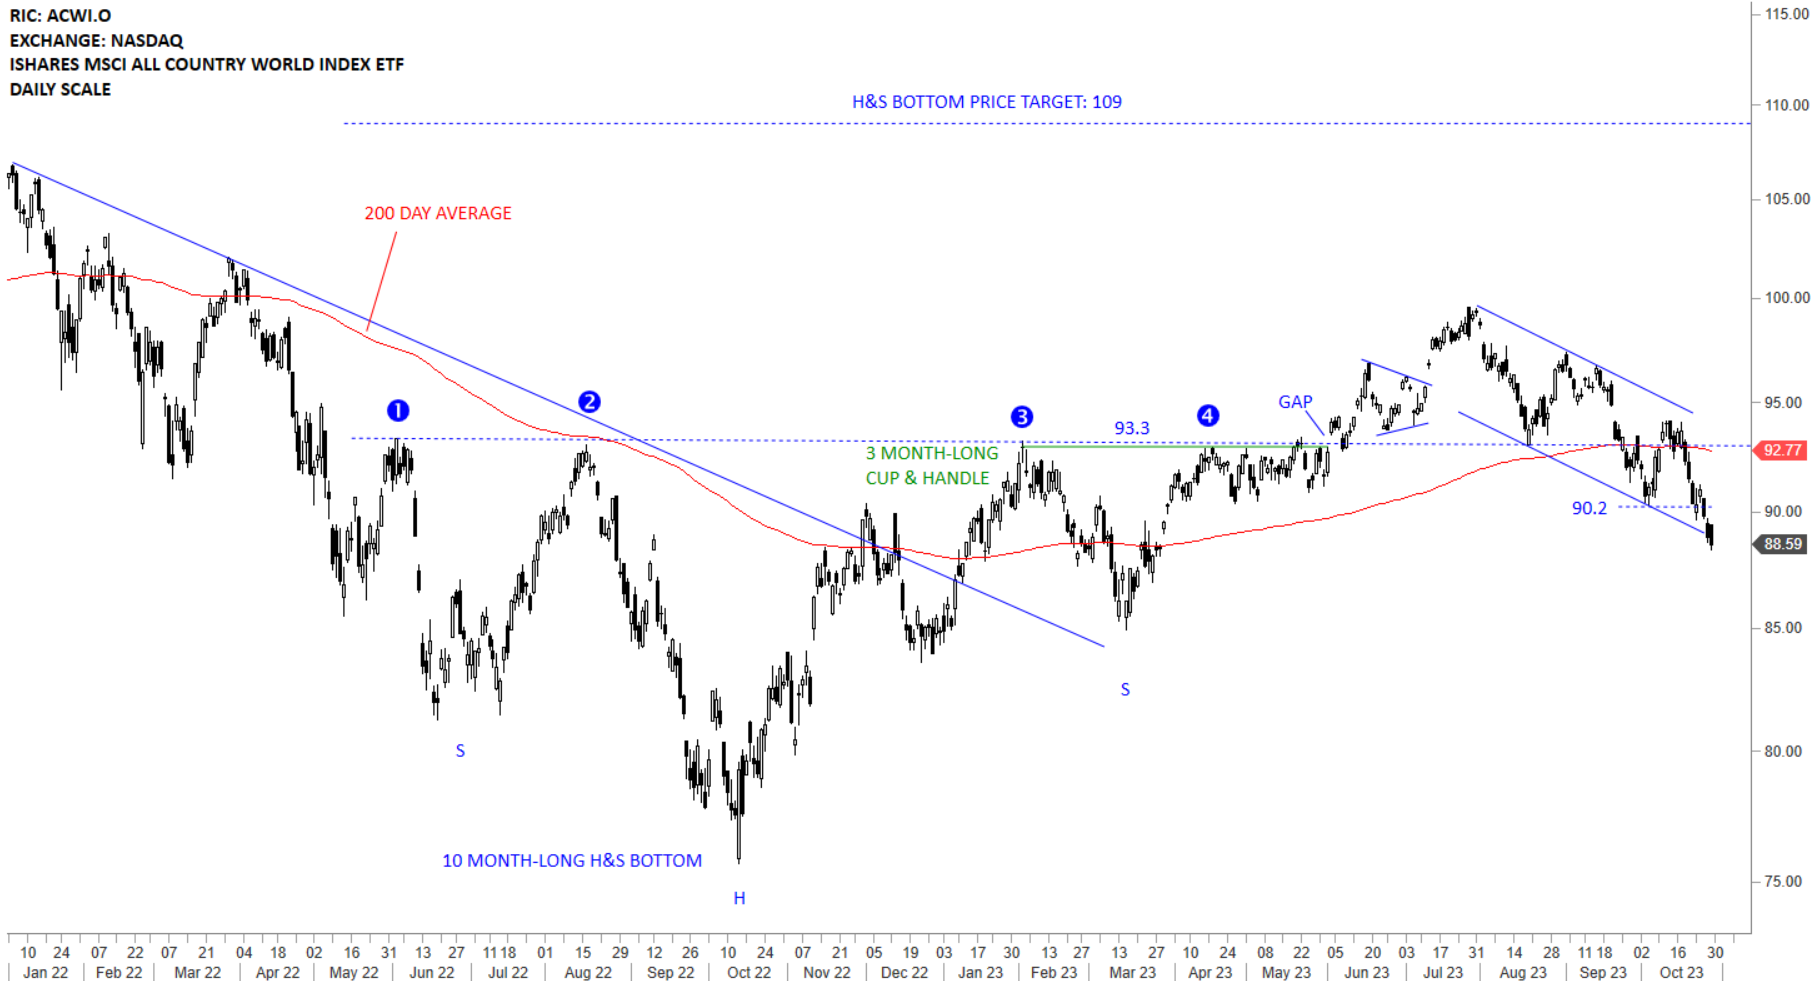
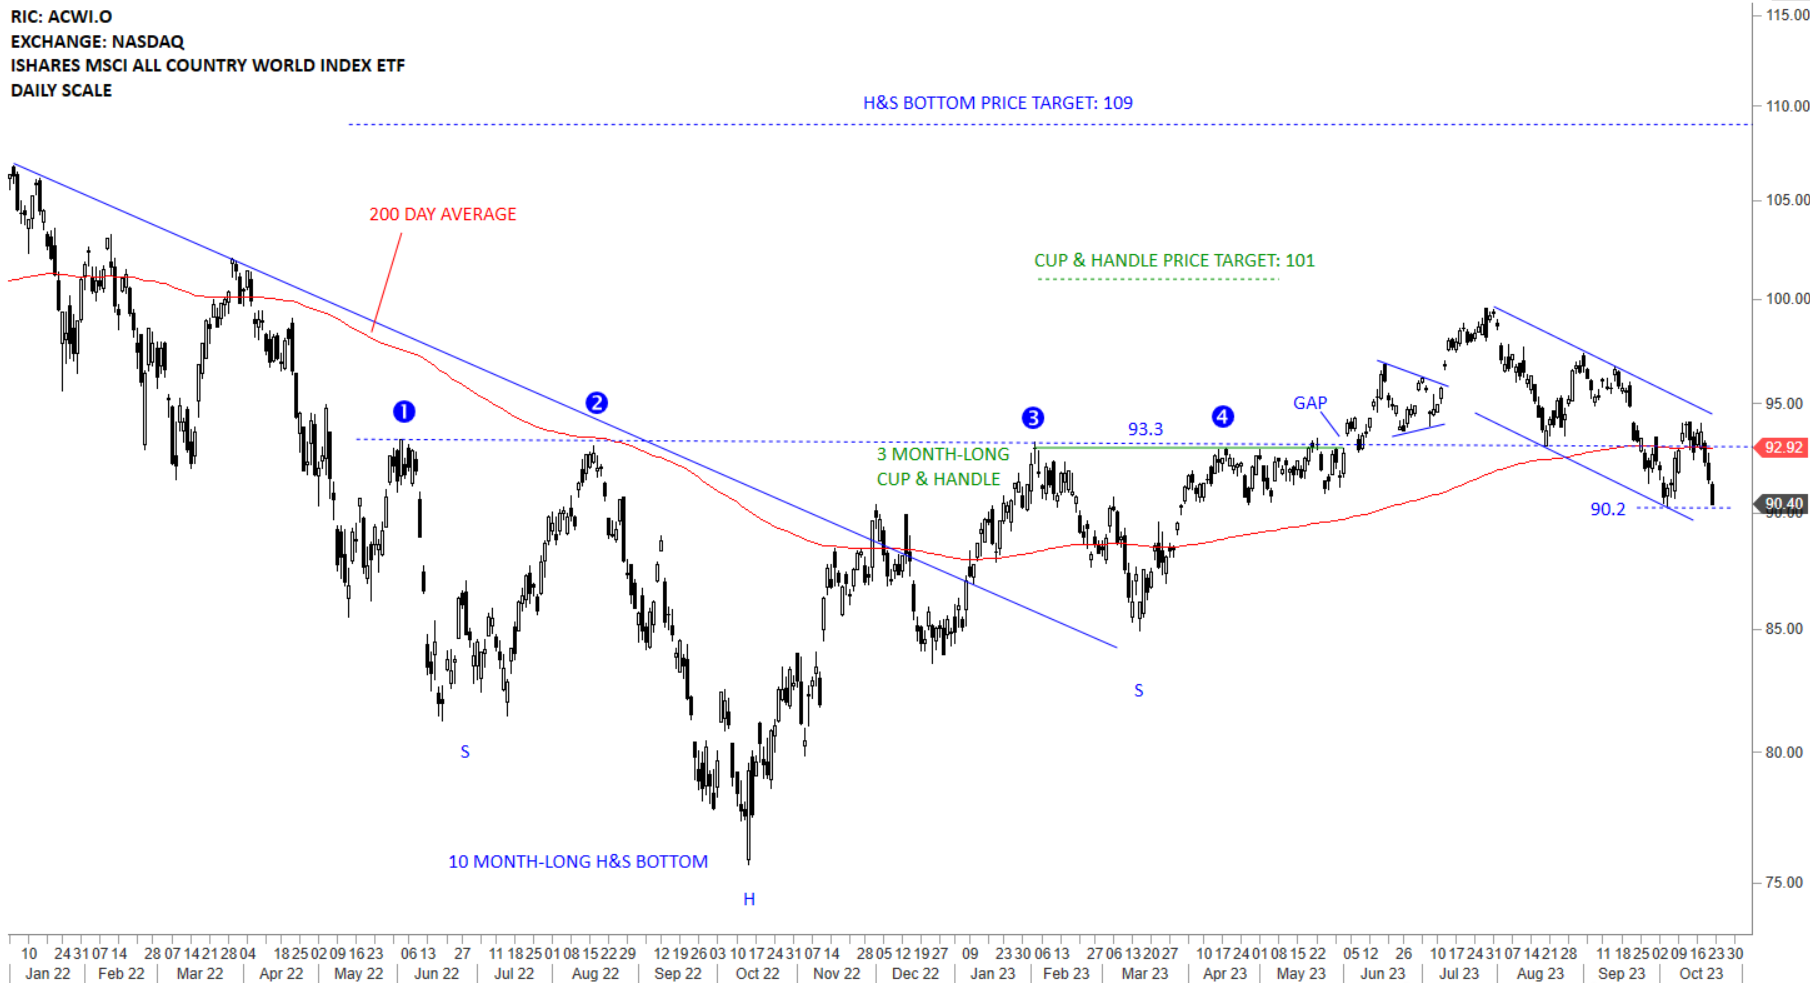
The benchmark for the Global equity markets performance, the iShares MSCI All Country World Index ETF (ACWI.O) is trying to stabilize above the 200-day average. Strong open to the week with a gap was followed by continued strength that pushed the ETF towards the minor resistance at 97.4 levels. With the recovery above the 200-day average, I start monitoring the chart with a bullish perspective. Short-term resistance is at 97.4 and support is at 94.1 level. During any pullback the ETF can fill the gap above 94.1 levels. Long-term H&S bottom price target stands at 109 levels.