Australia S&P ASX 50 Index (.AFLI)

Every week Tech Charts Global Equity Markets report features some of the well-defined, mature classical chart patterns under a lengthy watchlist and the chart pattern breakout signals that took place during that week. Global Equity Markets report covers single stocks from developed, emerging and frontier markets, ETF’s, select commodities, cryptocurrencies and global equity indices. Below chart, Australia S&P ASX 50 Index is from the review section of the weekly report. It is featuring a possible 2 year-long H&S continuation that can breakout to all-time highs.


Read more

GLOBAL EQUITY MARKETS – December 16, 2023

REVIEW


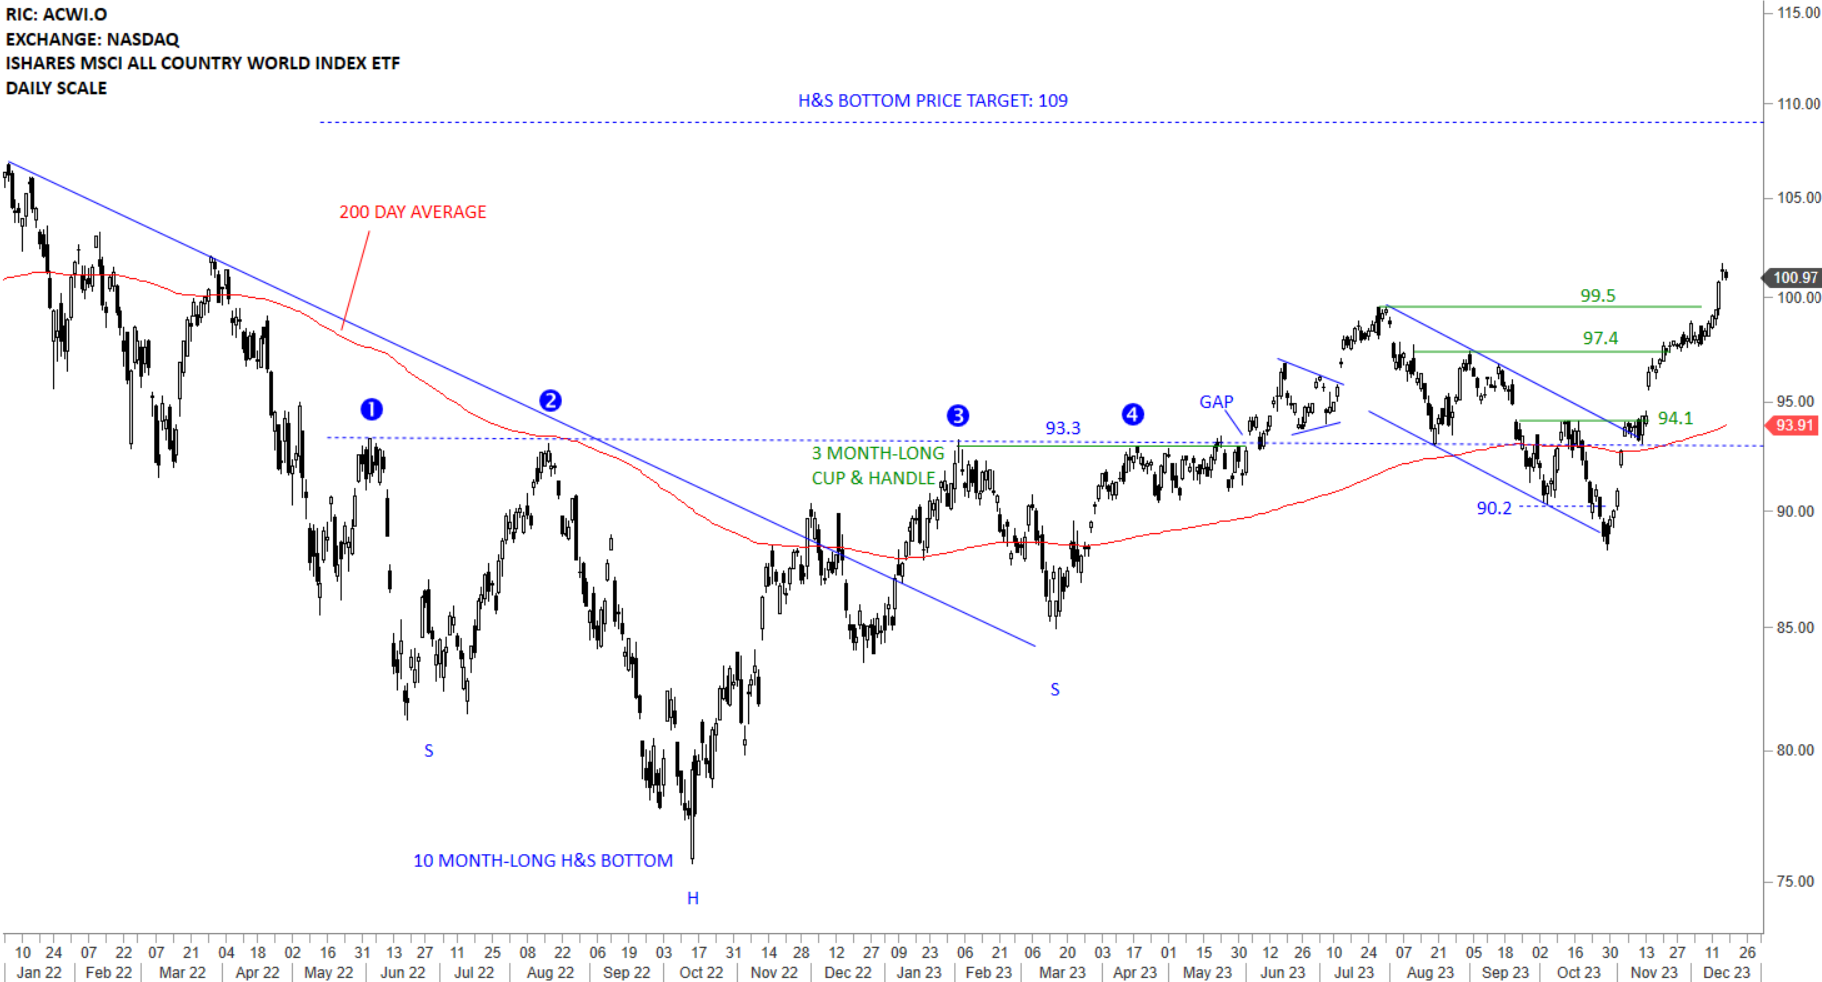
The benchmark for the Global equity markets performance, the iShares MSCI All Country World Index ETF (ACWI.O) cleared both minor resistances at 97.4 and 99.5 levels. The ETF is clearly above its 200-day average and in a steady uptrend. Long-term H&S bottom price target stands at 109 levels. Breakout above 99.5 levels is resuming the uptrend towards the H&S bottom price target at 109 levels. During any pullback 99.5 levels can act as short-term support.

Read more

CRYPTOCURRENCIES – December 10, 2023

BTCUSD reached rectangle price target at 38K. Uptrend remains intact. Short-term consolidation below 38K acted as a bullish continuation. ETHUSD reached its channel price target at 2,260 levels and now challenging the upper boundary of the possible rising wedge. Breakouts above the upper boundary of a rising wedge is usually followed by strong rallies.
Read more

GLOBAL EQUITY MARKETS – December 9, 2023

REVIEW


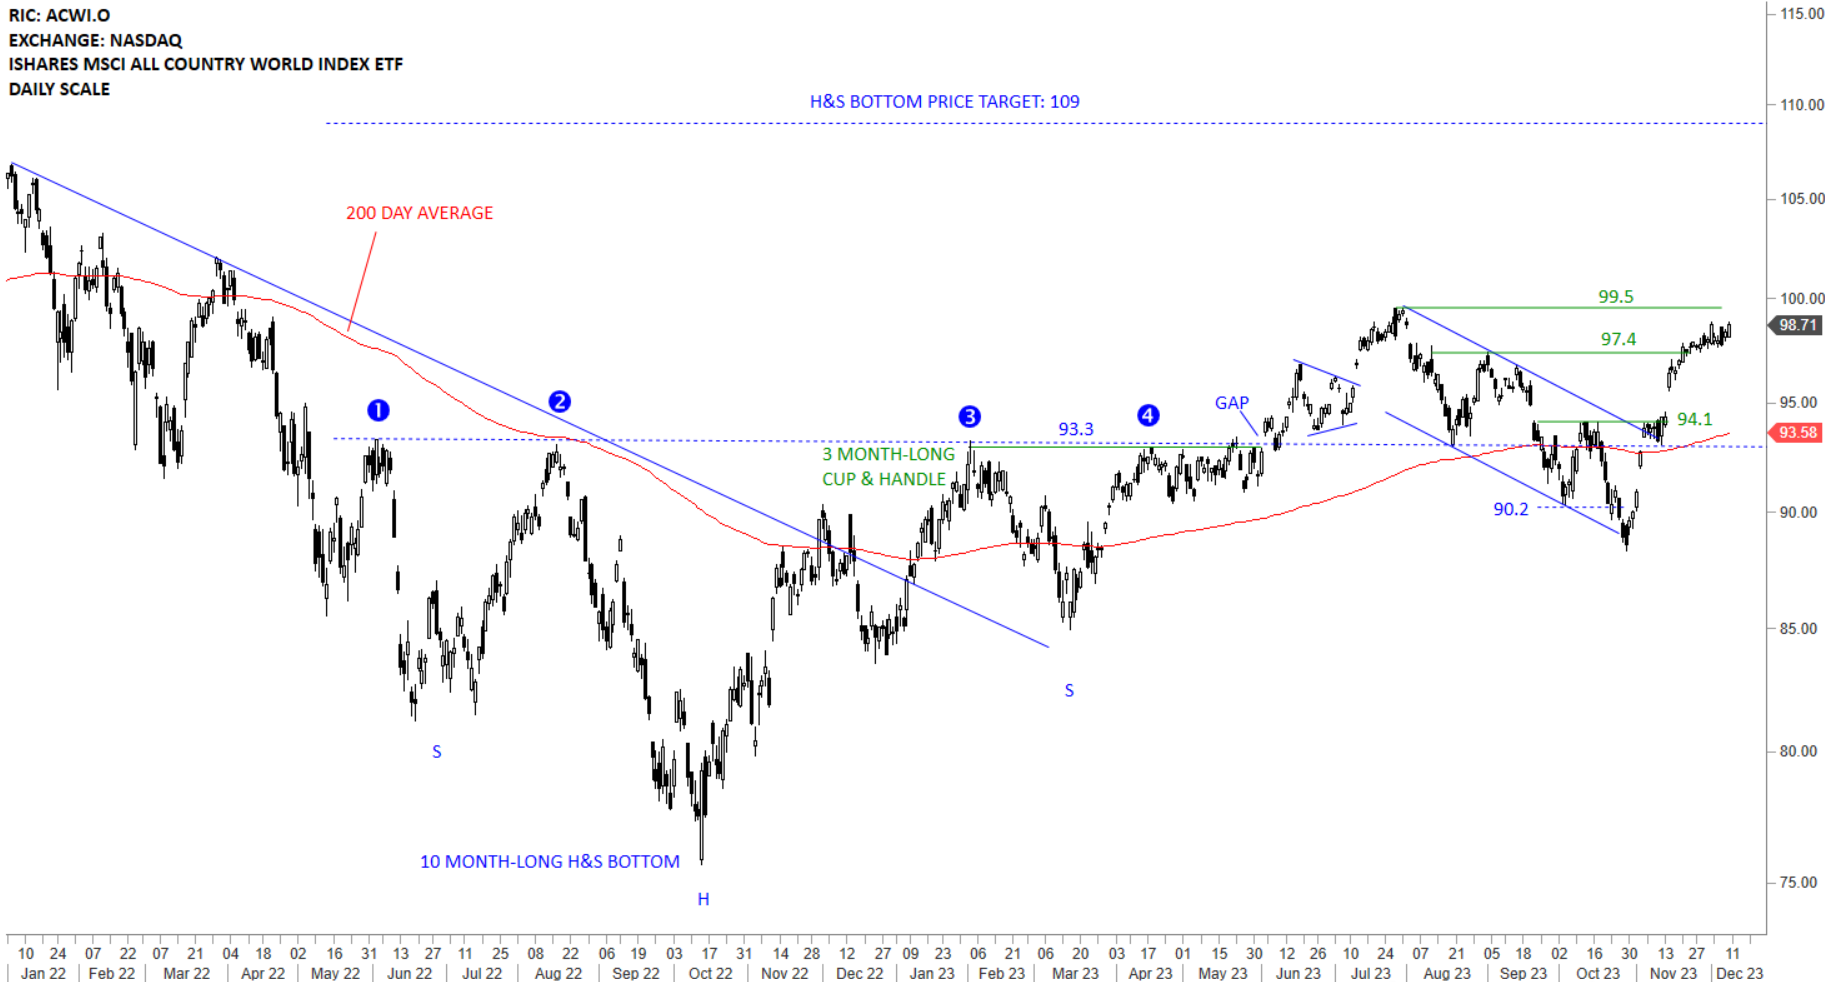
The benchmark for the Global equity markets performance, the iShares MSCI All Country World Index ETF (ACWI.O) is trying to stabilize above the 200-day average. The ETF is holding on to its gains and resuming towards the next resistance at 99.5 levels. With the recovery above the 200-day average, I start monitoring the chart with a bullish perspective. During any pullback the ETF can fill the gap above 94.1 levels, which could be considered as a pullback to the long-term average. Long-term H&S bottom price target stands at 109 levels. Breakout above 99.5 levels can resume the uptrend towards the H&S bottom price target at 109 levels.

Read more

Live Webinar and Q&A with Aksel – Thursday, December 14, 2023, 8:30 am mountain

Dear Tech Charts Members,

We are continuing our Member webinar series with chart pattern reliability and how the latest market conditions have impacted success rates on different chart patterns. We plan to have an interactive session and an open discussion to answer members’ questions on different markets and specific charts of interest. Please send your charts and questions to aksel@techcharts.net, and I will add them to the webinar discussion points.

Scheduled for: Thursday, December 14, 8:30 am mountain (register below)

Read more

GLOBAL EQUITY MARKETS – December 2, 2023

REVIEW


The benchmark for the Global equity markets performance, the iShares MSCI All Country World Index ETF (ACWI.O) is trying to stabilize above the 200-day average. The ETF is holding on to its gains and resuming towards the next resistance at 99.5 levels. With the recovery above the 200-day average, I start monitoring the chart with a bullish perspective. During any pullback the ETF can fill the gap above 94.1 levels, which could be considered as a pullback to the long-term average. Long-term H&S bottom price target stands at 109 levels.

Read more

CRYPTOCURRENCIES – November 26, 2023

BTCUSD reached rectangle price target at 38K. Uptrend remains intact. Short-term consolidation below 38K can act as a bullish continuation. ETHUSD chart might be forming a rising wedge with the upper boundary acting at resistance at 2260 levels. ETHUSD also has a channel price target at 2260 levels, an inflection point.
Read more

GLOBAL EQUITY MARKETS – November 25, 2023

REVIEW


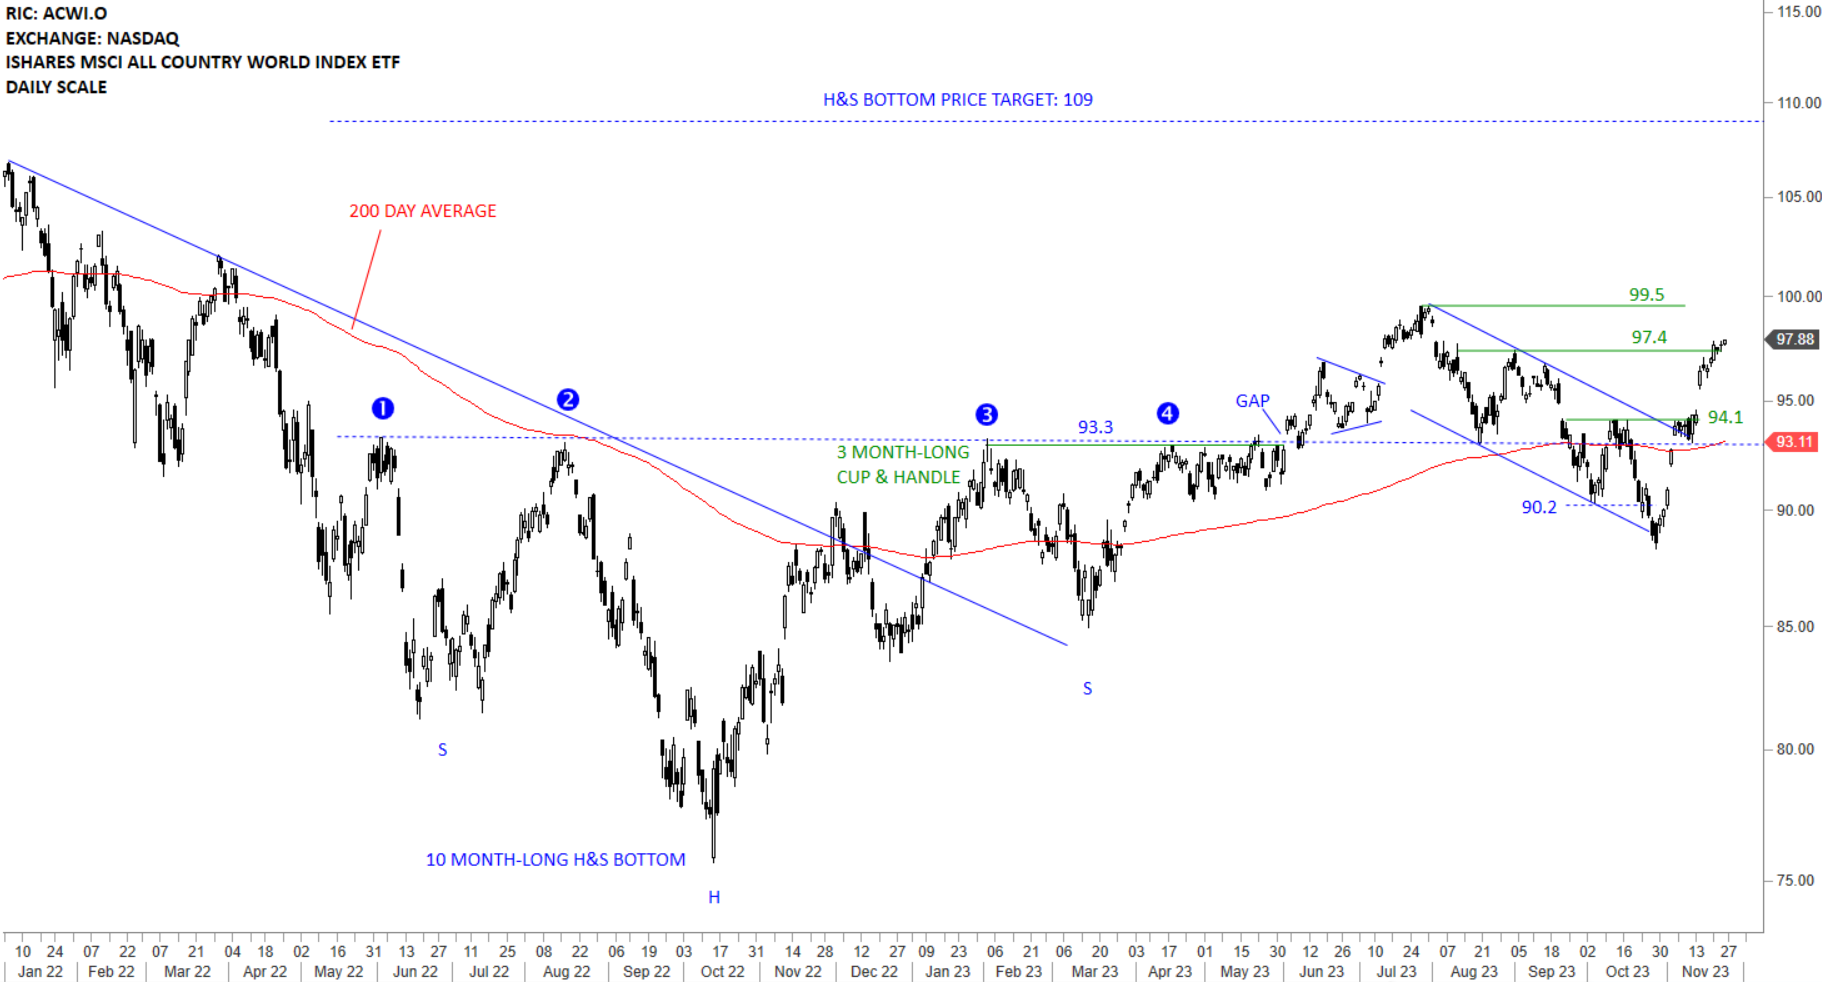
The benchmark for the Global equity markets performance, the iShares MSCI All Country World Index ETF (ACWI.O) is trying to stabilize above the 200-day average. The ETF held on to last week’s gains. Two short-term resistance levels are at 97.4 and 99.5. With the recovery above the 200-day average, I start monitoring the chart with a bullish perspective. During any pullback the ETF can fill the gap above 94.1 levels. Long-term H&S bottom price target stands at 109 levels.

Read more

GLOBAL EQUITY MARKETS – November 18, 2023

REVIEW


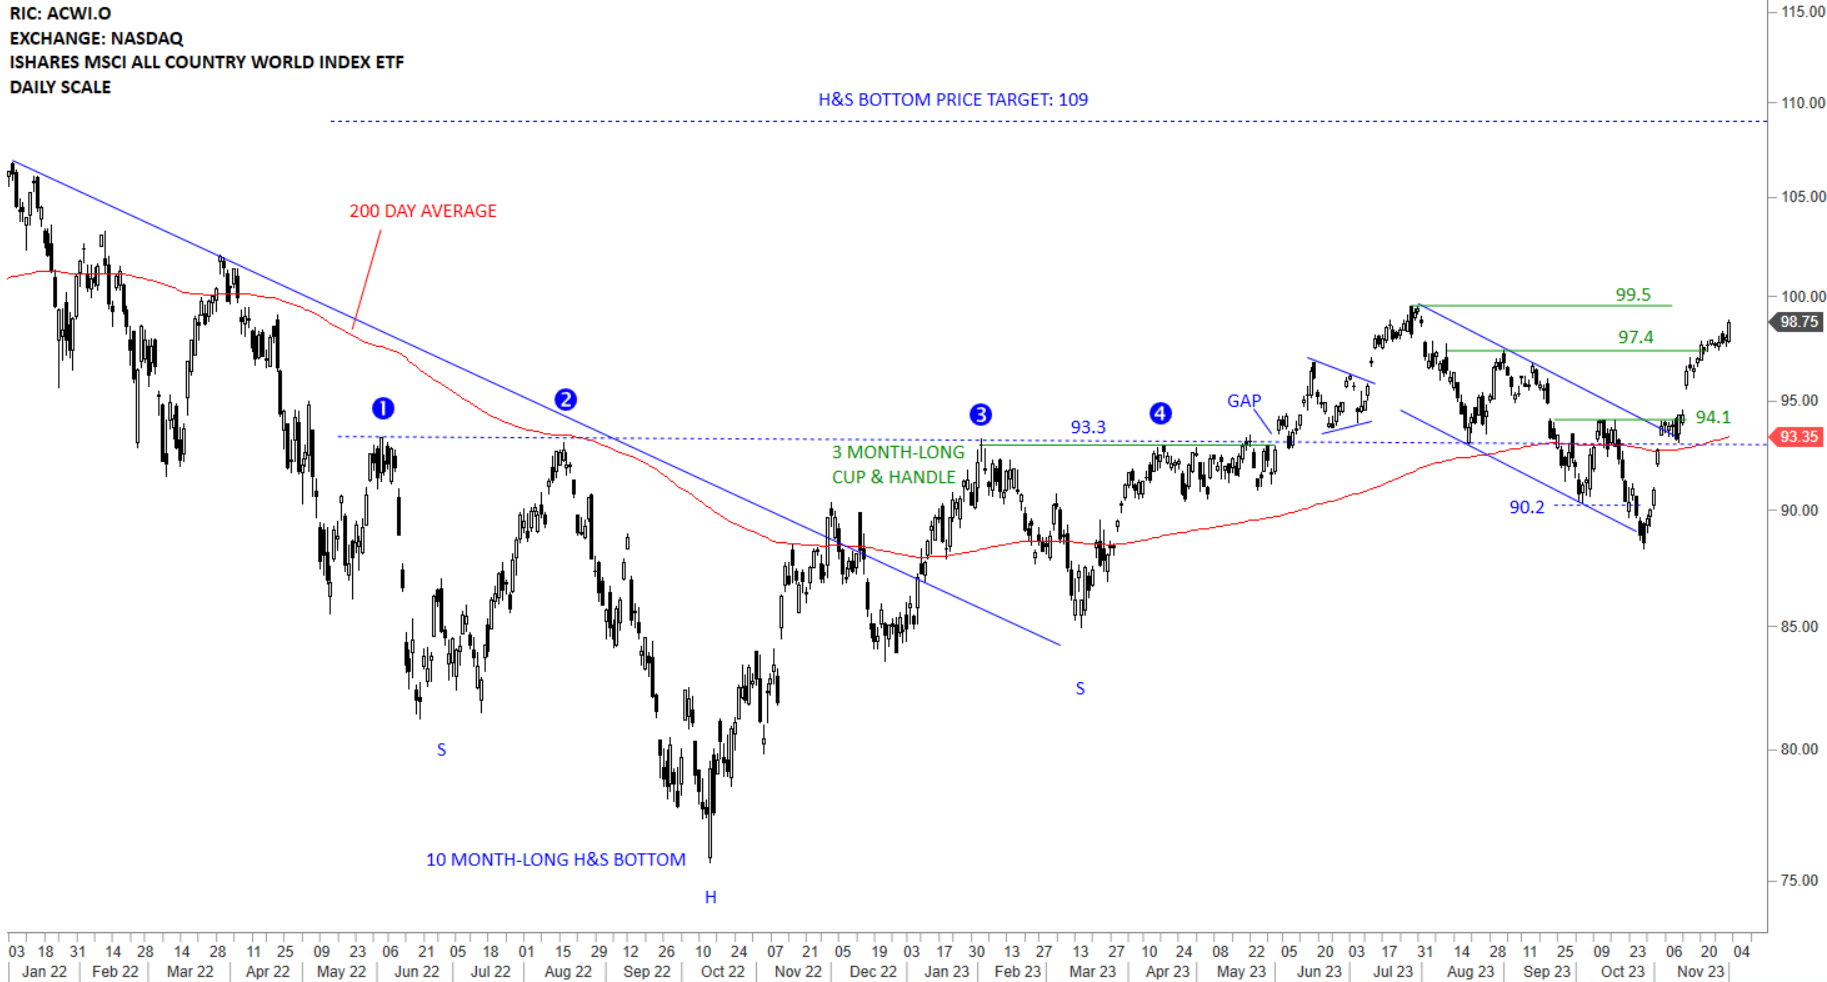
The benchmark for the Global equity markets performance, the iShares MSCI All Country World Index ETF (ACWI.O) is trying to stabilize above the 200-day average. Strong open to the week with a gap was followed by continued strength that pushed the ETF towards the minor resistance at 97.4 levels. With the recovery above the 200-day average, I start monitoring the chart with a bullish perspective. Short-term resistance is at 97.4 and support is at 94.1 level. During any pullback the ETF can fill the gap above 94.1 levels. Long-term H&S bottom price target stands at 109 levels.

Read more

CREDIT AGRICOLE SA (CAGR.PA)

Every week Tech Charts Global Equity Markets report features some of the well-defined, mature classical chart patterns under a lengthy watchlist and the chart pattern breakout signals that took place during that week. Global Equity Markets report covers single stocks from developed, emerging and frontier markets, ETF’s, select commodities, cryptocurrencies and global equity indices. Below chart, Credit Agricole SA is from the watchlist section of the weekly report. It is featuring possible ascending triangle continuation.

Read more