Reversal Chart Patterns – January 2019 Tech Charts Webinar
Reversal Chart Patterns – January 2019 Tech Charts Webinar
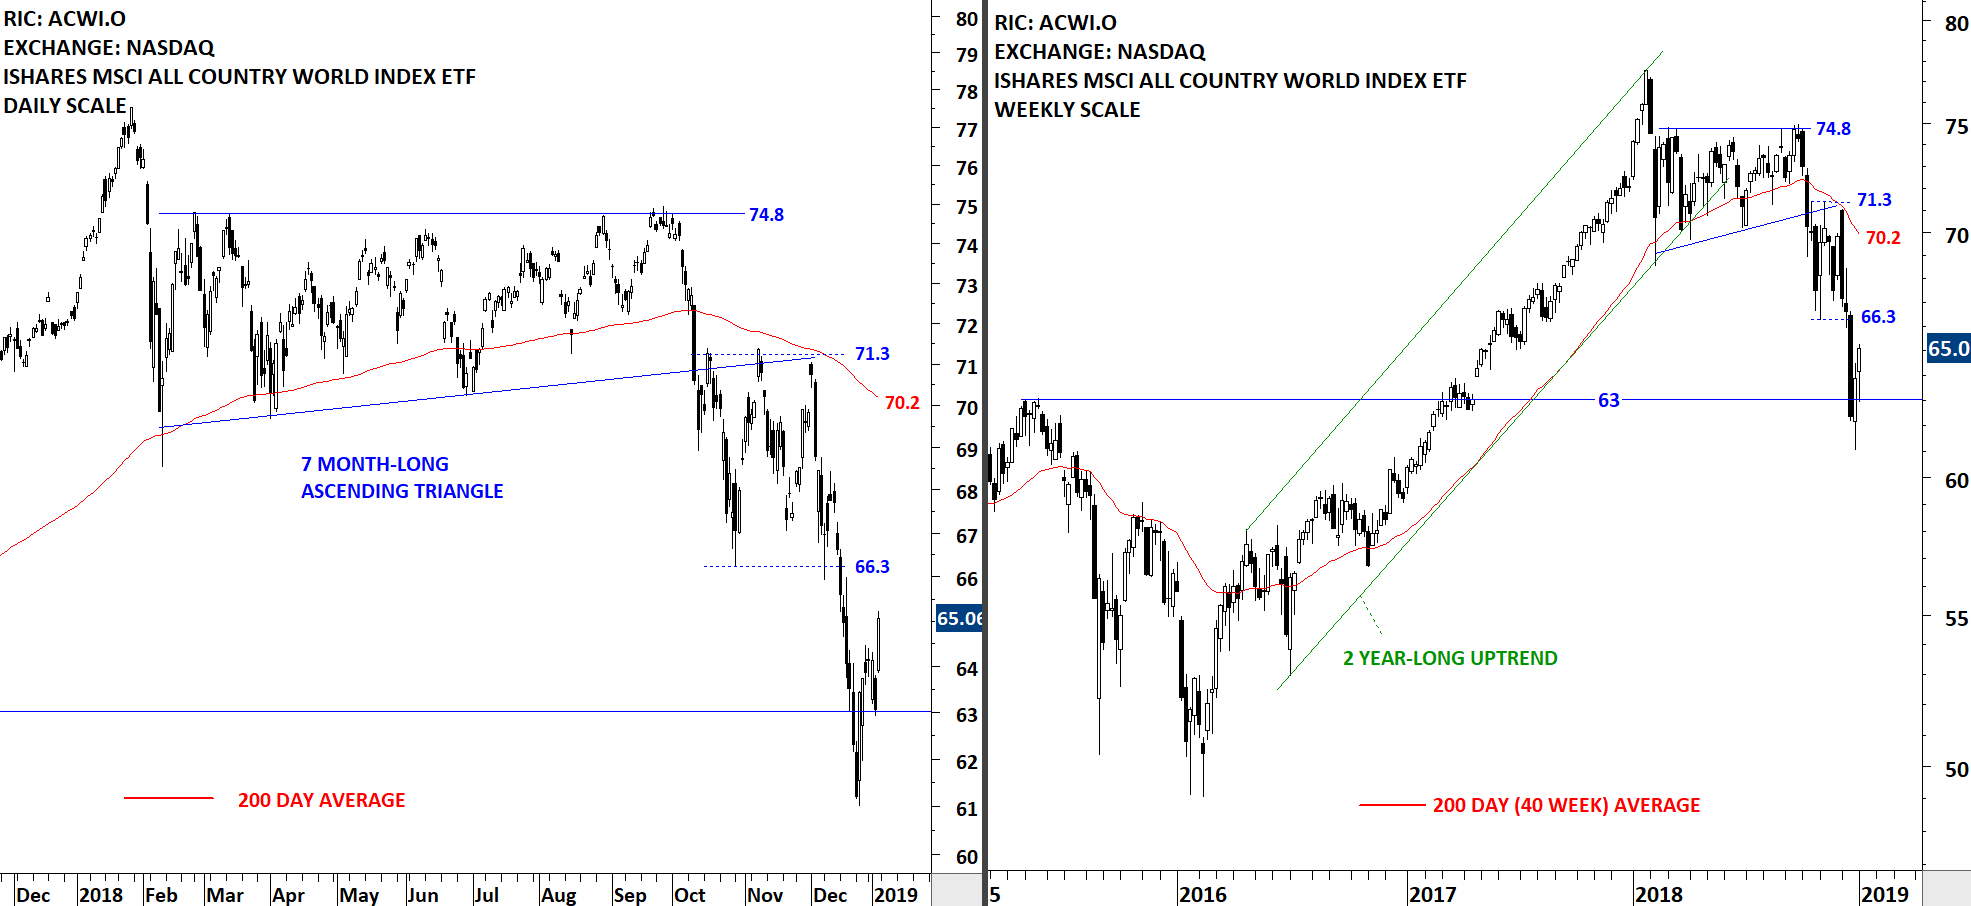
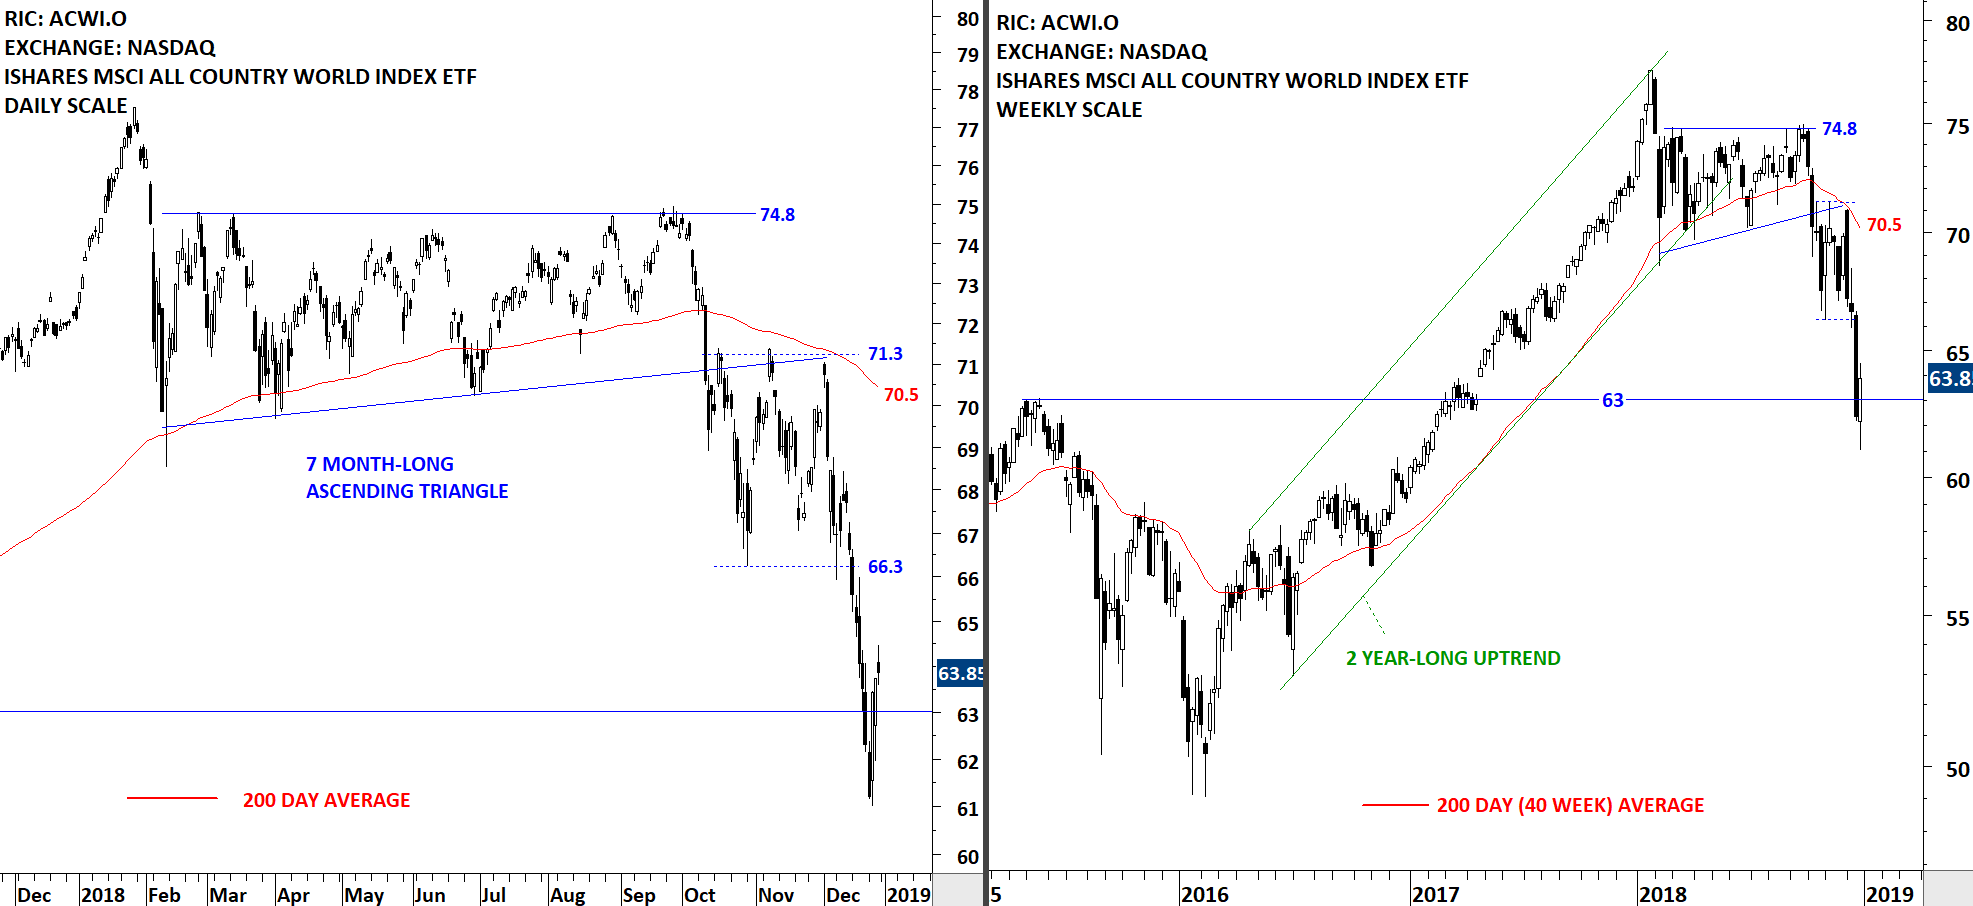
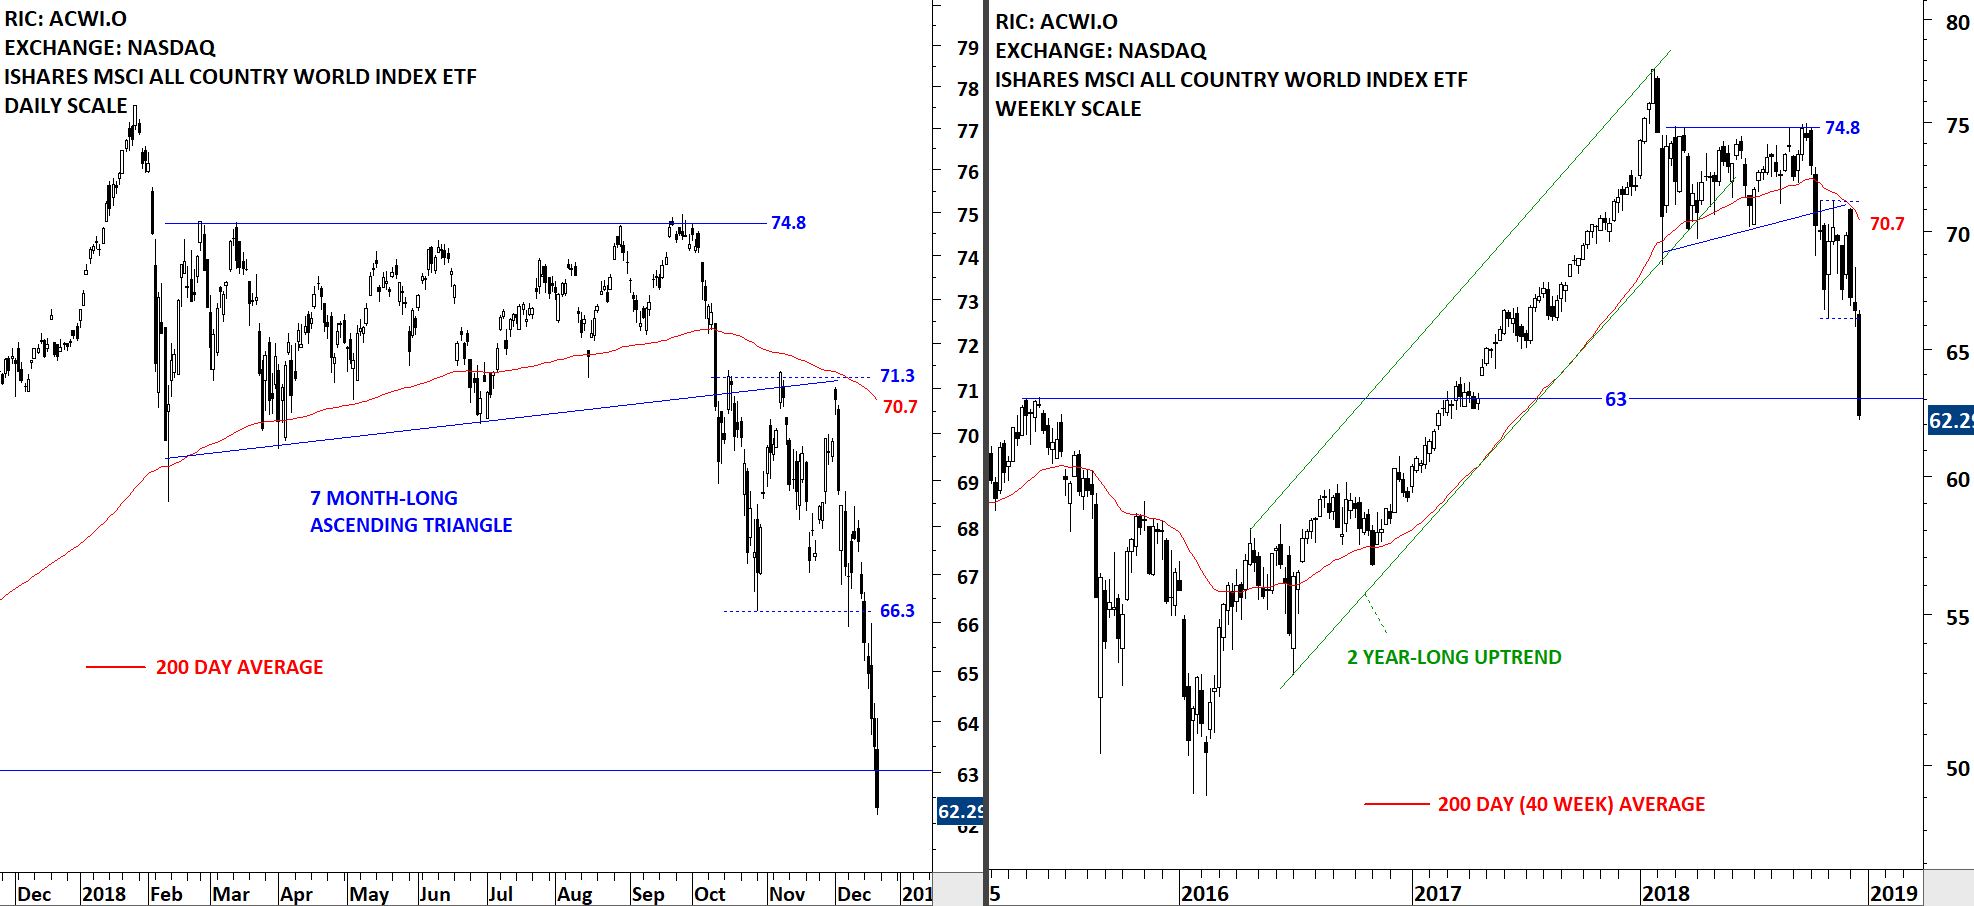
- We will review some of those chart pattern breakdowns that were featured in the Global Equity Markets report.
- We will review some of the qualities we look for when identifying reversal chart patterns
- We will look at some of the developing top formations.
- We will continue to highlight Tech Charts members favorite chart pattern setups in different equity markets.
- Live questions from Members
Live questions from Members
- I wondered if you could discuss gold and silver in dollars please? They seem to have bottomed, but not clear on what formations they may be making. 48:25
- Japan I have seen some folks draw non-horizontal boundary lines on potential H&S tops. Is this valid? 49:33 Link mentioned VEDANTA LTD (VDAN.NS)
- Italy would the buy signal come at a reversal to 15.8 or earlier? 51:16
- For the launching patterns you showed – where do you put your stop? Can you discuss trade management? 52:08
- Germany had a nice candle right where it should at the target low price, what do we need to see to be a buyer for a reversal upside? 53:44
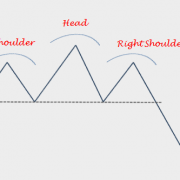
- For PKG the right shoulder was higher than the left shoulder – What are your thoughts on this, do you prefer lower right shoulder? How much of a difference in shoulder height would you ignore? 56:06
- Can you talk about volume – how you use it? 57:25 – Link mentioned VOLUME AS A CONFIRMING INDICATOR
- Korea has an almost horizontal neck line, valid? 59:40
- On the breakdown of the H&S – Are you taking into consideration volume as a confirmation as well? 1:00:11
- What is the difference between consolidation, distribution, and continuation patterns? 1:00:44
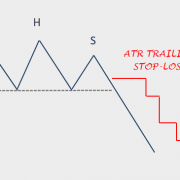
- You mention a price target on the charts, what about stop loss? Where would you set your stop loss? 1:03:00 Link mentioned ATR Trailing Stop-Loss – H&S Top
- If you are new to trading – How would you suggest starting? 1:03:43
- If a breakout signal is missed, would you try to enter at a rebound? 1:07:24
- If the price target is met do you take profit on the whole position? Or keep some on and use a trailing stop? 1:08:20
- When you draw your diagonal trend channels, do you start with the line on the top of the candles or the bottom? And are the charts linear or log? 1:09:06
- On the DAX why draw the neckline as horizontal? 1:10:23
- For ascending and descending triangles are there a minimum/ideal number of contact points you look for to define these? 1:11:45
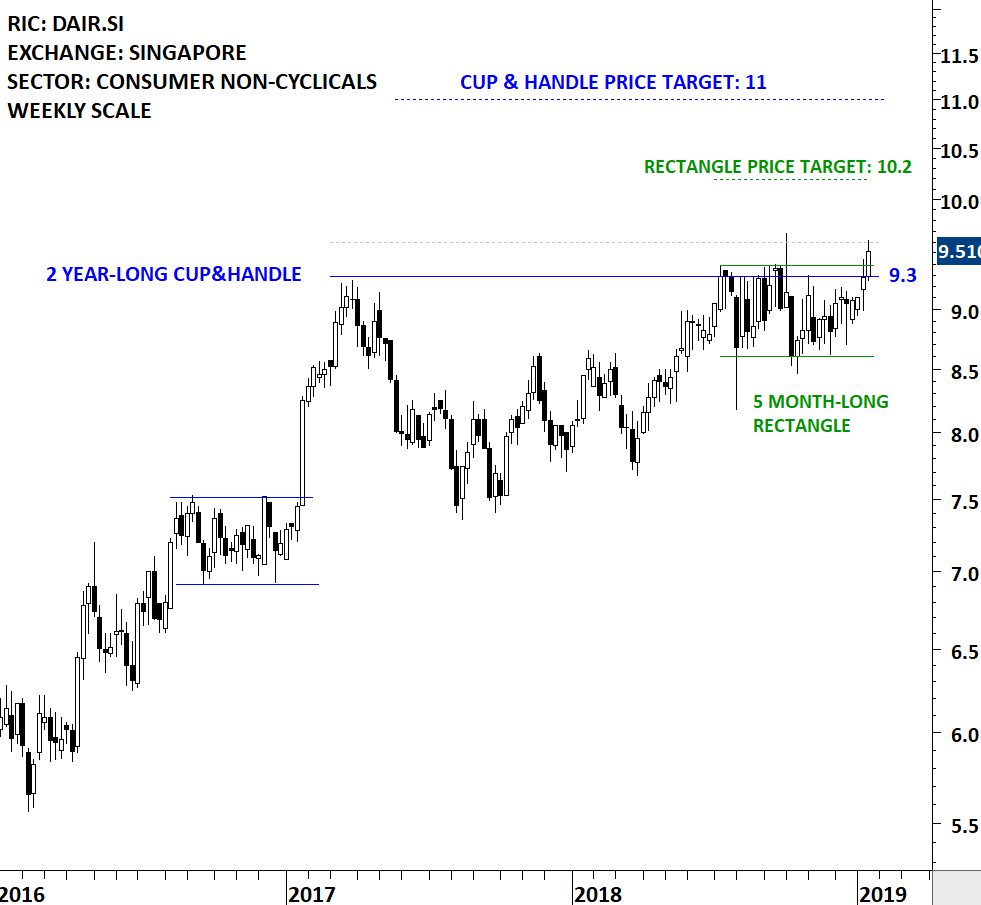
- When you have 2 patterns e.g. H&S and rectangle, which price target should we use? 1:13:40
Recorded live 1.10.2019