Every week Tech Charts Global Equity Markets report features some of the well-defined, mature classical chart patterns under a lengthy watchlist and the chart pattern breakout signals that took place during that week. Global Equity Markets report covers single stocks from developed, emerging and frontier markets, ETF’s and global equity indices. The report starts with a review section that highlights the important chart developments on global equity benchmarks. This blog post features from the review section the China SSE 50 Index and from the watchlist section a breakout opportunity on Hisense Visual Technology Co listed on the Shanghai Stock Exchange.
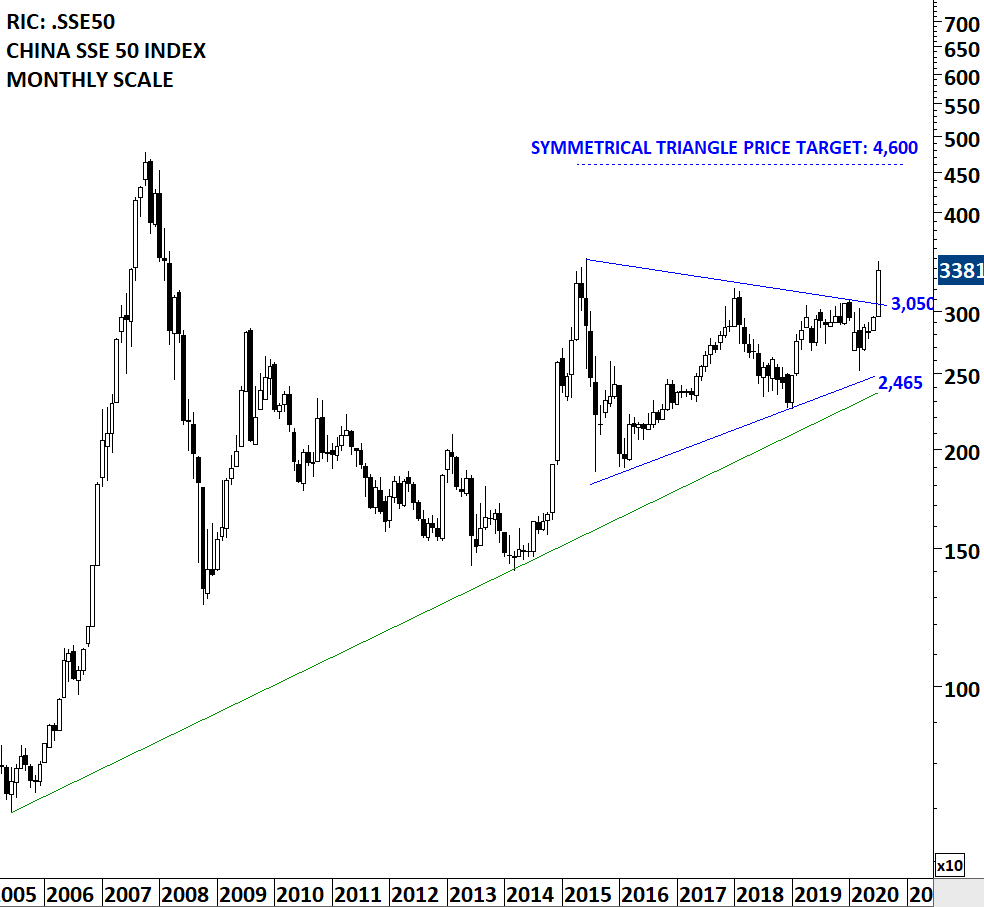
China SSE 50 Index breached the upper boundary of its possible 5 year-long symmetrical triangle. Last week’s strong performance cleared important technical levels. Breakout from the 5 year-long symmetrical triangle can set the tone for Emerging Markets performance in the coming years. Strong performance on the SSE 50 Index alerts us to consider Hong Kong and China listed equities. Below is a bullish chart pattern development on Hisense Visual Technology Co from Shanghai Stock Exchange. More and more bullish setups are developing on Chinese and Hong Kong listed equities. (Data as of 07/07/2020 CET 15:00)
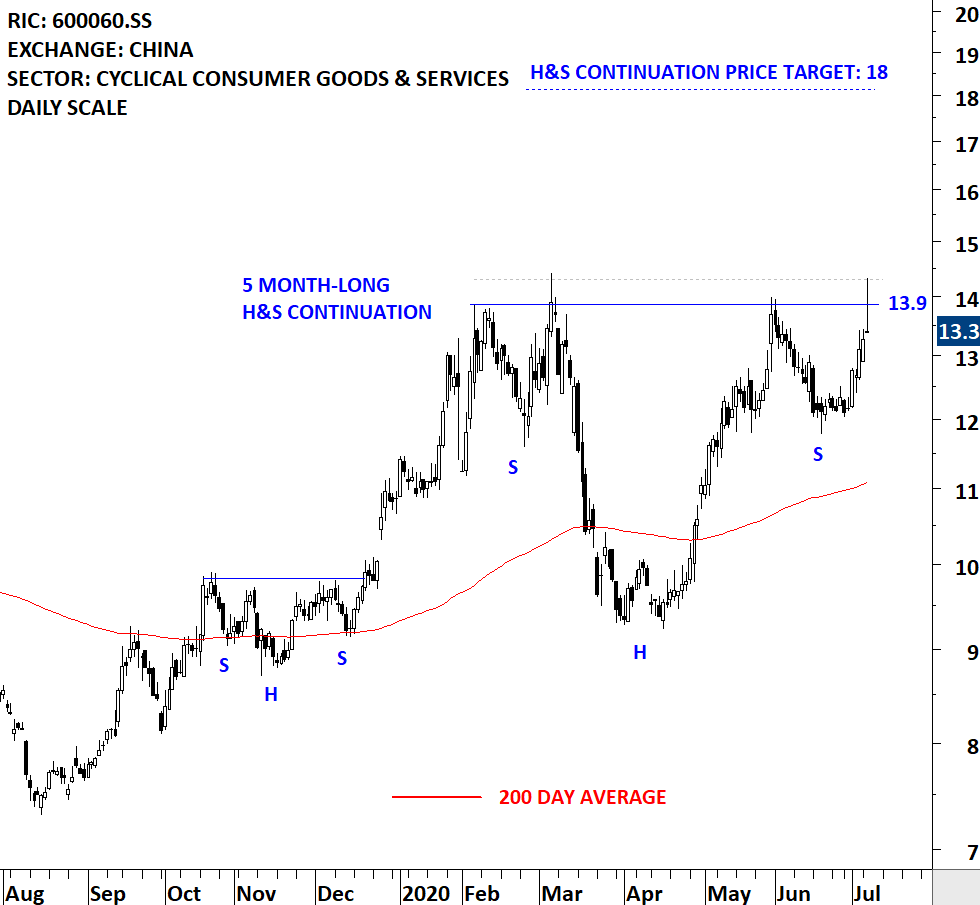
HISENSE VISUAL TECHNOLOGY CO LTD (600060.SS)
Hisense Visual Technology Co., Ltd., formerly QINGDAO HISENSE ELECTRIC CO., LTD., is a China-based company principally engaged in the manufacture and distribution of televisions. The Company’s main products are television sets, including ultra liquid crystal display (LCD) televisions, laser televisions and personal Internet televisions. The Company distributes its products in domestic and overseas markets. The stock is listed on the Shanghai Stock Exchange. Price chart formed a 5 month-long H&S continuation with the horizontal boundary acting as strong resistance at 13.90 levels. The horizontal boundary was tested several times over the course of the chart pattern. A daily close above 14.30 levels will confirm the breakout from the 5 month-long H&S continuation with the possible chart pattern price target of 18.00 levels.
Tech Charts Membership

By becoming a Premium Member, you’ll be able to improve your knowledge of the principles of classical charting.
With this knowledge, you can merge them with your investing system. In fact, some investors use my analyses to modify their existing style to invest more efficiently and successfully.
Get Access Now
As a Premium Member of Aksel Kibar’s Tech Charts,
You will receive:
-
Global Equities Report. Delivered weekly.
-
Classical charting principles. Learn patterns and setups.
-
Actionable information. Worldwide indices and stocks of interest.
-
Risk management advice. The important trading points of each chart.
-
Information on breakout opportunities. Identify the ones you want to take action on.
-
Video tutorials. How patterns form and why they succeed or fail.
-
Watch list alerts. As they become available so you can act quickly.
-
Breakout alerts. Usually once a week.
-
Access to everything (now and as it becomes available)
o Reports
o Videos and video series
-
Multi-part webinar course. You learn the 8 most common charting principles.
-
Webinars. Actionable and timely advice on breaking out chart patterns.
For your convenience your membership auto renews each year.
Get Access Now