GLOBAL EQUITY MARKETS – February 17, 2024
REVIEW
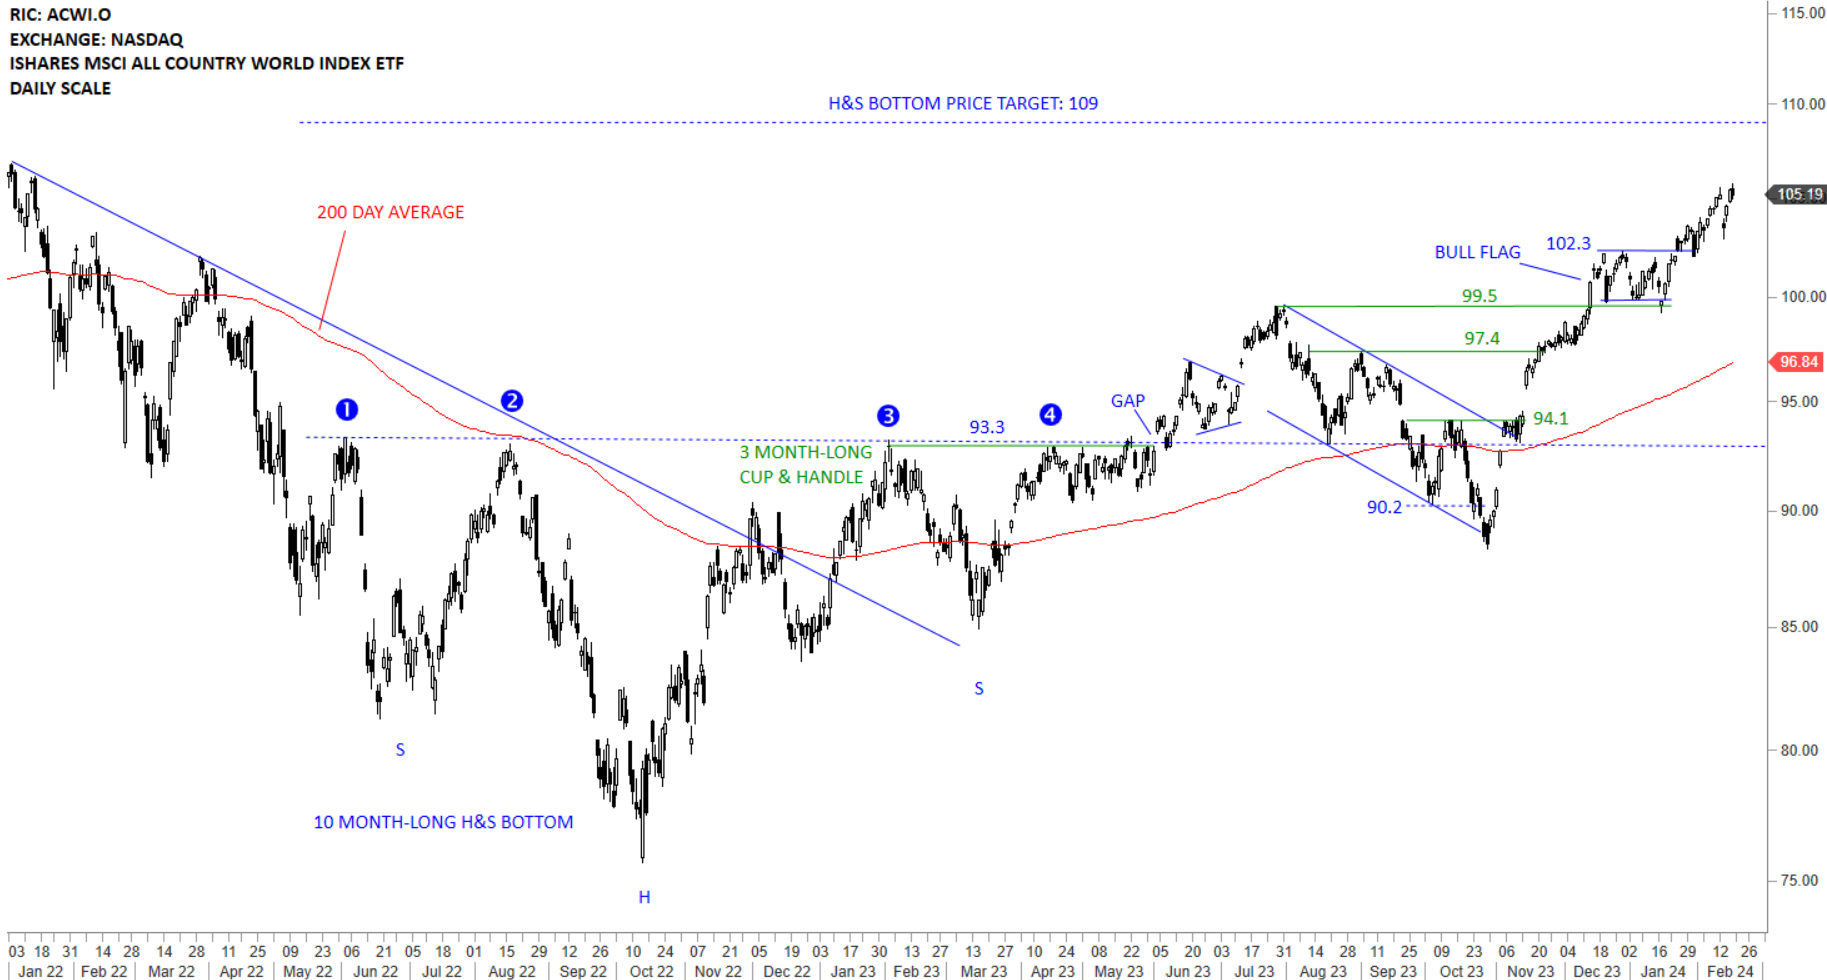
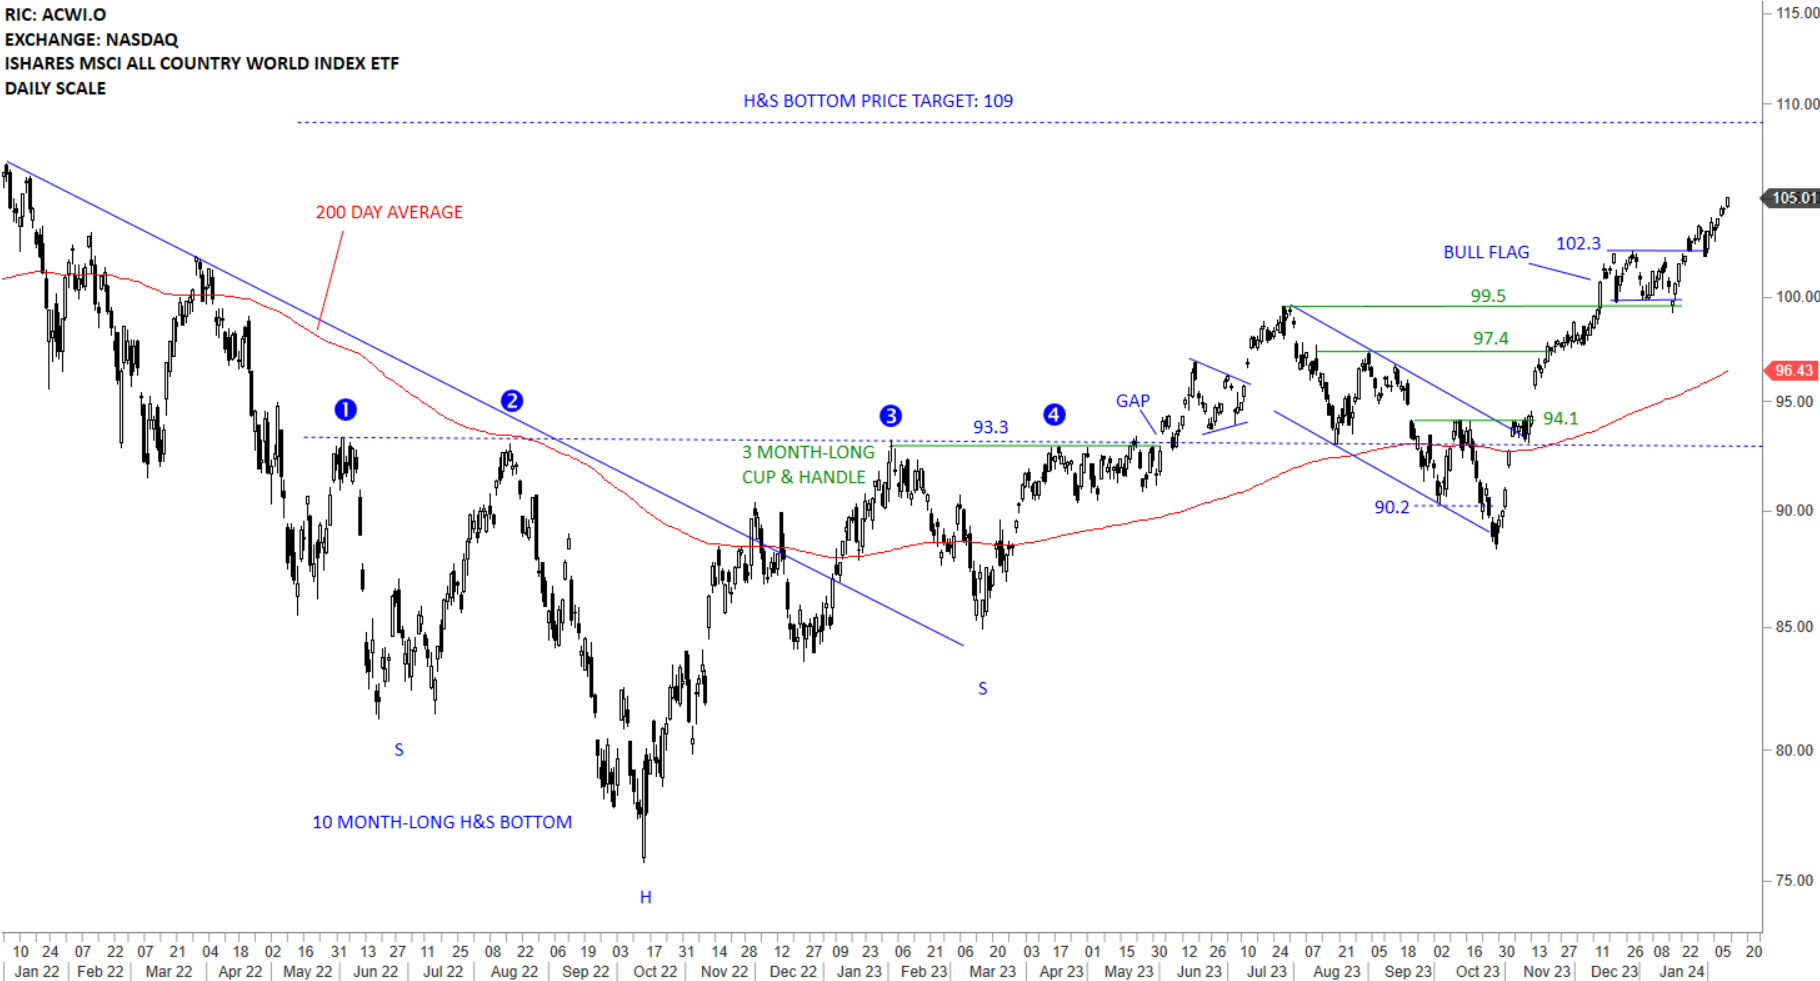
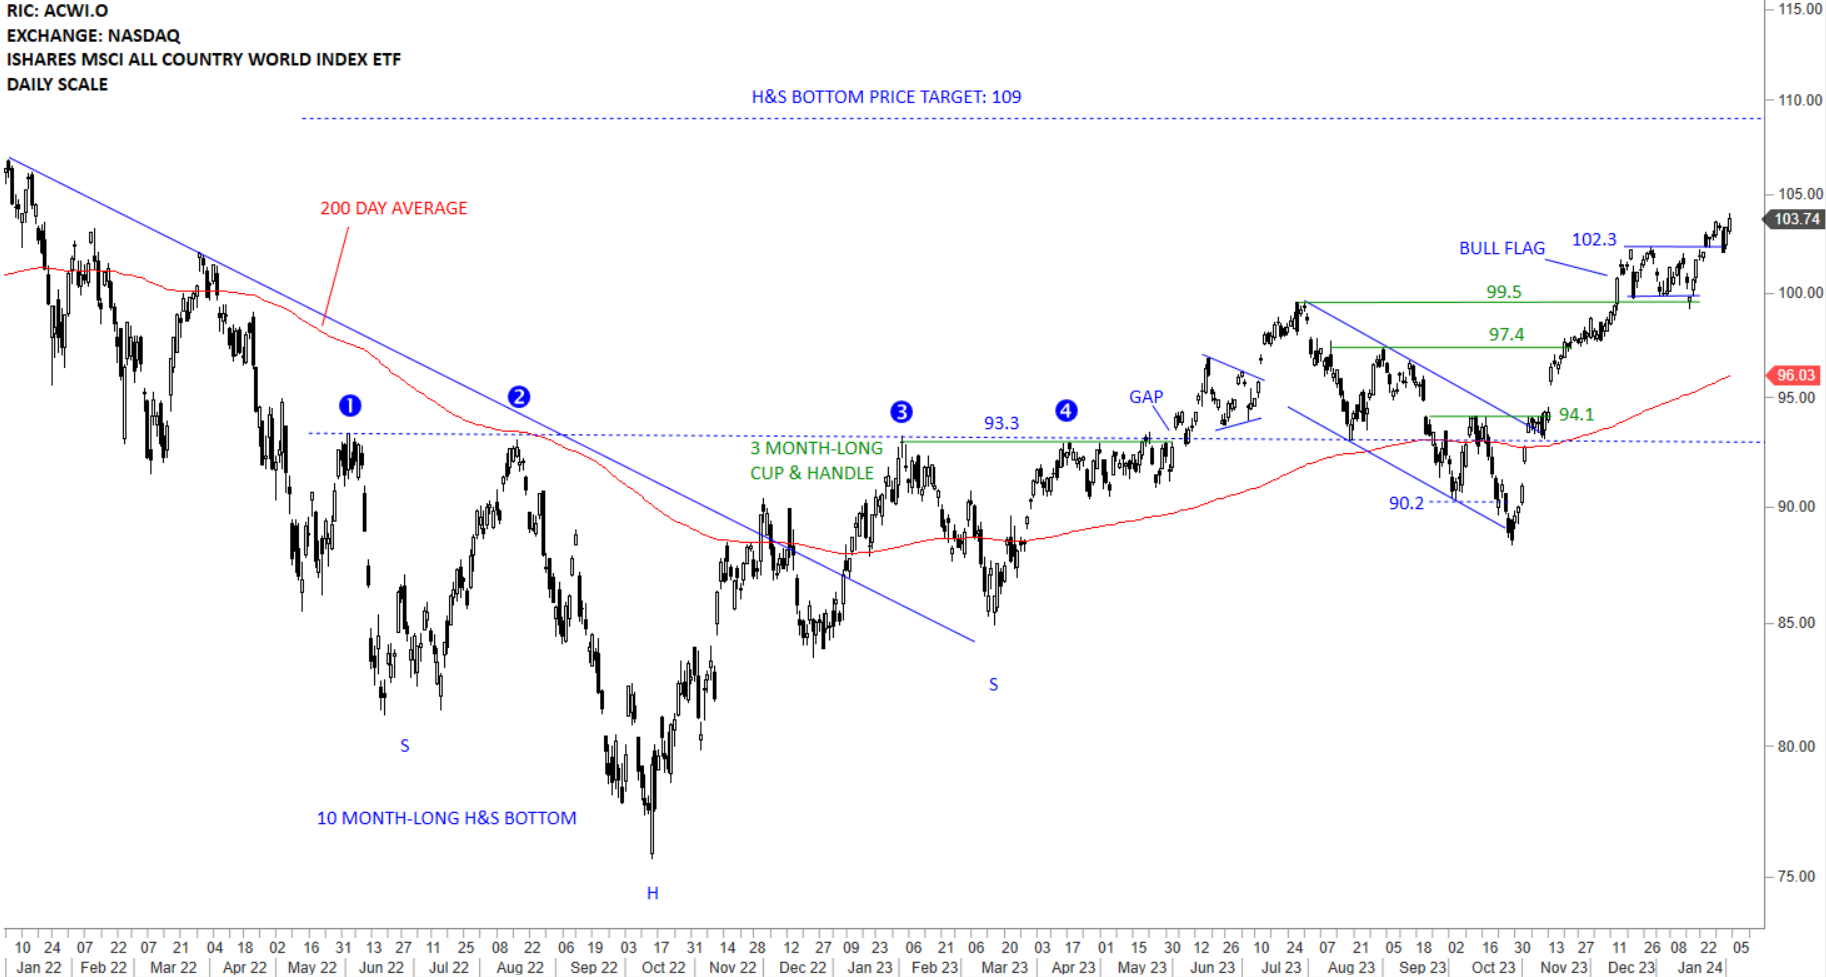
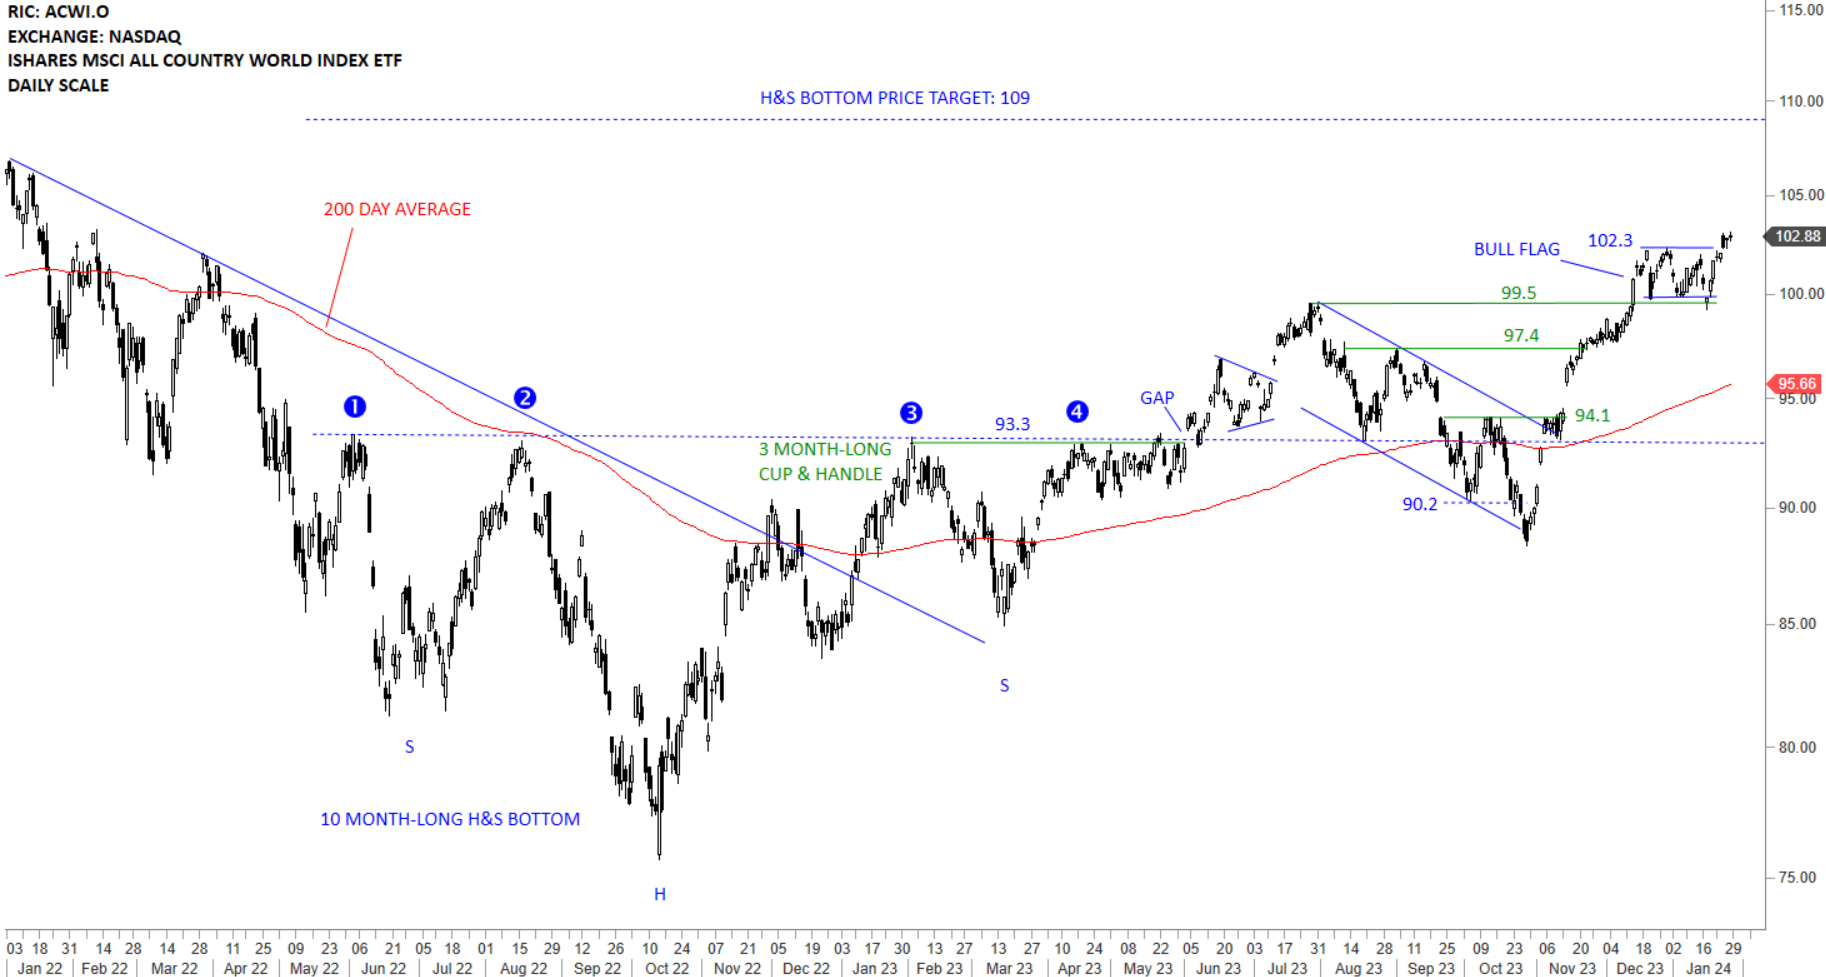
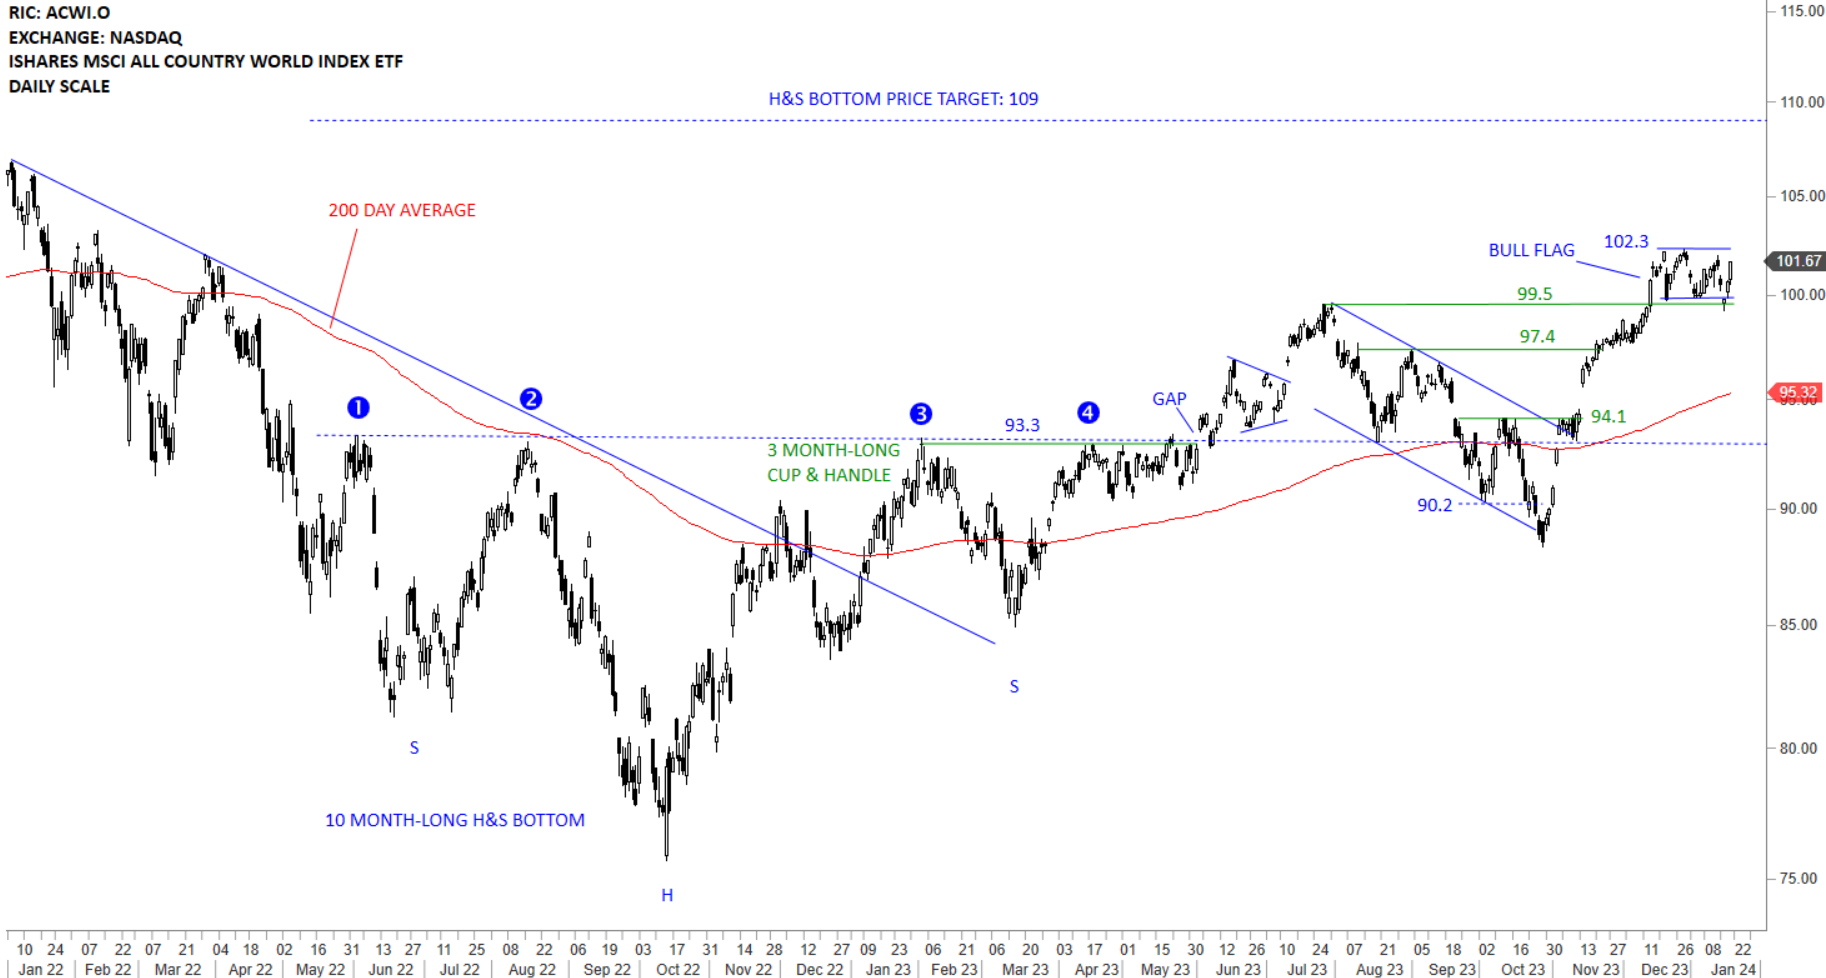
The benchmark for the Global equity markets performance, the iShares MSCI All Country World Index ETF (ACWI.O) is clearly above its 200-day average and in a steady uptrend. Long-term H&S bottom price target stands at 109 levels. The upper boundary of the flag at 102.3 will act as short-term support during any pullback. The ETF had a volatile week with a gap open lower followed by a sharp rebound to test the minor high at 105.6 levels. Short-term setbacks are part of a steady uptrend.