GLOBAL EQUITY MARKETS – December 23, 2023
REVIEW
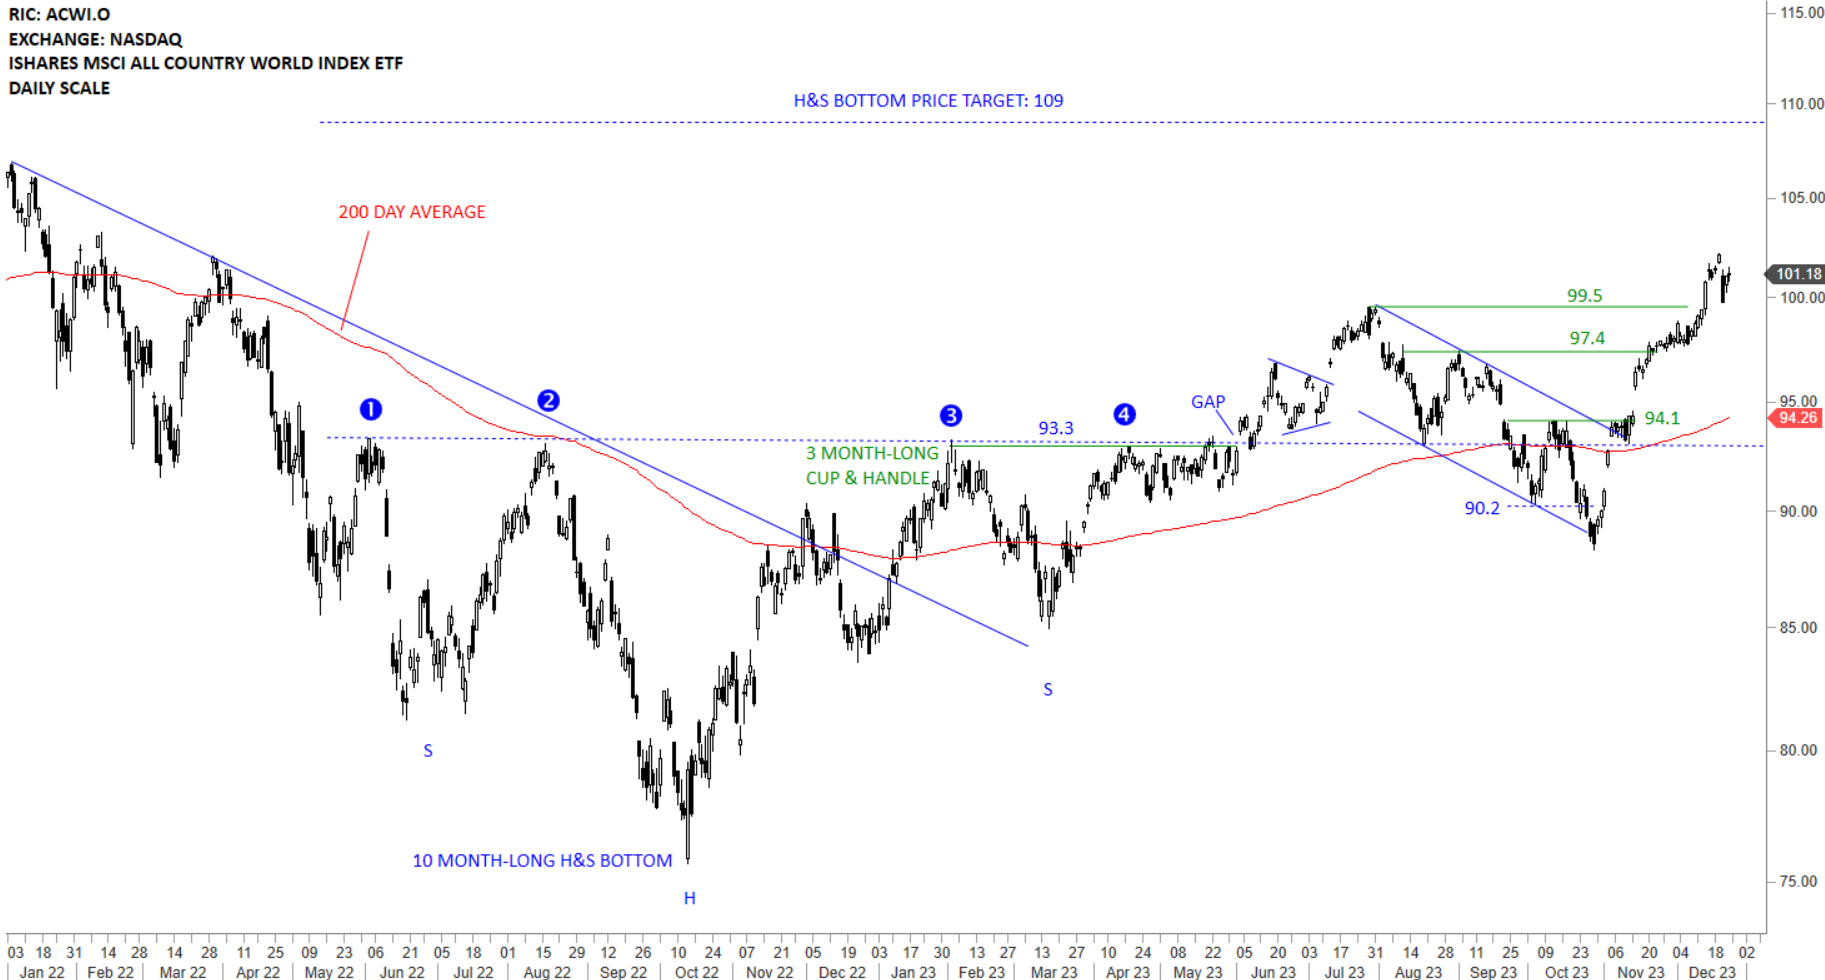
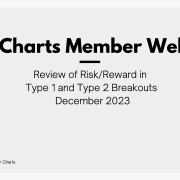
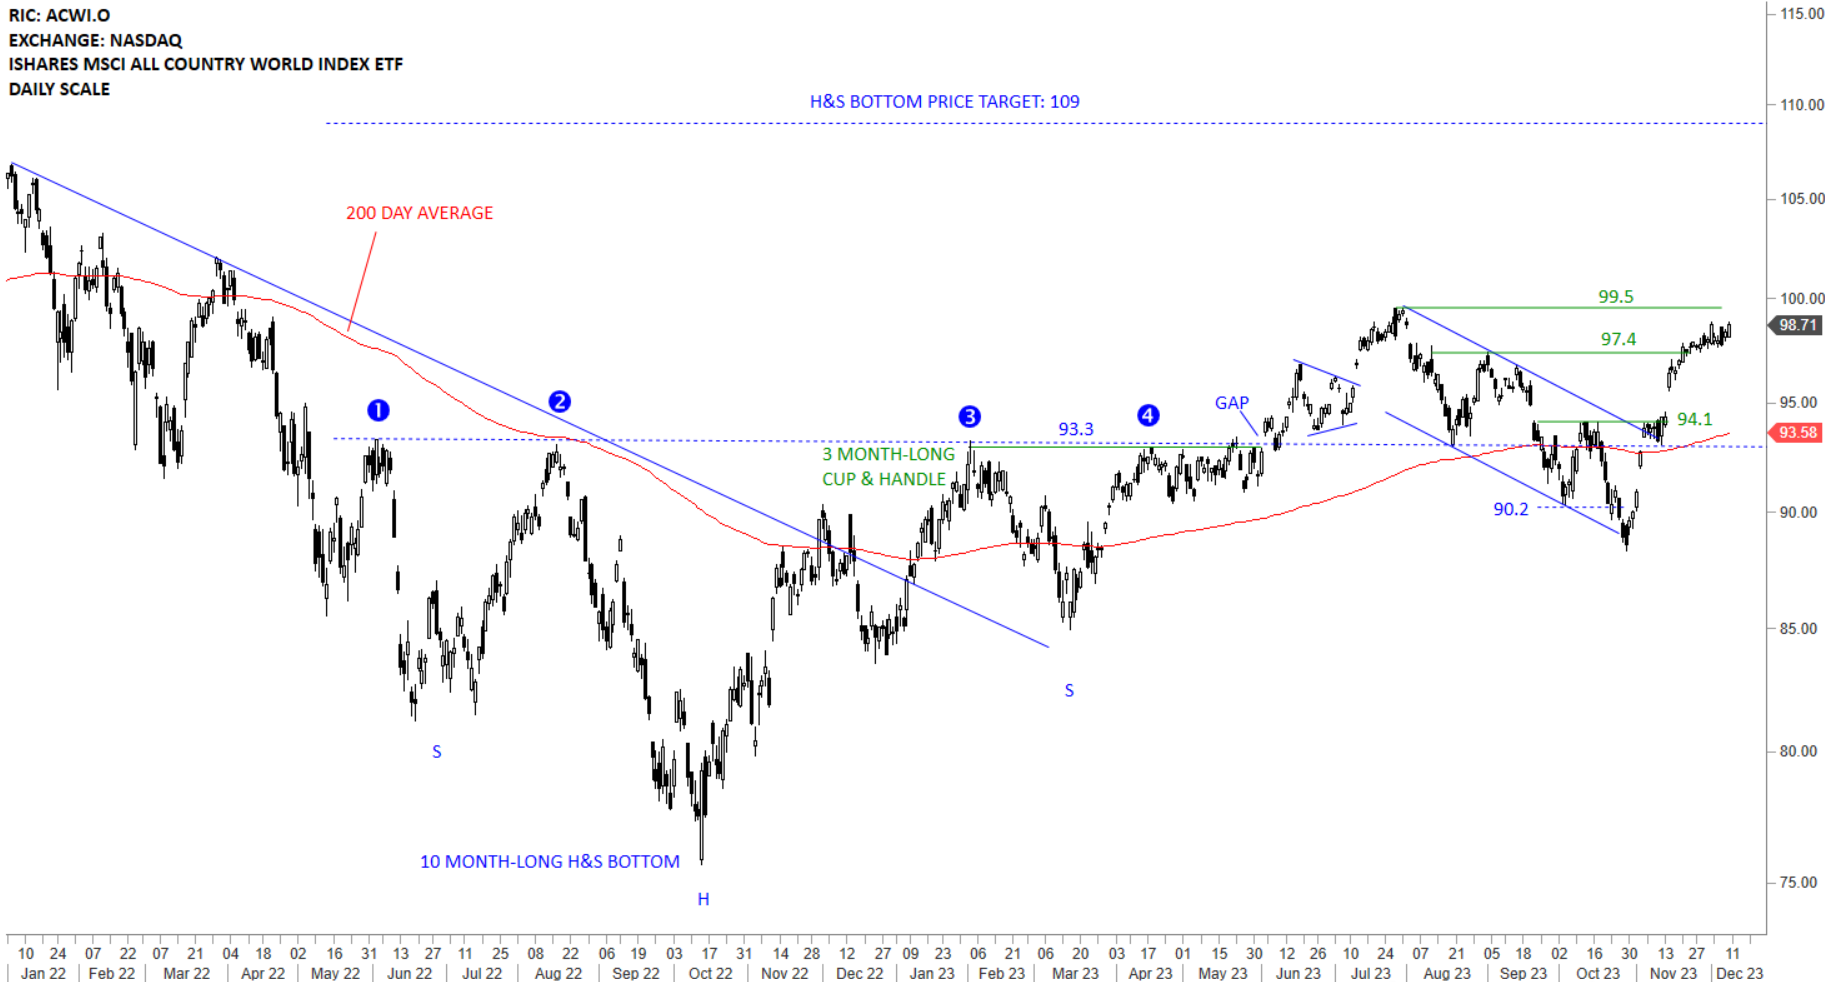
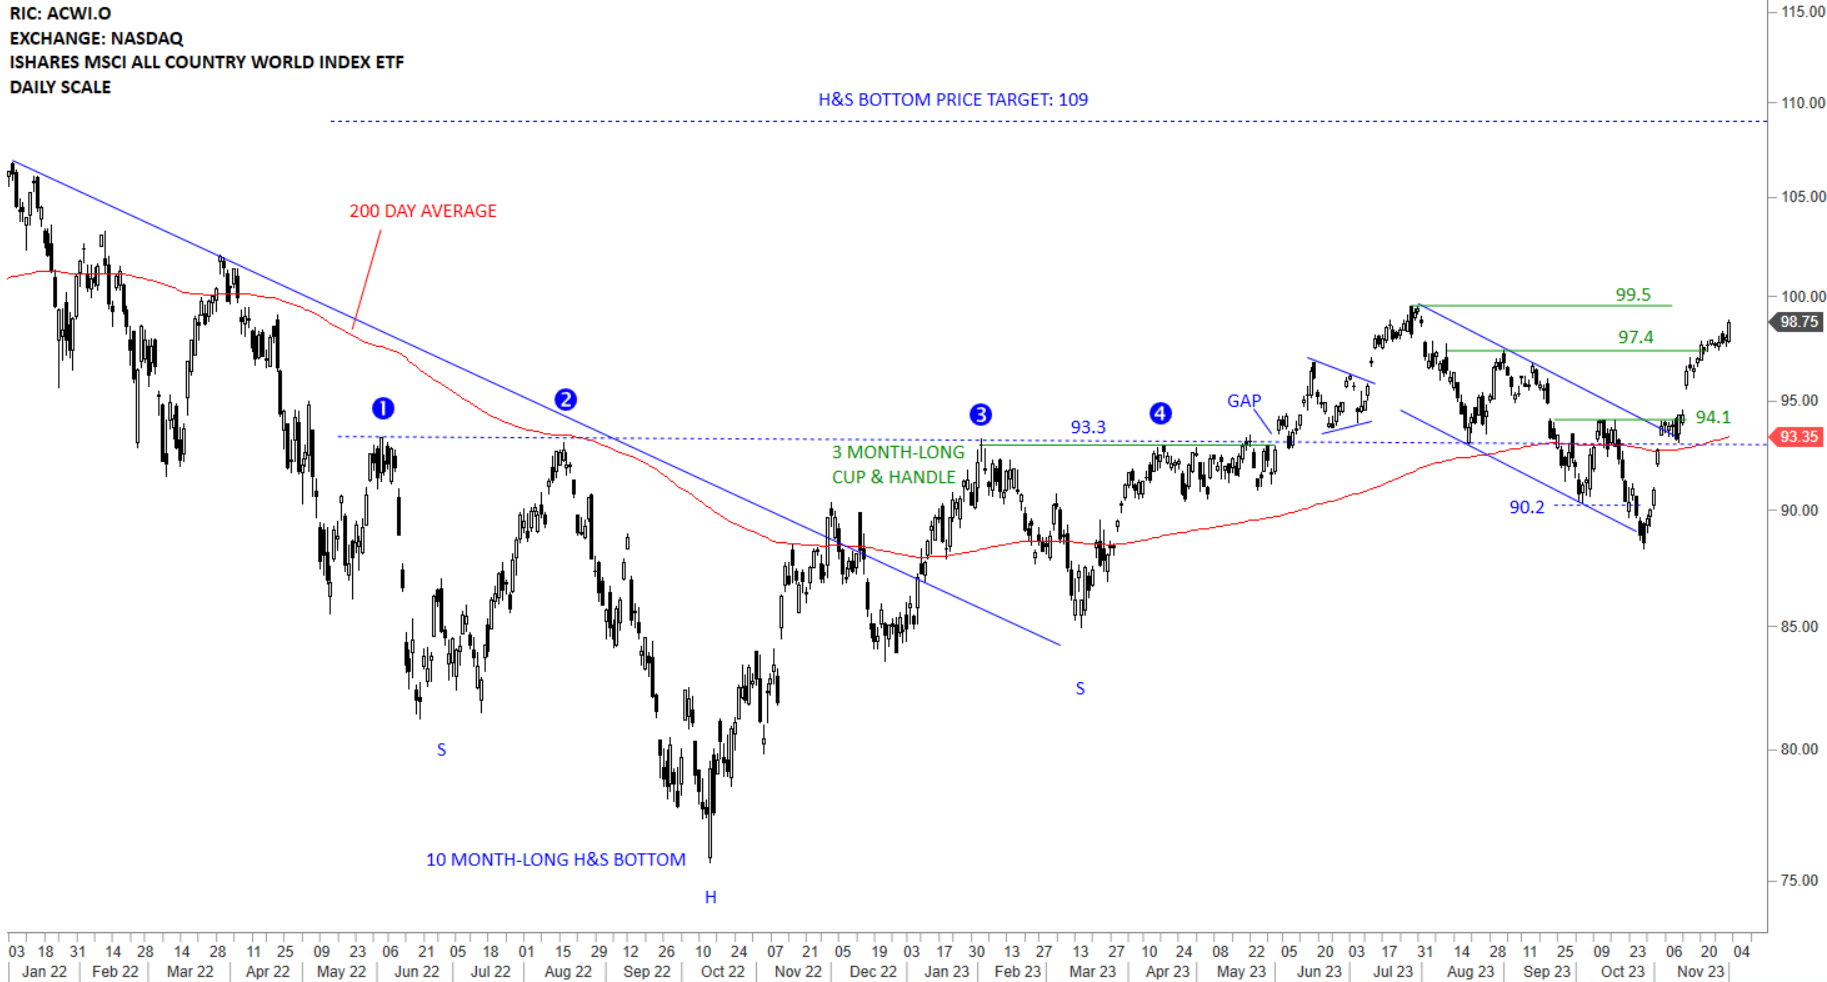
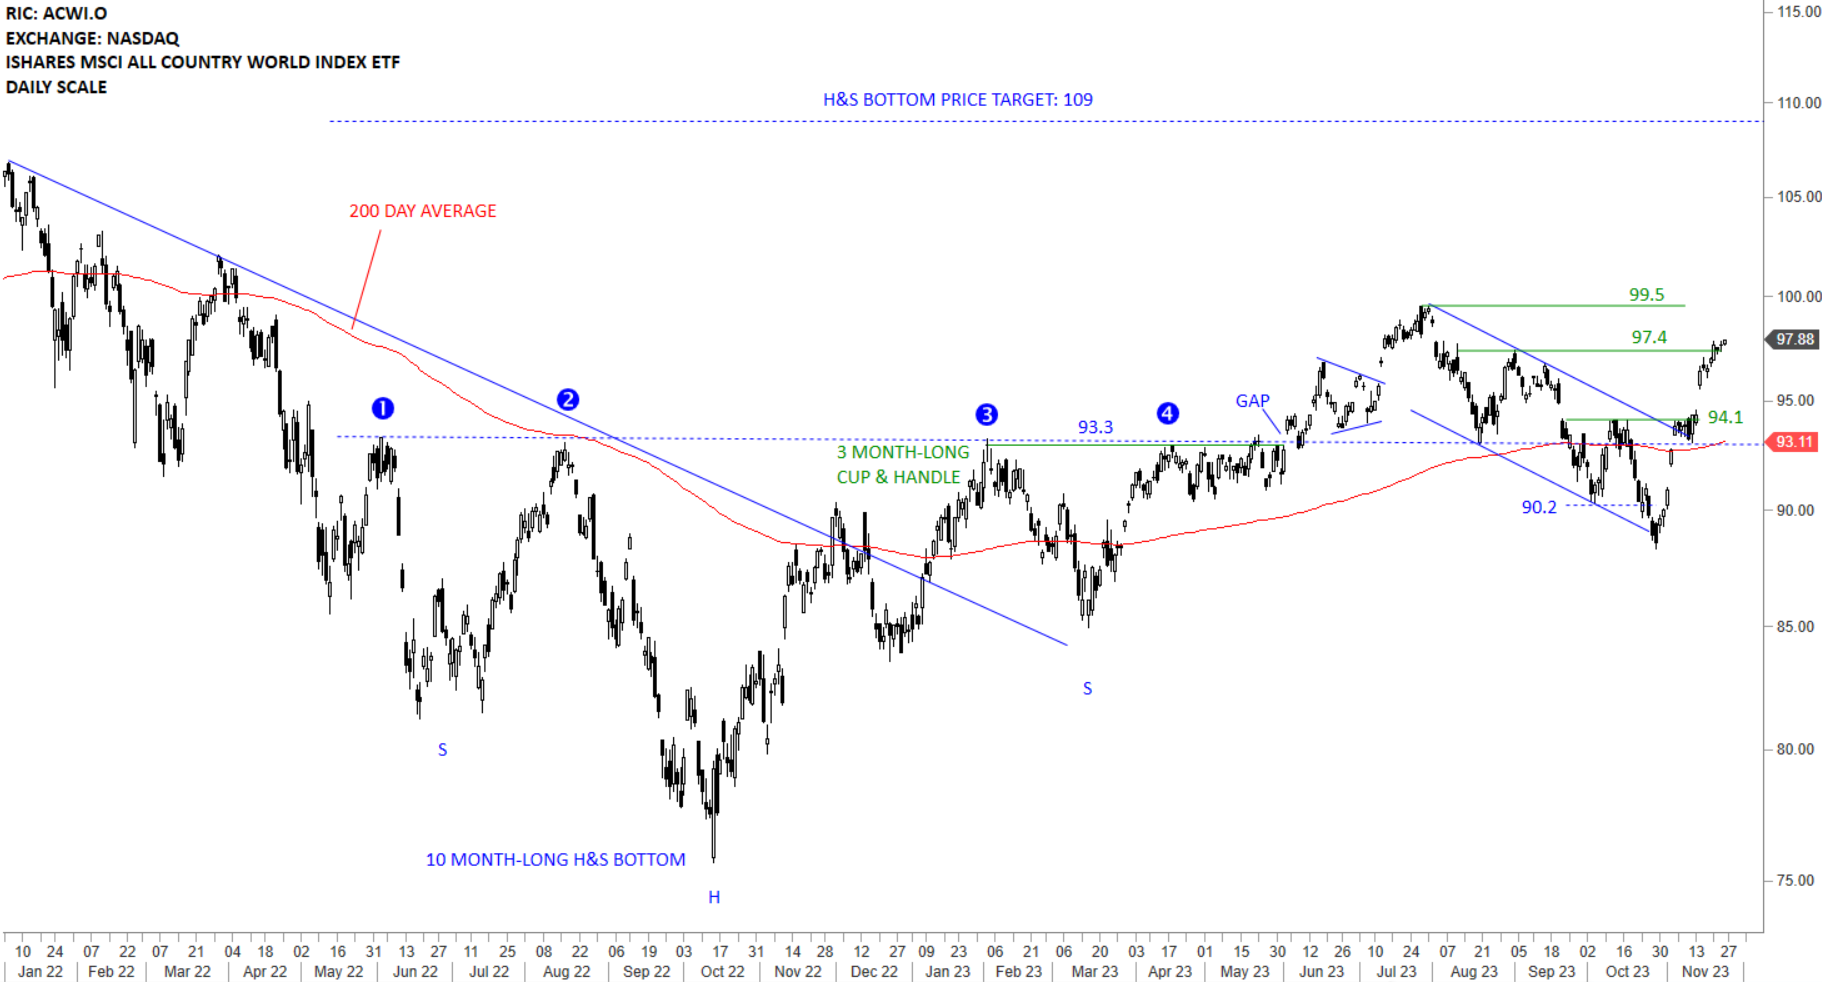
The benchmark for the Global equity markets performance, the iShares MSCI All Country World Index ETF (ACWI.O) cleared both minor resistances at 97.4 and 99.5 levels. The ETF is clearly above its 200-day average and in a steady uptrend. Long-term H&S bottom price target stands at 109 levels. Breakout above 99.5 levels is resuming the uptrend towards the H&S bottom price target at 109 levels. During recent pullback 99.5 levels acted as short-term support. 97.4-99.5 area is the strong short-term support area.