LIGHT CRUDE OIL

While analyzing charts I try not to look for any reasoning behind the chart pattern and demand & supply relationship. I trust that the market knows what it is doing and the underlying reasoning so I follow the technical signals on the price chart. Light Crude Oil is another chart that I analyzed with the same discipline but closely in the past 5 years because of my presence in the middle east. Now I’m hoping that the bullish outlook for crude oil is due to global growth prospects and not any political tension. But again I’m leaving the reasoning aside and trying to understand what the chart is telling me. So far Light Crude Oil had perfect technical set-ups, first forming a double bottom reversal pattern between August and October then a “possible” inverted head and shoulder pattern. Inverted H&S pattern should be called complex head and shoulder because the head is actually a double bottom.

After all the technical jargon above let’s summarize this chart; 200 day moving average acted as a strong support at $93 levels in December. Any pullback should find support above $93 to continue the positive technical outlook. Strong support = $93. If this is an inverted H&S pattern, then we should expect a breakout above the neckline at $103.50 levels. A breakout above $103.50 will confirm the inverted H&S pattern and will target $115-$120 area. Strong resistance = $103.50. So far it has been a strong market for the energy sector and the bullish outlook remains intact.

DAX INDEX

Though it hasn’t been a great year for equities and especially for European equities can 2012 start with a positive performance for Europe? In the past two months DAX formed a consolidation range (symmetrical triangle) below its 200-day moving average. We are likely to see  a breakout from the short/intermediate term consolidation range in the beginning of 2012. A breakout on the upside should be positive for DAX and would possibly challenge the 200 day moving average at 6,220 levels. Upper boundary of the consolidation range is at 6,000 and the lower boundary is at 5,750. Breakout in both direction should result in multi-month trend period for the index.

USD/CAD

U.S. dollar gained strength against major currencies in the last quarter of 2011. Will the strong performance of U.S. dollar continue in 2012? USD/CAD chart warns of a possible breakout in the beginning of 2012. 3 month-long symmetrical triangle shows consolidation of the currency pair but suggests a breakout is imminent. Given that the trend prior to the symmetrical triangle was upwards we can expect another strong trend on the upside. However, it is always better to wait for a confirmation. 1.04 levels is the strong resistance for the currency pair. If USD/CAD breaks above 1.04 level we should expect continued strength for the U.S. dollar. 1.003 level is the 200 day moving average and should act as strong intermediate/long-term support. A break below 1.003 level should reverse the bullish outlook for U.S. dollar and set the stage for further weakness in U.S. dollar.

S&P/CASE-SHILLER HOME PRICE INDEX

Source: S&P/Case-Shiller 

The S&P/Case-Shiller home price index tracks monthly changes in the value of residential real estate in 20 metropolitan regions across the U.S. The composite indexes and the regional indexes are seen by the markets as measuring changes in existing home prices and are based on single-family home re-sales. The key composite series tracked are for the expanded 20-city composite indexes.  The original series (still available) covered 10 cities. A national index is published quarterly. The indexes are based on single-family dwellings with two or more sales transactions. Condominiums and co-ops are excluded as is new construction. The latest data are reported with a two-month lag.

The two charts above show the S&P/Case-Shiller Home Price Index and the YoY change on the index. U.S. home prices fell ~1.2% respectively in October versus September, with 19 of 20 cities covered by the indices decreasing over the month. Year over year drops of the 10 and 20-City Composites fell -3.0% and -3.4% respectively versus October 2010.

Where do we go from here?

It is clear that the recovery in the housing market has been anemic and at best we have seen a stabilization but not a recovery or any sort of a sharp rebound. The index fell from 225 levels to 150 levels between 2007 and 2009 and recovered to 162 levels in 2010. In the same year YoY change moved to positive territory for the first time since 2007. However, in 2011 both the index and the YoY change failed to hold on to their recovery highs. S&P Case-Shiller Index fell back to 2009 lows and the YoY change fell back into negative territory.

We should closely watch two important levels on the home price index in 2012. 162 levels as resistance and 150 levels as support. A break above 162 levels can confirm the last 3 years stabilization as a base pattern and give a positive outlook for 2012-2014. A break below 150 levels can confirm the last 3 years stabilization as a continuation pattern and deepen the correction in the housing market.

YoY change should move above 0% to help the technical outlook to improve on the S&P/Case-Shiller Home Price Index.

EURO ZONE GOVT YIELDS


While U.S. markets are showing relative strength versus Emerging Markets and Euro Zone, we are seeing different performances between the euro zone economies. Back door QE by the European Central Bank helped Spain and France but Portugal, Italy and Greece 10 Year Govt. yields are still at elevated levels. Germany having the best technical outlook is followed by France. With Spanish yields falling from 6.8 levels to 5.2 levels changed the its outlook to neutral but 5 level is an important support for Spain 10 year yields. Greece, Italy and Portugal are still showing weakness. Greece should move below 32, Italy below 6.5 and Portugal below 12 levels to reduce the pressure on the Euro Zone. Looks like so far ECB move had limited impact on the Euro Zone yields.

EUR/USD

“Risk OFF” or “Risk ON” ? Is this a bear market or a bull market? Are we in a recession or not? Are we headed for a double-dip or not? When opinions are too divided like this and everyday people have a tendency to change their market outlook from negative to positive and vice versa, it is called a corrective period. During corrective periods, markets have tendency to move with wide swings and form choppy trading ranges. It is those type of periods that are most difficult to forecast. Trading ranges or consolidations are periods of disagreement while trending markets show consensus.

EUR/USD is in a long-term consolidation. It is a wide trading range between 1.50 and 1.20. However, in the long-term consolidation range short/intermediate term trend is down. With the latest breakdown below 1.3250 levels, EUR/USD breached a critical support that is likely to be the neckline of a H&S top. The top formation has still not been confirmed but our technical levels on the 3 year-long price chart suggest that there has been technical damage. EUR/USD should now push above 1.3250 to reverse the negative technical outlook. If it can move above 1.3250, we will expect the currency pair to trade between 1.3250 and 1.3750. Unless EUR/USD moves above the critical resistance at 1.3250, it is headed towards 1.20-1.25 area. Please note that EUR/USD is below the 200 day moving average and has major resistances ahead. Weak technical outlook could persist.

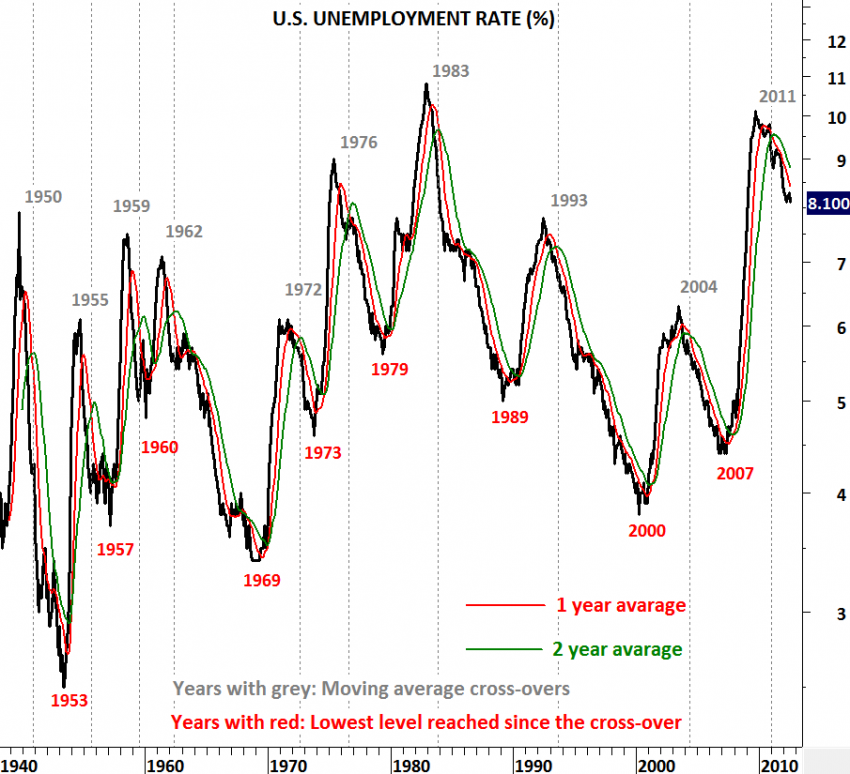
U.S. Unemployment Rate (%)

In August I analyzed the U.S. unemployment rate from a technical perspective. Technical analysts (Chartists), look at pure price information and analyze directional movement. In doing so, they use different technical indicators. Here I’m using 1&2 year moving averages to identify cross-overs. Unemployment in U.S. has peaked around 10% in October 2009 and since then it has fallen towards 8.6%. Moving average cross-over in the beginning of 2011 signaled improving job market for U.S. If we analyze past data we can see that every cross-over was followed by better employment figures for at least one year after the technical signal. Given that the cross-over signal was generated in the beginning of 2011 we can expect better figures in 2012.

CHINA SSE 50 INDEX

If stock markets are discounting mechanisms, China’s SSE 50 index is not giving us positive signals for the chinese economy and possibly for the global growth. At a time when almost everyone is expecting China to lead the global growth and help the rest of the world, weak stock market performance is telling the opposite… that China might be facing more trouble. SSE 50 index has been falling below its 200 day moving average and lately confirmed its downtrend by breaking below its 2010 low levels at 1,780. RSI has clearly established its move below 50 levels (a sign of a bear market). Lower lows and lower highs has formed a medium-term trend channel and the lower boundary of the trend channel is between 1,450 and 1,500. Expect further weakness in the Chinese stock exchange and  the index to reach the lower boundary of its medium term trend channel.

GOLDMAN SACHS COMMODITY INDEX

When all the commodities experience sharp sell-off, this is reflected on the major commodity indices. One of the widely used commodity index is the Goldman Sachs Commodity Index. The weight of energy products in the index is higher when compared with the Reuters/Jefferies CRB Index. As a result changes in Crude Oil price has a larger impact on the technical outlook for the GSCI. Yes, we have seen agricultural commodities and industrial metals weakening in the past few months but Light Crude Oil’s sharp correction in the past few days brought GSCI clearly below its 200 day moving average. Lower lows and lower highs define the medium-term downtrend and before Goldman Sachs Commodity Index moves back above 650-670 area stay bearish on commodities.

US DOLLAR vs. BRAZILIAN REAL (USDBRL)

Strength in U.S. dollar and weakness in global equities and commodities has been the theme for the past few months. U.S. dollar strength can be seen not only against Euro but against several emerging and developed market currencies. Technical chart patterns are extremely bullish for the dollar. One of those bullish patterns is the inverted head and shoulder on USDBRL. 2 year-long base formation has almost completed with the neckline (last intermediate term resistance) for the bullish chart pattern standing at 1.92 levels. A confirmed breakout above 1.92 levels will target 2.45 levels in the intermediate term. This chart shows weakness for Brazilian Real and strength for the U.S. dollar.