Tech Charts Year in Review with Aksel – May 2020

Tech Charts Year in Review – Year Three

  • A study on Chart Pattern Reliability with the available sample data over the past year
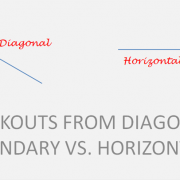
  • Chart patterns with horizontal boundaries have been more reliable compared with breakouts from chart patterns with diagonal boundaries
  • Long-term trends impact the number of bullish and bearish chart pattern setups and breakout opportunities
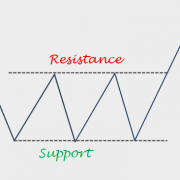
  • H&S tops, H&S bottoms and descending triangles have been reliable with breakouts from well-defined horizontal boundaries
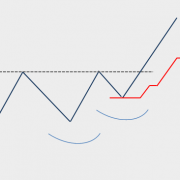
  • Developing breakout opportunities
  • Live Q&A
Member Questions
  1. When analyzing charts for possible trading opportunities, do you use good liquidity in the market as a trade filter, and what method do you use to determine good liquidity? 1:00:17
  2. It will be nice if the performance of chart alerts can be tracked in an excel sheet. 1:01:42
  3. How often do you trade personally? Did you trade all of the patterns summarized in the "Phases of market trends" slide? 1:02:19
  4. I understand you don't like to use volume, however in technical-analysis-and-stock-market, Richard talks a lot about high volume on upward breakouts, can you explain why you don't use this at least for breakouts? 1:03:15 (LINK: VOLUME AS A CONFIRMING INDICATOR)
  5. Can you talk about how you place stop losses after entering a position? 1:05:58 (LINKS: Breakout with a pullback – Application of ATR trailing stop-loss and ATR Trailing Stop-Loss – H&S Top)
  6. Do you ever look at charts adjusting for dividends? 1:06:32
  7. The statistics on page 7 - does Aksel include failure signals? Such as H&S failure, cup & handle failure, or even asc. des. triangle failures (breaking out of the diagonal line)? 1:07:11 (LINK: Head and Shoulders Top – Failure)
  8. Why do you ignore wedges? You mentioned this on slide 7; I just wanted to understand your reasons. 1:08:12 (LINK: DIAGONAL BOUNDARIES ARE LESS RELIABLE)
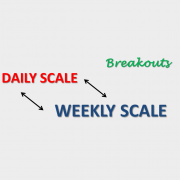
  9. Slide 9 - Can you repeat your MAs for weekly and daily timeframes? 1:10:22
  10. Slide 8 - Can you explain how you set your 'pattern failure' level? 1:10:35
  11. Your charts are mostly weekly - does it mean you disregard shorter timeframe formations? If yes, why? 1:11:35
  12. Your H&S examples are all with horizontal shoulders - what is your view of inclined H&S? 1:12:18
  13. Is it true some stocks follow classical patterns better than others over a long period of time? Hence if we find those names, we should follow them long term even if a chart finished this target/negation? 1:13:06
  14. It would be extremely useful to add to the statistics the average ratio between target and negation levels with respect to the breakout level (sort of profit/loss), per pattern type. 1:14:19
  15. Have you ever used a pullback strategy? It seems quite popular for some traders, what % of traders do you think are doing this? 1:14:34
  16. Do you recommend using different stop strategy in terms of the pattern length? i.e., weekly ATR stop if pattern > 12 month, daily ATR stop if the pattern is 4 - 26 weeks. 1:15:24
  17. Page 20, the symm. triangle, do you usually place negation level at the apex of the triangle because E&M book suggests that's a strong support? 1:16:26
  18. Could you show us a breakdown of BreakOut success/failure statistics by Exchanges (or Countries, currencies)? It is relevant to those who do not trade signals in all exchanges/countries. 1:16:51
  19. Are there national markets that demonstrate less emphasis on chart patterns? i.e., heavier % of "fundamental investors"? 1:17:25
  20. Sometimes, you do not plot the 200MA, is there any particular reason? Besides 200d MA, do you use any other MA? 1:18:19
  21. Are you ever concerned with how extended the minor advance is in a stock prior to the breakout? FDN for example bounced straight from the lower boundary; do we have to be careful of profit-taking? 1:18:53
  22. How do you identify the price for horizontal and diagonal boundaries? 1:19:37
  23. I loved to see the slide of statistics - are there more studies available on the website? (Maybe also compared to different observed timeframes?) 1:19:58
  24. How do you treat spindles crossing the chart boundary during the weekly or daily chart development? Do you use a lower time frame to negate the false breakouts? 1:20:23
  25. In terms of timing, what is the time horizon you usually see breakouts playing out? 1:20:58
  26. How do you balance the initial stop loss positioning between chart pattern boundary and chart negation point to balance the position sizing and the risk as basis points in relation to the market volatility? 1:21:40
  27. Between log scale and linear scale, which one is better? 1:22:14
  28. For double tops-bottoms or H&Ss, is there a limit on the percentage (such as 3%) between highs and lows on double tops-bottoms or between right and left shoulders? 1:23:17
Read More

Breakout with a pullback – Application of ATR trailing stop-loss

This content is for members only

4 Types of Breakouts – March 2020 Tech Charts Webinar

4 Types of Breakouts - March 2020 Tech Charts Webinar

We are continuing our Member webinar series with a review of 4 types of breakouts. 

Type 1 are breakouts that immediately rally to price target. Type 2 are breakouts that pullback to chart pattern boundary after the breakout but do not challenge the previously broken support/resistance. These two breakouts are relatively easier to manage when compared with the breakouts that experience a hard re-test (penetrating the chart pattern boundary after a breakout) and those that fail (Type 3 & Type 4).

We will review all 4 types of breakouts with recent examples and discuss strategies to manage each condition.

Webinar Outline
  • We will review some of those chart pattern breakouts that rally to their price objective without any pullback
  • We will review some of the breakouts that complete an orderly pullback to chart pattern boundary
  • We will look at some of the breakouts that experience hard re-test and challenge chart pattern boundaries
  • We will review some of the breakouts that failed off of the starting gate.
  • We will have a member Q&A at the end of the webinar.
Live questions from Members  
  1. I know you're a classical market technician, but with such a severe one-sided breakdown, are you ever tempted to trade something for a pullback even though you don't have a classical pattern? 36:21
  2. Does the speed with which a pattern breakout achieves the target price indicate that you should let the trade run? 37:24
  3. Can you find signs in the chart that could indicate what type of breakout is going to occur? 38:02
  4. Do you reduce your position sizing (i.e., instead of 1% risk per trade, 0.50% risk) during extended volatility like we're seeing? 39:42
  5. Can you explain how to calculate the trailing stop loss again? 40:10
    1. Additional links ATR Trailing Stop-Loss – H&S Top & ATR plug-in
  6. How do you incorporate sentiment measures (COT DSI etc.) into your decision making? 40:48  
  7. Do you think that in market conditions such as these, the probability of a failed chart occurring is higher? 41:02
  8. Do you ever circumvent your ATR trailing stop and place it below a newly formed chart pattern negation level that's above the initial entry position? 42:32
  9. I noticed that on one trade, you placed an SL at the bottom of a gap, but on another, you placed it at the top of a GAP. Do you have rules for deciding this? 43:50
  10. Is it possible to use this method for long term investing? If yes, would you use the same trailing method? 45:13
  11. Can the ATR stop rule be implemented in a trading platform? 46:19
  12. How do you determine your ATR length and multiplier number? Is it historical chart based and specific to a specific chart? Are commodities different than stock charts? 47:13
  13. As volatility during the day can be larger, have you used one ATR multiple for intra-bar & a lesser ATR multiple near the close, whereby one cancels the other OCO? 49:20
  14. Over the years, the ratio between reversal patterns vs. continuation patterns? Do you cap that ratio, or you let the patterns dictate what you have currently? 50:08
  15. Do you always trade long? Never short? 51:13
Recorded live 03.26.2020    Read More

DIAGONAL VS. HORIZONTAL BREAKOUTS

This content is for members only

Short-Term Chart Patterns – December 2019 Tech Charts Webinar

Short-Term Chart Patterns - December 2019 Tech Charts Webinar This webinar is a discussion on chart patterns that develop and complete on a short-term time frame, in the duration between 1 month to 3 months. Webinar Outline
  • We will review some of those chart pattern breakouts that were featured in the Global Equity Markets report
  • We will review some of the conditions that are required for successful completion of different chart patterns both on daily and weekly time frame
  • We will look at some of the developing chart patterns
  • We will have a member Q&A at the end of the webinar
Live questions from Members  
  1. Do you use MA or EMA? 50:33
  2. I wanted to check if it is possible for you to include in your weekly report a performance of setup of your charts? 51:02 (Webinar mentioned A review of the most reliable chart patterns Tech Charts Global Equity Markets report featured over the past two years – September 2019 Tech Charts Webinar)
  3. Can the ascending or descending triangle be trend reversal patterns? 51:37
  4. Can you discuss success rates for weekly setups vs. daily? 52:37
  5. If the handle is a bit above the cup is the breakout level above the cup or above the handle? 53:48
  6. When you post a breakout alert on the website, is the red number dotted line a negation level or your initial stop loss? 54:17
  7. What's the ATR setting you use and do you check and adjust stops on a daily basis? 54:45 (Helpful link ATR Trailing Stop-Loss – H&S Top)
Recorded live 12.12.2019      Read More

A review of the most reliable chart patterns Tech Charts Global Equity Markets report featured over the past two years – September 2019 Tech Charts Webinar

A review of the most reliable chart patterns Tech Charts Global Equity Markets report featured over the past two years - September 2019 Tech Charts Webinar Webinar Outline
  • We will review some of those chart pattern breakouts that were featured in the Global Equity Markets report 
  • We will review some of the conditions that are required for successful completion of different chart patterns 
  • We will look at some of the developing bullish continuation chart patterns 
  • We will continue to highlight Tech Charts members favorite chart pattern setups in different equity markets
  • We will have a member Q&A at the end of the webinar
Live questions from Members  
  1. On triangle breakouts, how important do you feel it is to clear the last pivot point (as opposed to buying the breakout immediately) before enter ing a trade? 1:07:49
  2. Could you please comment the HUI or GDX graph? 1:08:30
  3. You have been using SSE50 to analyze China. May I suggest including or start using A50? The reason is apparently the futures contracts trading on SGX. Or, is there a leveraged way to trade SSE50 other than CFD? 1:09:15
  4. Slide 2 - Is the moving average simple, exponential, or something else? 1:09:52
  5. Can you start posting the slides with the member webinar on the member site? It would be very helpful. 1:10:52
  6. H&S bottom reversal: it looks like from the examples that the downtrend line would be breached, retested and form the right shoulder and then breakout. The question, would it be advisable to take position after right shoulder(retest of the down trend line)? 1:11:09
  7. When a H&S has a neckline that is slanted left or right, to which point do you trade? 1:12:08
  8. Why three times 10-period ATR? Is it from experience, is this the best setting for Aksel's time frame? 1:13:02
  9. Broadening triangle - It's probably not worth taking a position but when a flat top broadening triangle forms in the downtrend, is there a bias? Example Canada government bond 2-year rate. Flat top broadening triangle formed from March, in the middle of the downtrend. 1:14:30
  10. How do you answer something like this: "I never thought buying breakouts was a good way to trade. Takes so many buyer s to get a stock through resistance. You don't wanna be buying AFTER that...Pullbacks after the breakout or ahead of a breakout only for me.” 1:15:32
  11. When a premature breakout happens, and the stop is hit, if the breakout happens again, would you take the signal again? If yes, do you change the position size if the risk is lower this time (pivot closer to breakout level)? 1:16:47
  12. Have you calculated which patterns tend to assume which roles: continuation vs. reversal? 1:17:37
  13. Is there any suggestion, other than using the correlation table, which breakout signals to select from because you highlight many and they all look pretty good. 1:18:32
  14. What does on a daily closing basis mean - example when saying, “That the 3%-breakout-confirmation has to happen on a daily closing basis?” 1:19:14
Recorded live 9.15.2019    Read More

Inverse Head & Shoulder and Head & Shoulder Continuation – April 2019 Tech Charts Webinar

Inverse Head & Shoulder and Head & Shoulder Continuation - April 2019 Tech Charts Webinar
  • We will review some of those chart pattern breakouts that were featured in the Global Equity Markets report.
  • We will review some of the qualities we look for when identifying and differentiating H&S bottom and H&S continuation
  • We will look at some of the developing bullish continuation chart patterns
  • We will continue to highlight Tech Charts members favorite chart pattern setups in different equity markets.
  • Live questions from Members
Live questions from Members  
  1. Can we look at palladium, does recent price action indicate a topping pattern? 47:03
  2. Any thoughts on CVS? 48:07
  3. Can you talk about 285 in HK? My question is — the last nights close is 3% above the boundary, but it's also a candle with big upper wick. How do you handle an entry like this? 48:24
  4. Could you please address where you place stop losses? Do you use trailing stops? If so, how? 50:00 Link mentioned ATR Trailing Stop-Loss – H&S Top
  5. Peter seems to use just about any dipping movement as a right shoulder. Do you have conditions, strict or otherwise, as what counts as a valid right shoulder? 50:33
  6. In the continuation pattern, if we compare H&S to cup and handle, which one has better success rate in your experience? 51:46 
  7. Do you have any statistics as to the percentage of times H&S continuation patterns work? 53:35
  8. In H&S continuation pattern, do you ignore 200 Day MA totally? Some of them I noticed are really far above the long term moving average. Is that a concern? 54:49
  9. Do you regard H&S failure patterns as a valid tradeable pattern? 55:42
  10. With Peter Brandt’s retirement announced (April 2020), can you consider covering futures and commodities? Please. 56:59 
  11. While you are drawing boundary lines are you relaying more on candlestick close or candlestick high (on body or on wick)?  Is this discretionary and changes on pattern to pattern basis? Do you have some kind of method behind how you draw boundaries? 57:26
  12. When after breakout, a pullback below boundary, how long do you stick with it? All the way to failure point? Half way there? Do you study what % recover from a deep pullback below breakout? 58:40 
  13. Does pairs (ratio) charts can be followed and traded using the same classical patterns outlined here? 1:00:36
  14. Can you buy Singapore and Spanish indices via ETF? Futures? 1:01:33
  15. 200 Moving Average on your charts is 200 period Exponential Moving Average? Always 200 periods (200 weeks on weekly and 200 days on daily) or always 200 DAYS EMA on every timeframe? 1:02:21 
  16. Do you verify LT moving average on daily chart? Are you using the 200MA on daily chart 1:02:57 Link mentioned Moving Averages
  17. Could you discuss the significance of the divergence between SPX and the Russell 2000 - negative divergence (Russell underperforming)? 1:03:38
  18. Observations on RCI H&S setup? 1:04:52
  19. Do you have any observations on the use of options as a tactic to trade breakouts? 1:05:31
  20. By "Moving Average" is that the Simple Moving Average, or something else?1:05:44 Link mentioned Moving Averages
Recorded live 4.18.2019    Read More

Moving Averages

This content is for members only