
VOLUME AS A CONFIRMING INDICATOR
Volume is an important indicator that can be used to confirm certain price movement. It is always positive to see increasing volume when a stock is advancing. An advance on expanding volume is deemed more robust than an advance on contracting volume. Likewise, it is good to see an increase in volume during a breakout from a lengthy consolidation range.
Another way to use volume indicator is to confirm price action at market tops and bottoms. After a sharp sell-off, a spike in volume is usually considered a selling climax and suggests a possible bottom. If consecutive attempts to reach new highs are accompanied by lower volume it is usually considered a non-confirmation and forecasts a possible trend reversal.
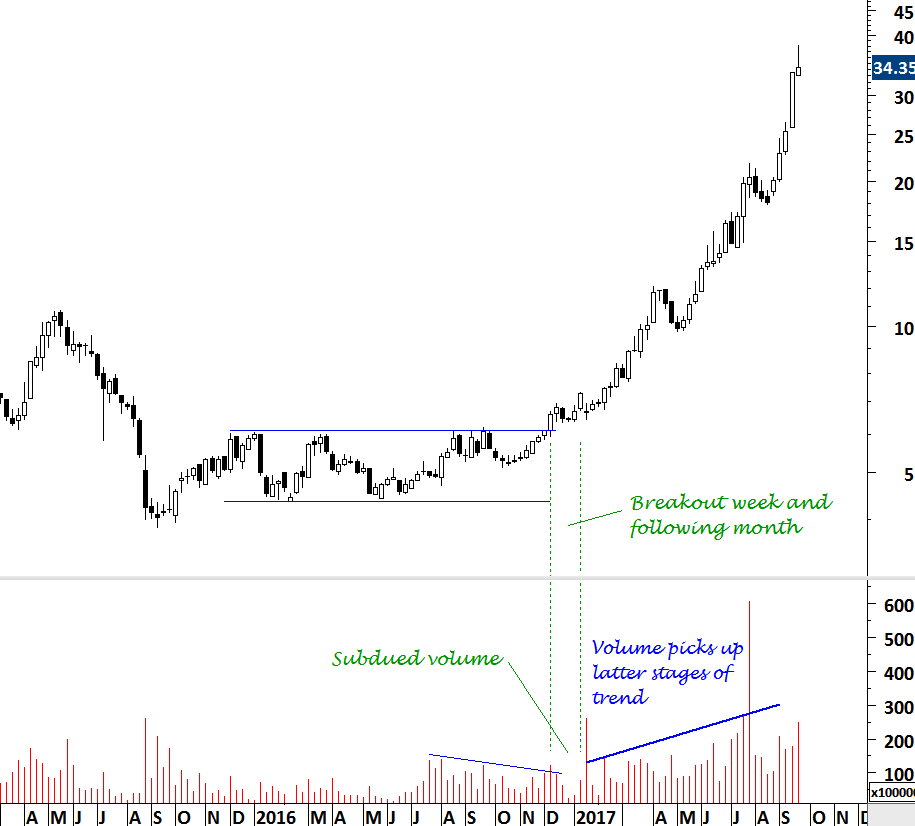
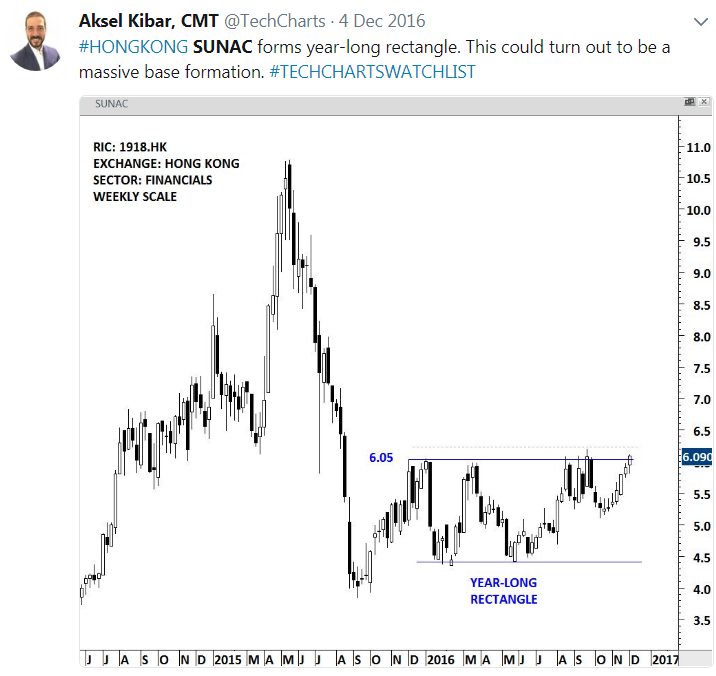
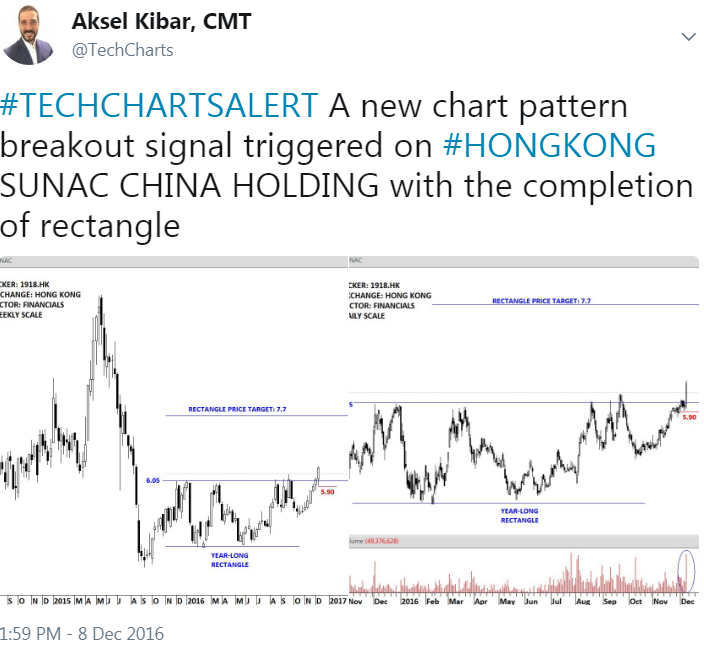
I classify volume indicator as “good to have”. It is “good” to see an increase in volume during a breakout. However, it is not a “must”. A breakout from a well-defined lengthy trading range can take place with low or “average” volume. This should not put the breakout in question. It is possible for the volume to pick up at the latter stages of the uptrend. Ignoring a genuine breakout because of low volumes can result in a missed opportunity. Below is a great example studying the volume pattern during a major breakout that took place on SUNAC CHINA HOLDING. Price completed a year-long rectangle with a strong breakout. Given the length of the consolidation and the magnitude of the breakout, the volume at the breakout and the weeks following the breakout was not significant. Only after the trend accelerated in the first part of 2017 that the volume started increasing. This is only one example and can’t be generalized for all breakouts. However, it is a good case study highlighting the importance of price action as the leading indicator.
Here is what I was focusing on at the time of chart pattern development and breakout
Tech Charts Membership

By becoming a Premium Member, you’ll be able to improve your knowledge of the principles of classical charting.
With this knowledge, you can merge them with your investing system. In fact, some investors use my analyses to modify their existing style to invest more efficiently and successfully.

As a Premium Member of Aksel Kibar’s Tech Charts,
You will receive:
-
Global Equities Report. Delivered weekly.
-
Classical charting principles. Learn patterns and setups.
-
Actionable information. Worldwide indices and stocks of interest.
-
Risk management advice. The important trading points of each chart.
-
Information on breakout opportunities. Identify the ones you want to take action on.
-
Video tutorials. How patterns form and why they succeed or fail.
-
Watch list alerts. As they become available so you can act quickly.
-
Breakout alerts. Usually once a week.
-
Access to everything (now and as it becomes available)o Reports
o Videos and video series -
Multi-part webinar course. You learn the 8 most common charting principles.
-
Webinars. Actionable and timely advice on breaking out chart patterns.
For your convenience your membership auto renews each year.


