Posts

GLOBAL EQUITY MARKETS – February 2, 2019

REVIEW


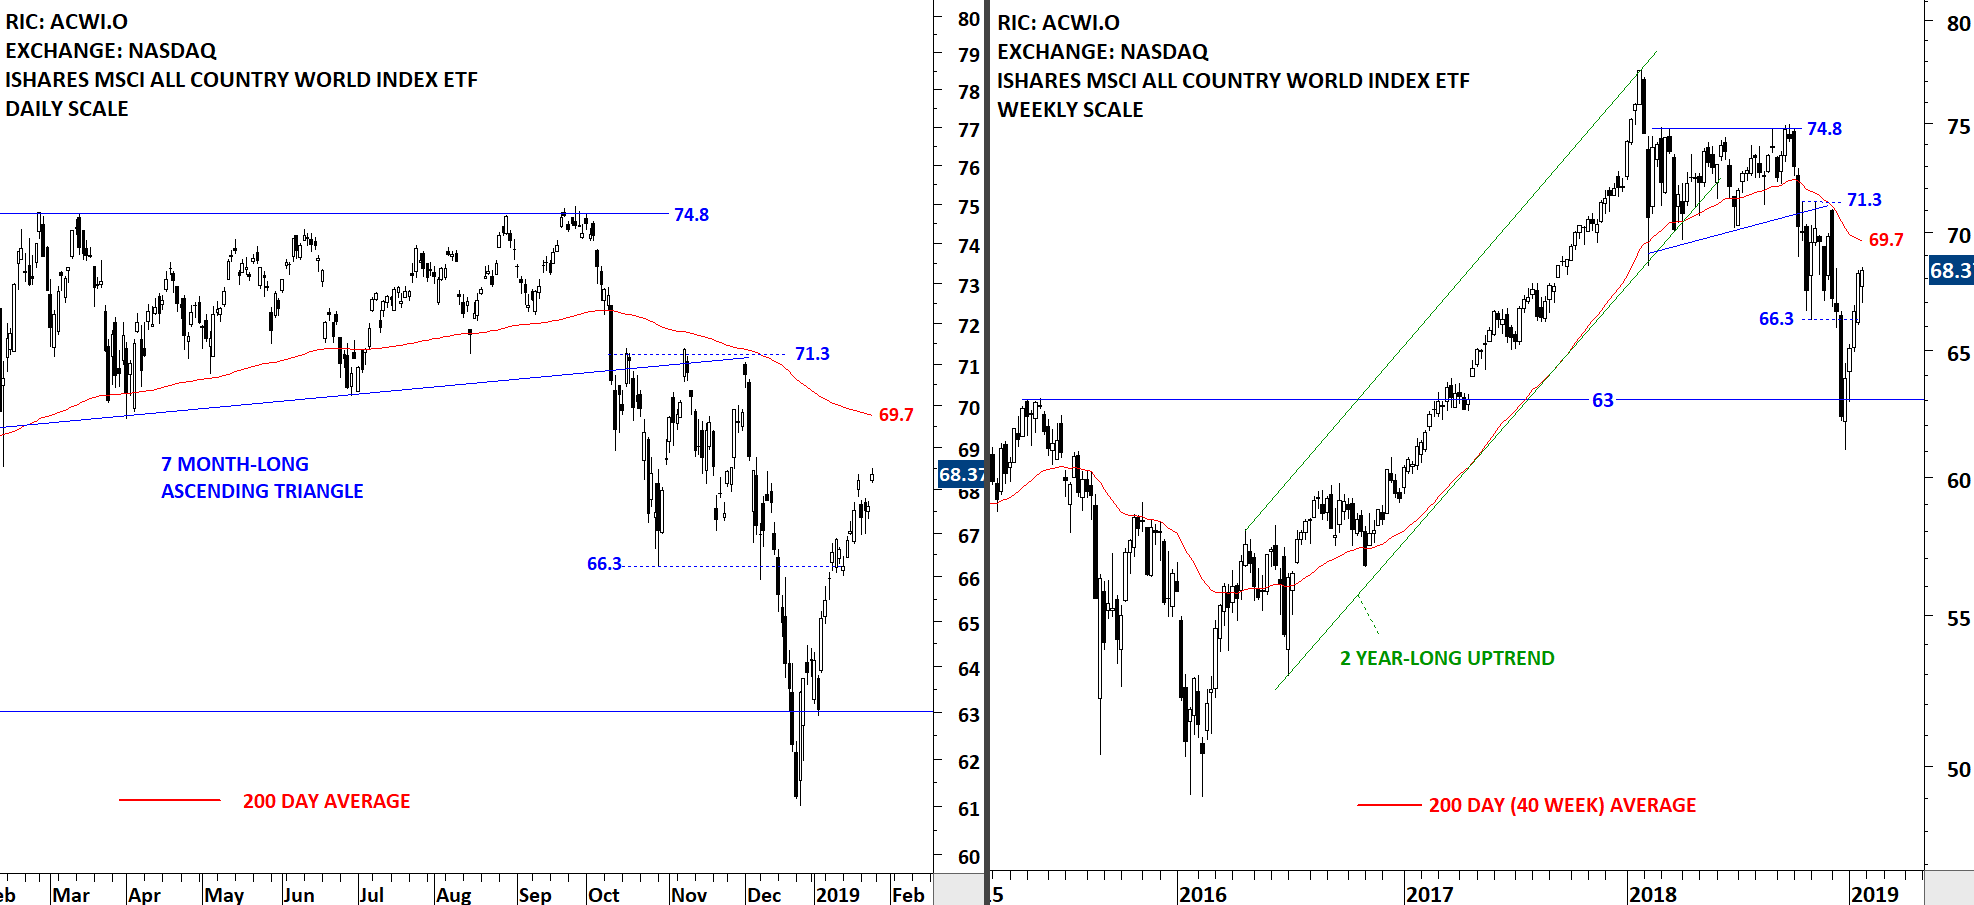
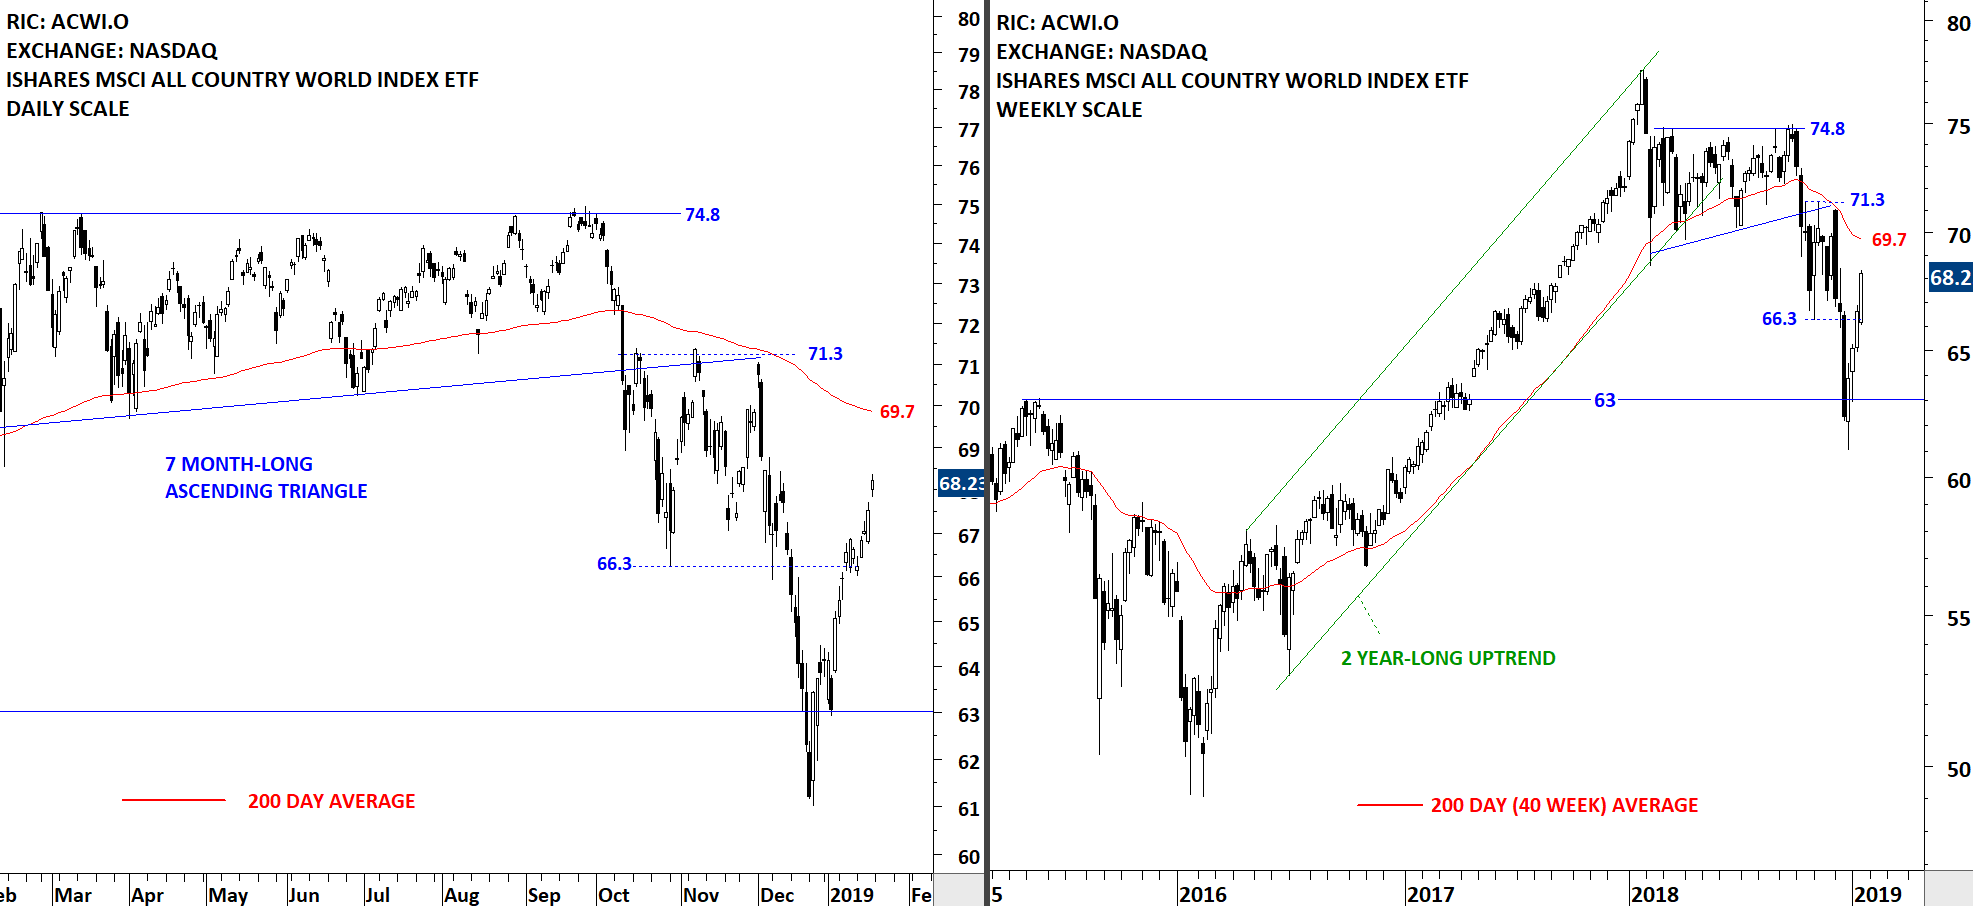
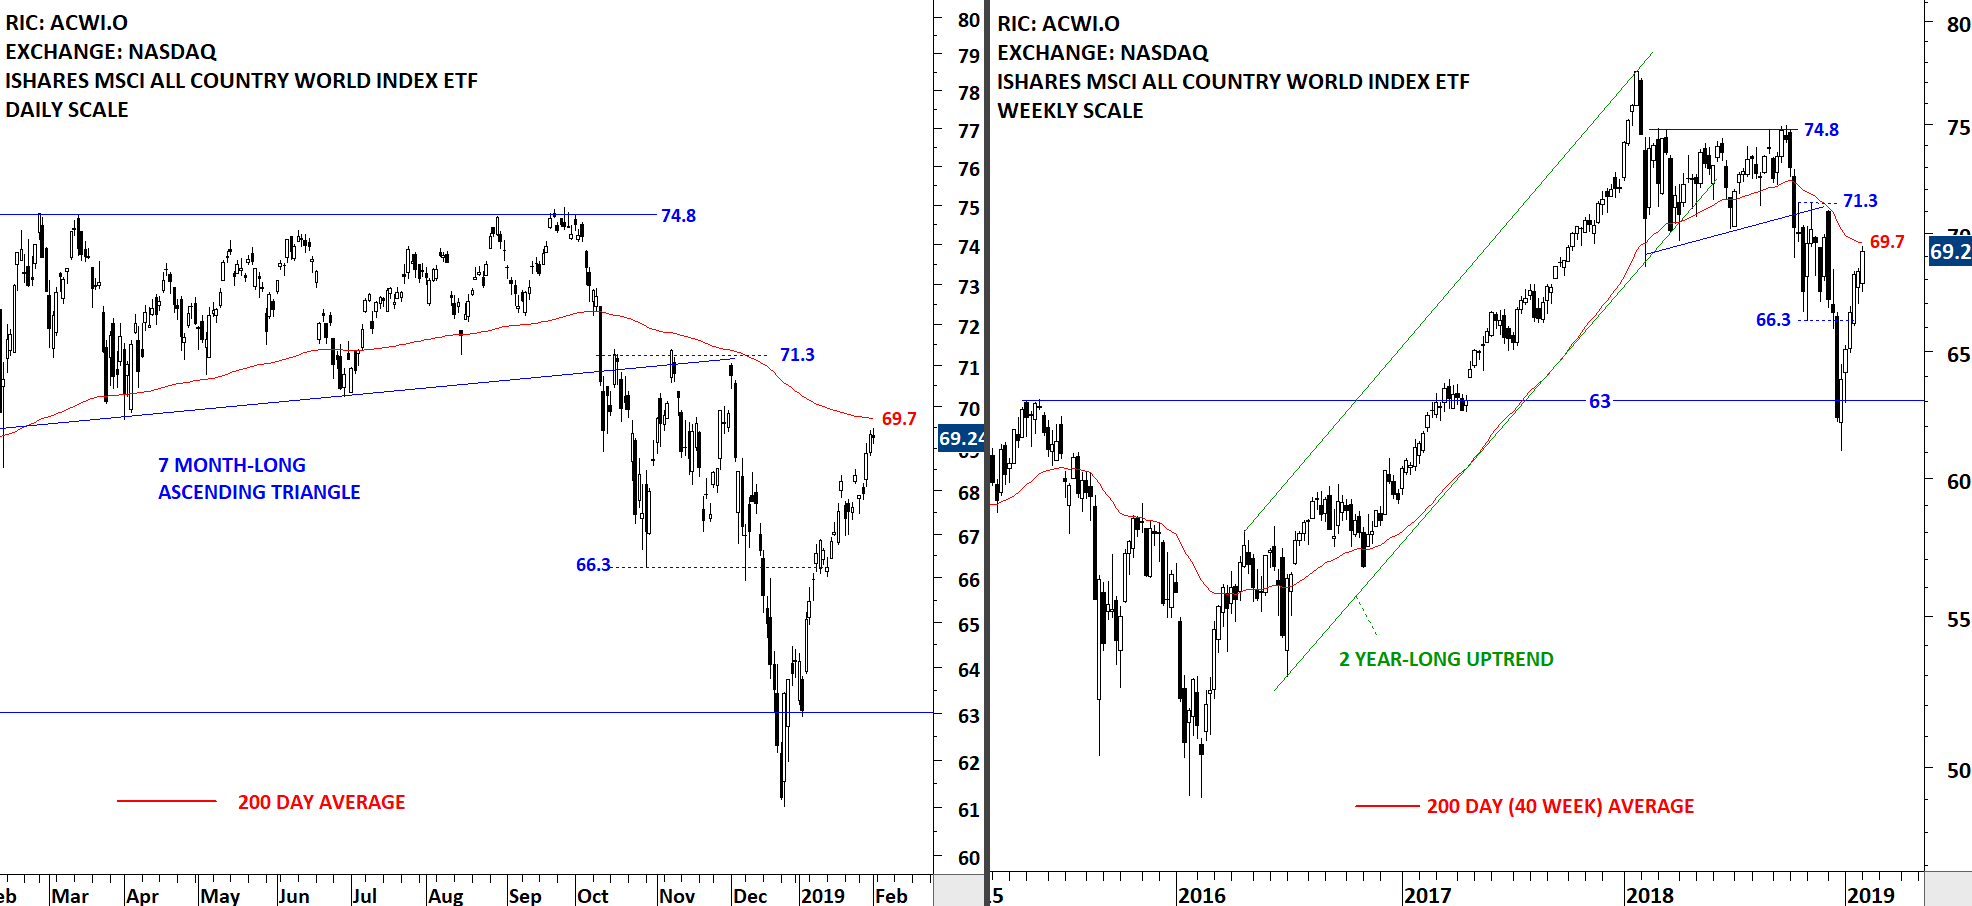
The benchmark for the Global Equity markets performance, the iShares MSCI All Country World Index ETF (ACWI.O) reached its 200-day moving average after a strong rebound from the support at 63 levels. Back to back weekly gains pushed the index towards the resistance level I follow and utilize as a trend filter. I consider price action above the long-term average as strong and expect higher levels. Price action below the long-term average shows weakness and can become part of a larger scale downtrend. Both daily and weekly scale price chart for the ACWI ETF hasn't provided a well-defined chart pattern.

Read More

GLOBAL EQUITY MARKETS – January 26, 2019

REVIEW


The benchmark for Global equity markets performance, iShares MSCI All Country World Index ETF (ACWI.O) had a strong rebound from the support level at 63 levels. V-reversal pushed the ETF towards its long-term moving average at 69.7 levels. In the last quarter of 2018, the ETF broke down its 7 month-long consolidation and started a corrective period. Over the past 5 weeks the ETF had back to back gains that recovered most of December 2018 losses without any pullback. Latest rebound might be due for a short pullback. I will be looking for bullish chart pattern developments to find low risk entry points.

Friday's price action was a gap opening. Below I analyze two gap openings on the iShares MSCI Emerging Markets ETF (EEM) and the iShares MSCI All Country World Index ETF (ACWI.O).

Read More

GLOBAL EQUITY MARKETS – January 19, 2019

REVIEW


The iShares MSCI All Country World Index ETF, a measure of Global equity markets performance, had a sharp rebound from the support level at 63. V-bottom reversals are difficult to analyze and trade. If we have seen a V bottom and the ETF keeps climbing higher in the following weeks, I will wait for the price to stabilize around the long-term average. During any pullback I will monitor this ETF for short/medium-term bullish continuation chart pattern developments. Long-term 200-day moving average stands at 69.7 levels.

Read More

INTERIM UPDATE – January 17, 2019

I have been preparing some bullish chart pattern setups to be featured in the weekly Global Equity Markets report on the 19th of January. However, a positive news on China & U.S. trade talks is likely to move some of those names in the last trading day of the week. I thought it is important to be prepared for such breakouts (if they take place). Below are the stocks that are listed on China/Hong Kong exchanges with potential bullish setups.

Read More

VOLUME AS A CONFIRMING INDICATOR

Volume is an important indicator that can be used to confirm certain price movement. It is always positive to see increasing volume when a stock is advancing. An advance on expanding volume is deemed more robust than an advance on contracting volume. Likewise, it is good to see an increase in volume during a breakout from a lengthy consolidation range.

Another way to use volume indicator is to confirm price action at market tops and bottoms. After a sharp sell-off, a spike in volume is usually considered a selling climax and suggests a possible bottom. If consecutive attempts to reach new highs are accompanied by lower volume it is usually considered a non-confirmation and forecasts a possible trend reversal.

Read More