Inverse Head & Shoulder and Head & Shoulder Continuation – April 2019 Tech Charts Webinar
Inverse Head & Shoulder and Head & Shoulder Continuation - April 2019 Tech Charts Webinar
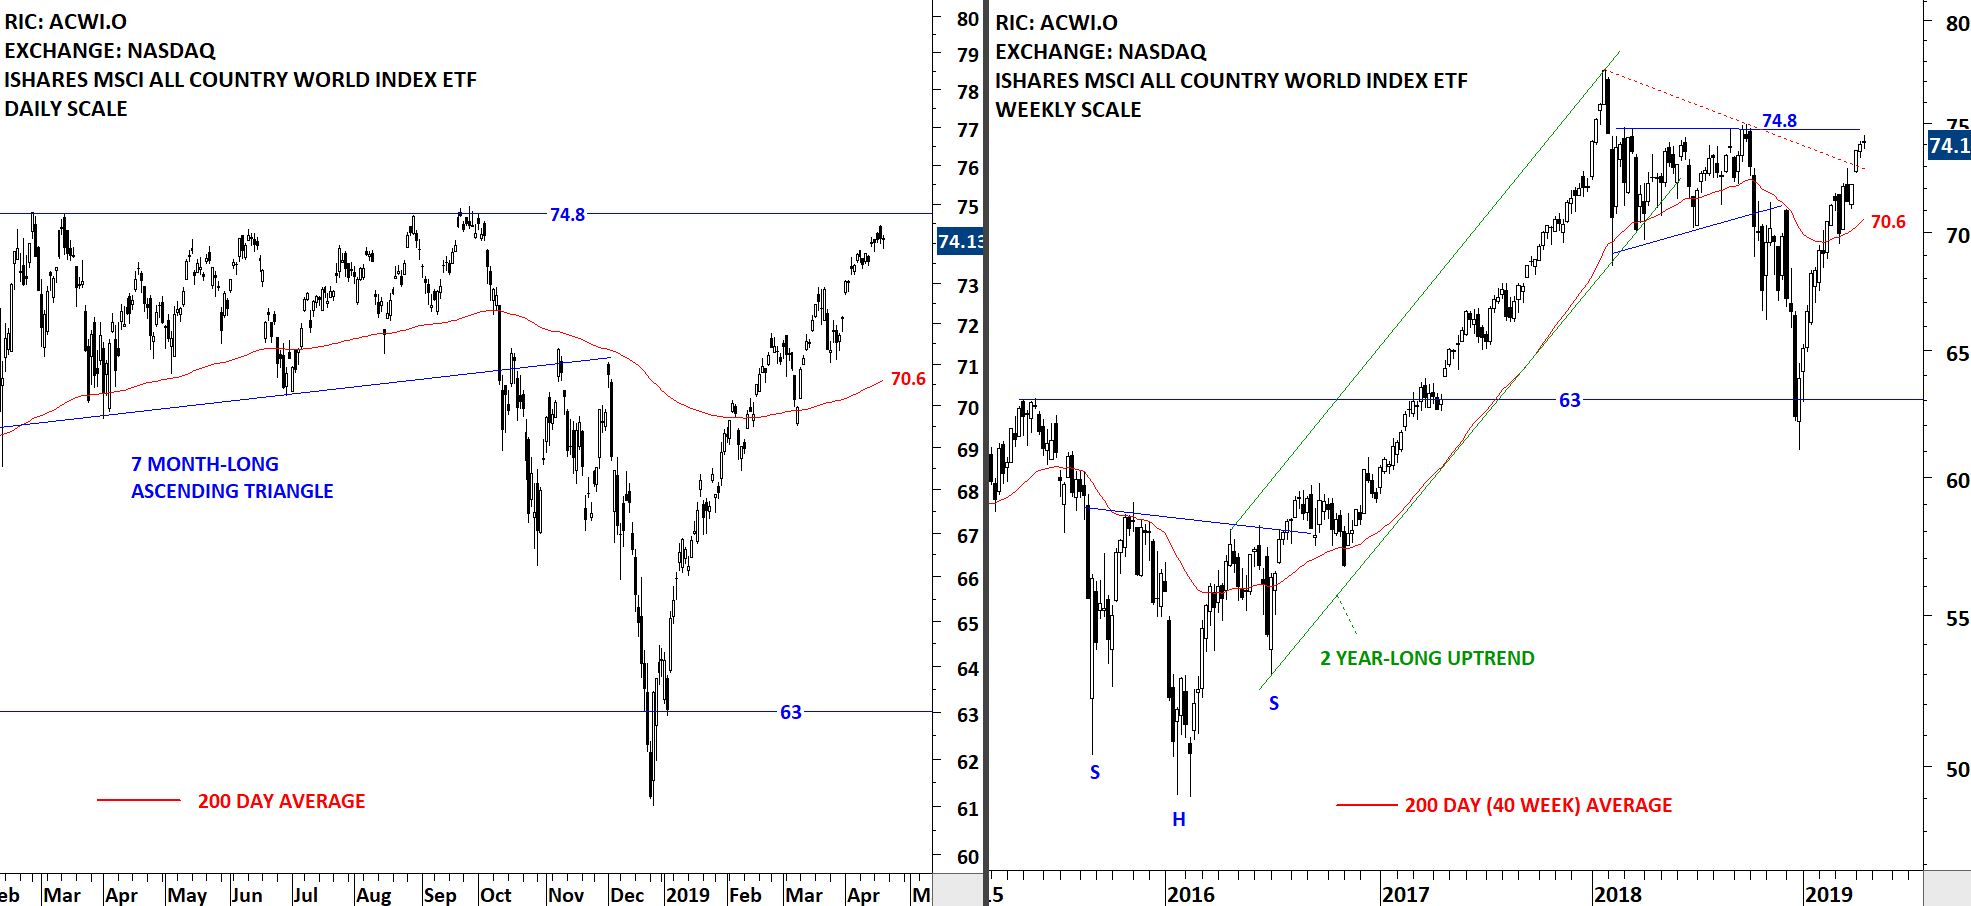
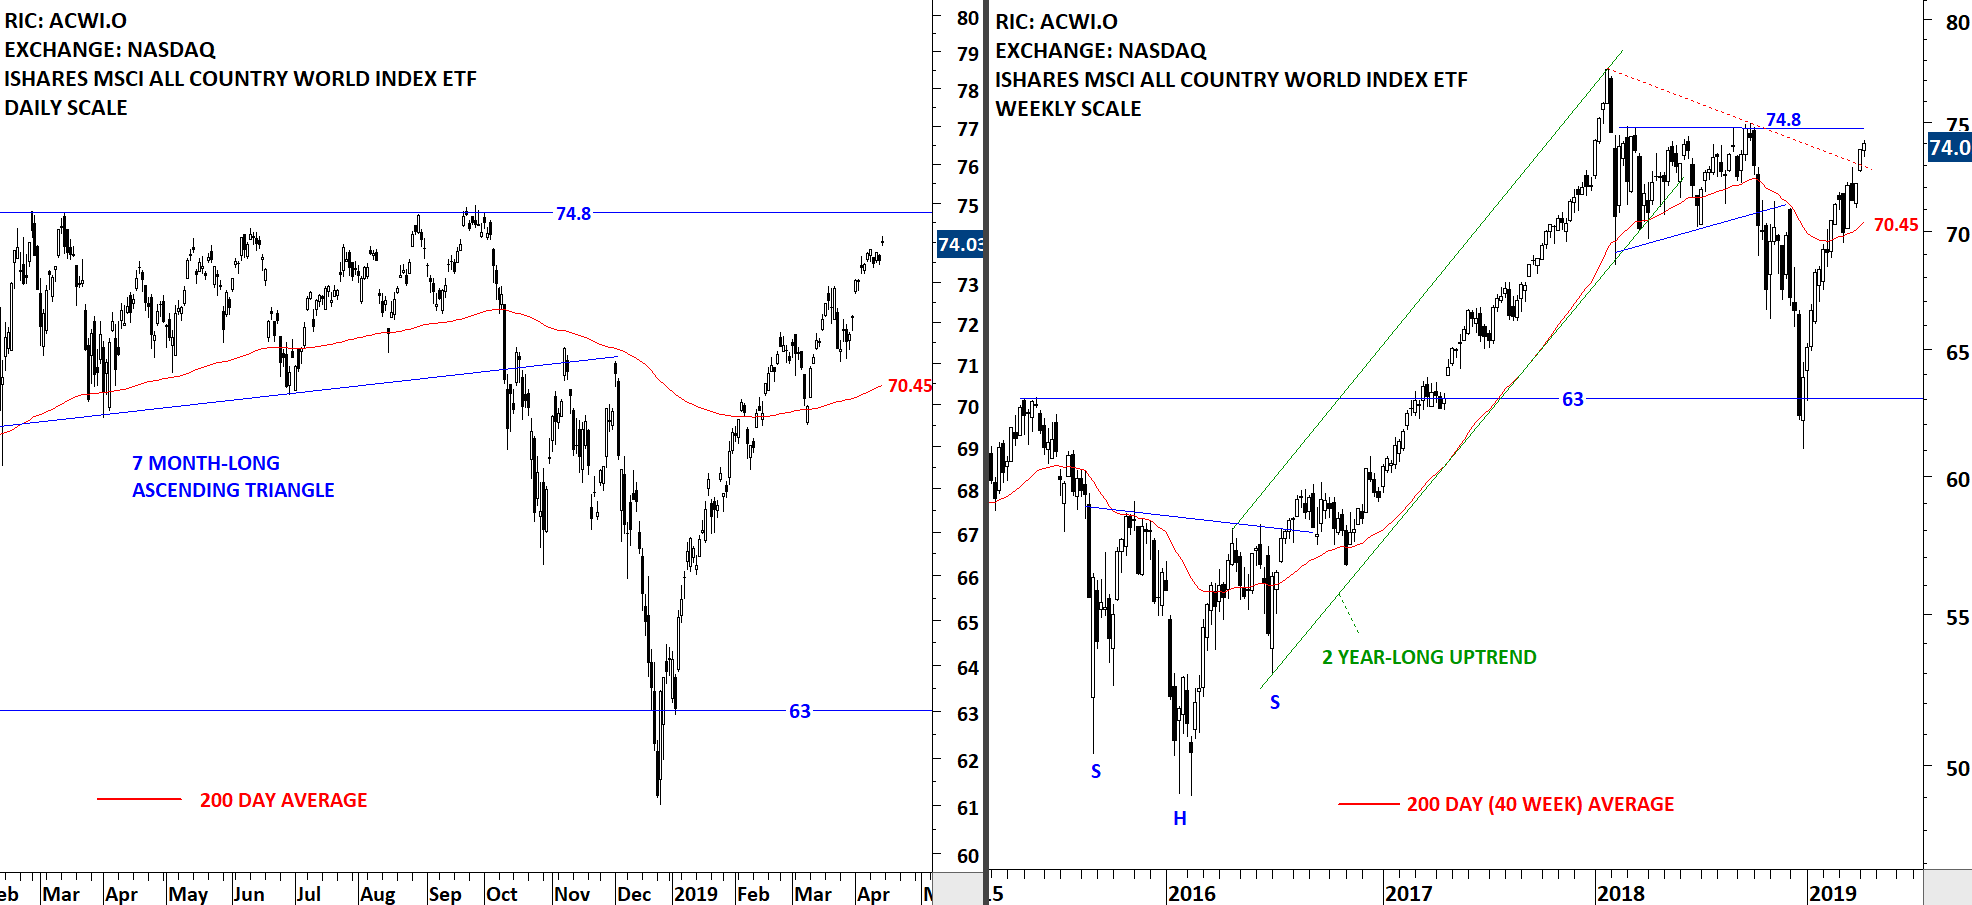
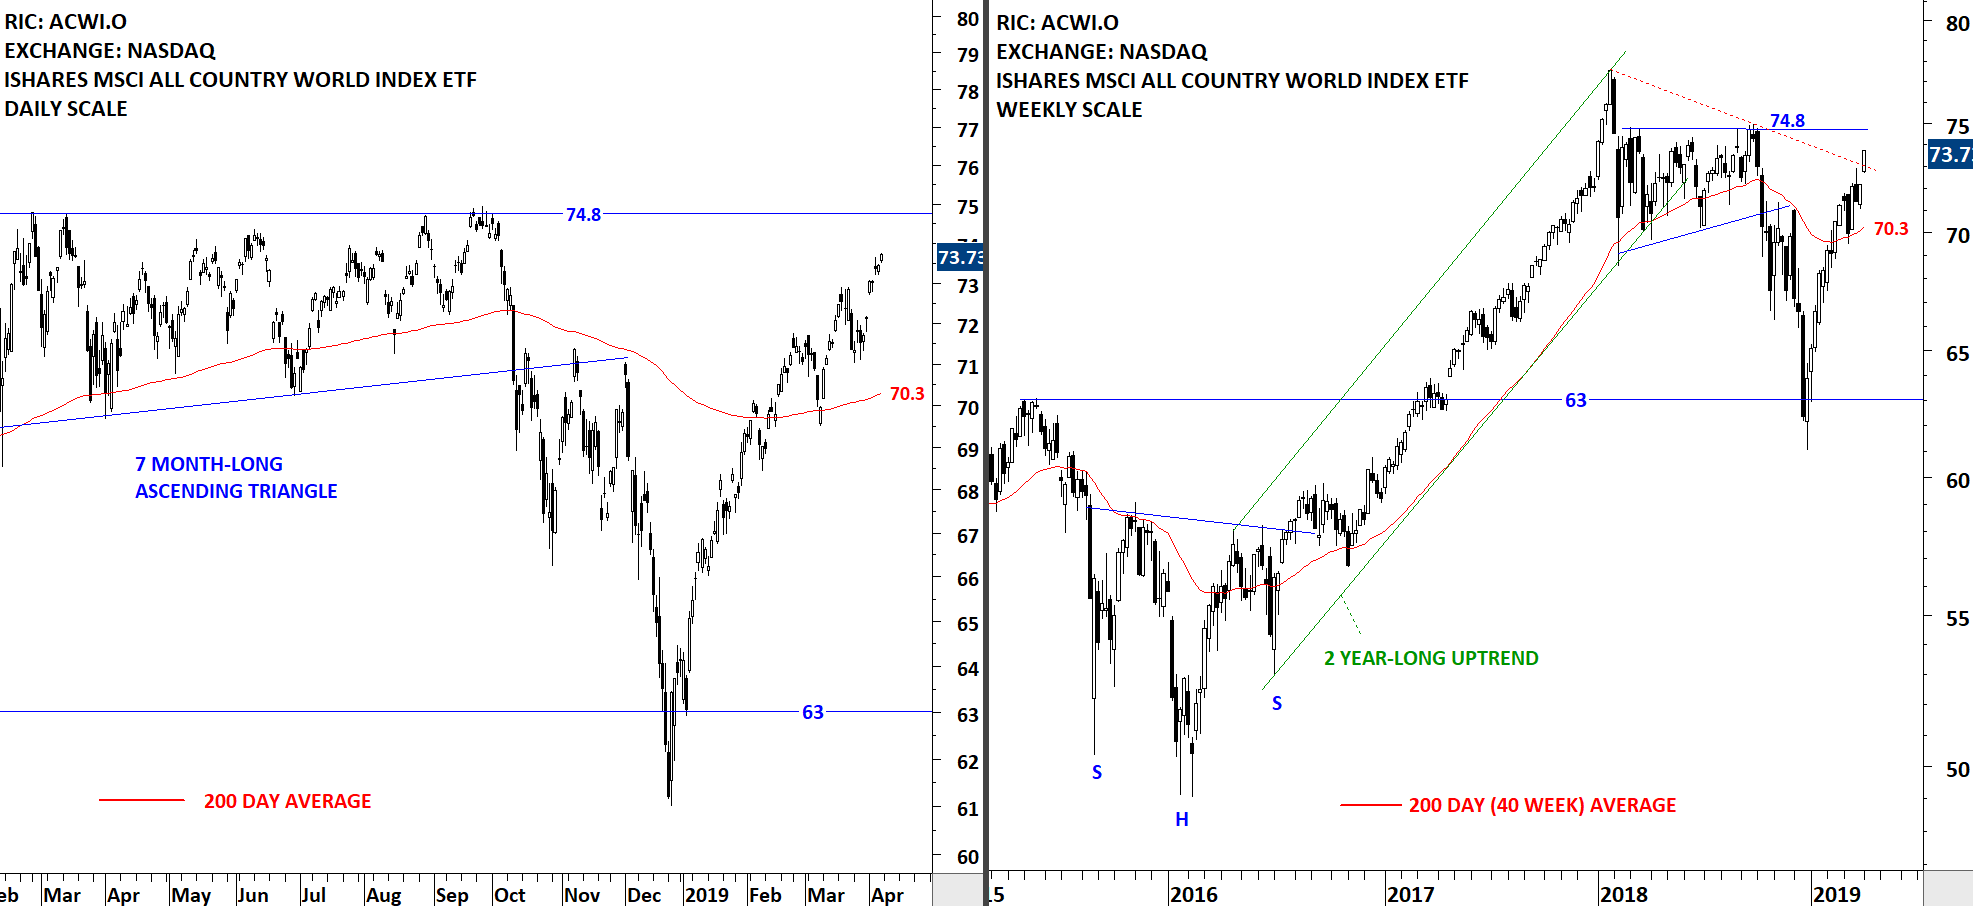
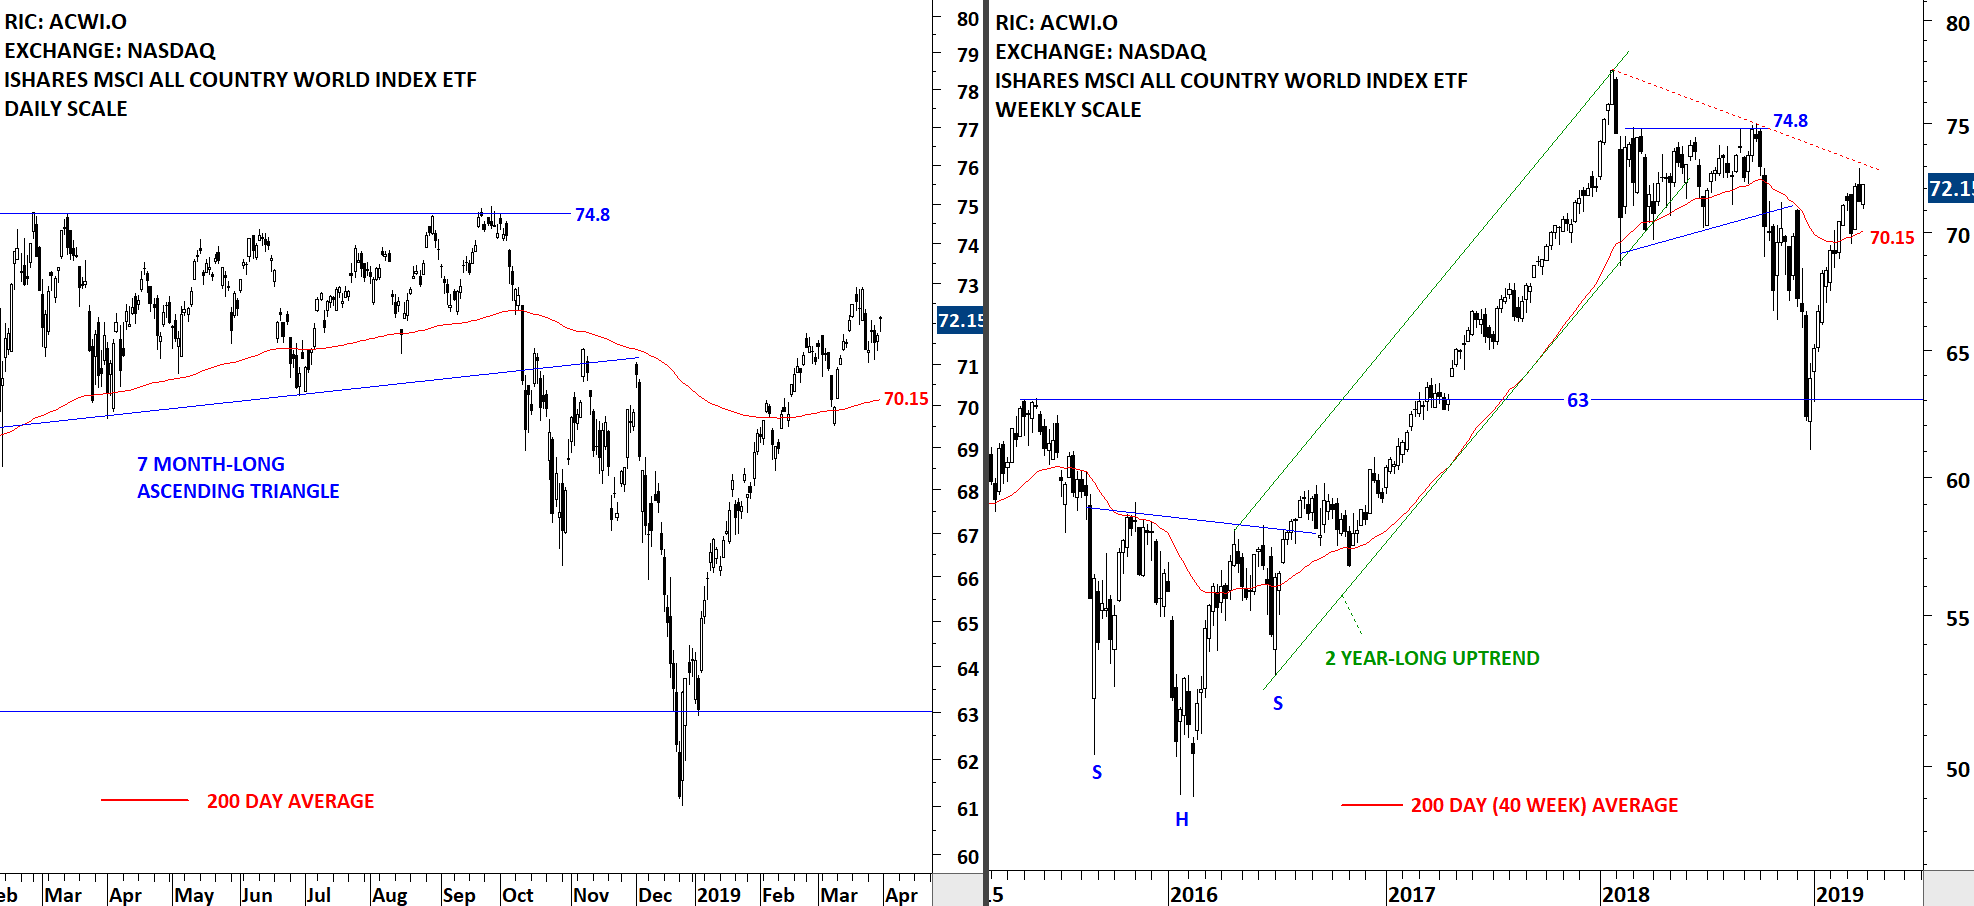
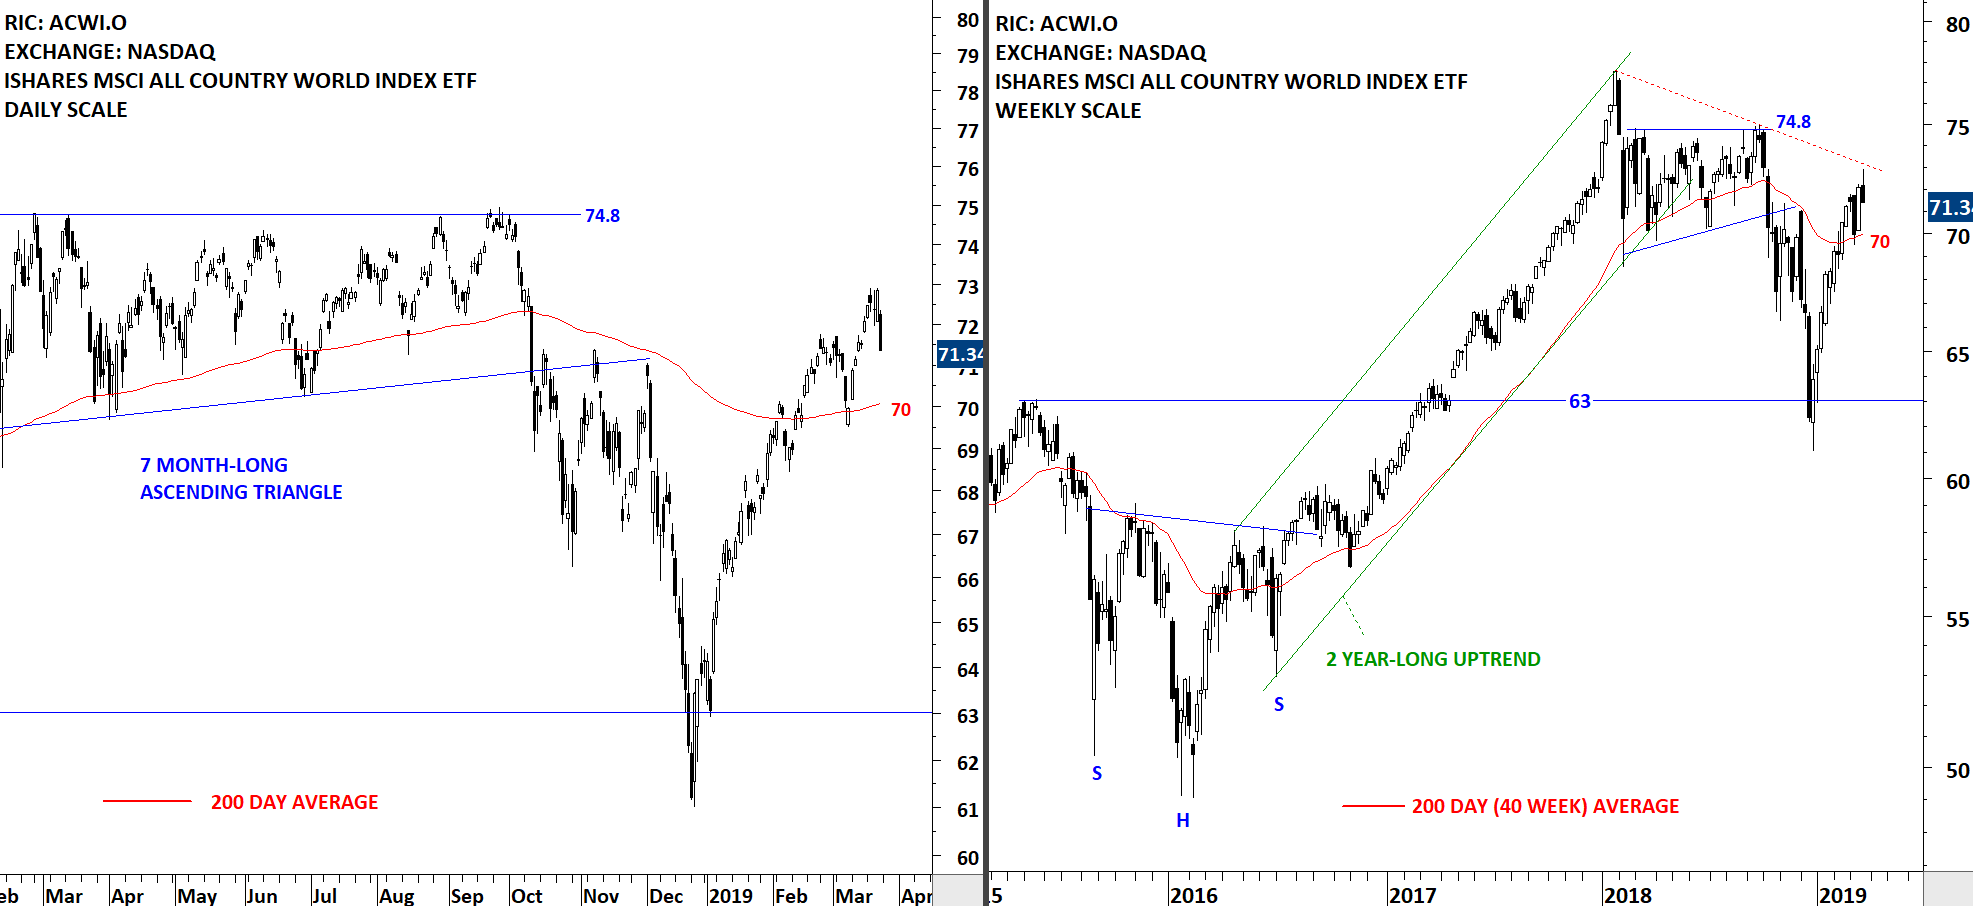
- We will review some of those chart pattern breakouts that were featured in the Global Equity Markets report.
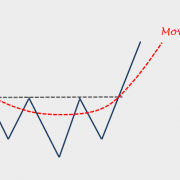
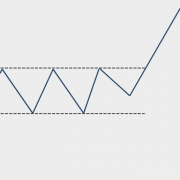
- We will review some of the qualities we look for when identifying and differentiating H&S bottom and H&S continuation
- We will look at some of the developing bullish continuation chart patterns
- We will continue to highlight Tech Charts members favorite chart pattern setups in different equity markets.
- Live questions from Members
- Can we look at palladium, does recent price action indicate a topping pattern? 47:03
- Any thoughts on CVS? 48:07
- Can you talk about 285 in HK? My question is — the last nights close is 3% above the boundary, but it's also a candle with big upper wick. How do you handle an entry like this? 48:24
- Could you please address where you place stop losses? Do you use trailing stops? If so, how? 50:00 Link mentioned ATR Trailing Stop-Loss – H&S Top
- Peter seems to use just about any dipping movement as a right shoulder. Do you have conditions, strict or otherwise, as what counts as a valid right shoulder? 50:33
- In the continuation pattern, if we compare H&S to cup and handle, which one has better success rate in your experience? 51:46
- Do you have any statistics as to the percentage of times H&S continuation patterns work? 53:35
- In H&S continuation pattern, do you ignore 200 Day MA totally? Some of them I noticed are really far above the long term moving average. Is that a concern? 54:49
- Do you regard H&S failure patterns as a valid tradeable pattern? 55:42
- With Peter Brandt’s retirement announced (April 2020), can you consider covering futures and commodities? Please. 56:59
- While you are drawing boundary lines are you relaying more on candlestick close or candlestick high (on body or on wick)? Is this discretionary and changes on pattern to pattern basis? Do you have some kind of method behind how you draw boundaries? 57:26
- When after breakout, a pullback below boundary, how long do you stick with it? All the way to failure point? Half way there? Do you study what % recover from a deep pullback below breakout? 58:40
- Does pairs (ratio) charts can be followed and traded using the same classical patterns outlined here? 1:00:36
- Can you buy Singapore and Spanish indices via ETF? Futures? 1:01:33
- 200 Moving Average on your charts is 200 period Exponential Moving Average? Always 200 periods (200 weeks on weekly and 200 days on daily) or always 200 DAYS EMA on every timeframe? 1:02:21
- Do you verify LT moving average on daily chart? Are you using the 200MA on daily chart 1:02:57 Link mentioned Moving Averages
- Could you discuss the significance of the divergence between SPX and the Russell 2000 - negative divergence (Russell underperforming)? 1:03:38
- Observations on RCI H&S setup? 1:04:52
- Do you have any observations on the use of options as a tactic to trade breakouts? 1:05:31
- By "Moving Average" is that the Simple Moving Average, or something else?1:05:44 Link mentioned Moving Averages