REAL VISION – TECHNICAL TRADER

Dear Tech Charts followers,

I reviewed some of the exciting chart pattern setups in Global Equity Markets for Real Vision – Technical Trader section.

You can watch the recording by following the link below. I hope you enjoy it.

https://www.realvision.com/the-power-of-classical-charting-patterns

Regards,

Aksel Kibar, CMT


Tech Charts Membership

By becoming a Premium Member, you’ll be able to improve your knowledge of the principles of classical charting.

With this knowledge, you can merge them with your investing system. In fact, some investors use my analyses to modify their existing style to invest more efficiently and successfully.

Get Access Now

As a Premium Member of Aksel Kibar’s Tech Charts,

You will receive:

  • Global Equities Report. Delivered weekly.
  • Classical charting principles. Learn patterns and setups.
  • Actionable information. Worldwide indices and stocks of interest.
  • Risk management advice. The important trading points of each chart.
  • Information on breakout opportunities. Identify the ones you want to take action on.
  • Video tutorials. How patterns form and why they succeed or fail.
  • Watch list alerts. As they become available so you can act quickly.
  • Breakout alerts. Usually once a week.
  • Access to everything (now and as it becomes available)
    o Reports
    o Videos and video series
  • Multi-part webinar course. You learn the 8 most common charting principles.
  • Webinars. Actionable and timely advice on breaking out chart patterns.

For your convenience your membership auto renews each year.

Get Access Now

GERMANY MDAX and S&P SPDR 600 ETF

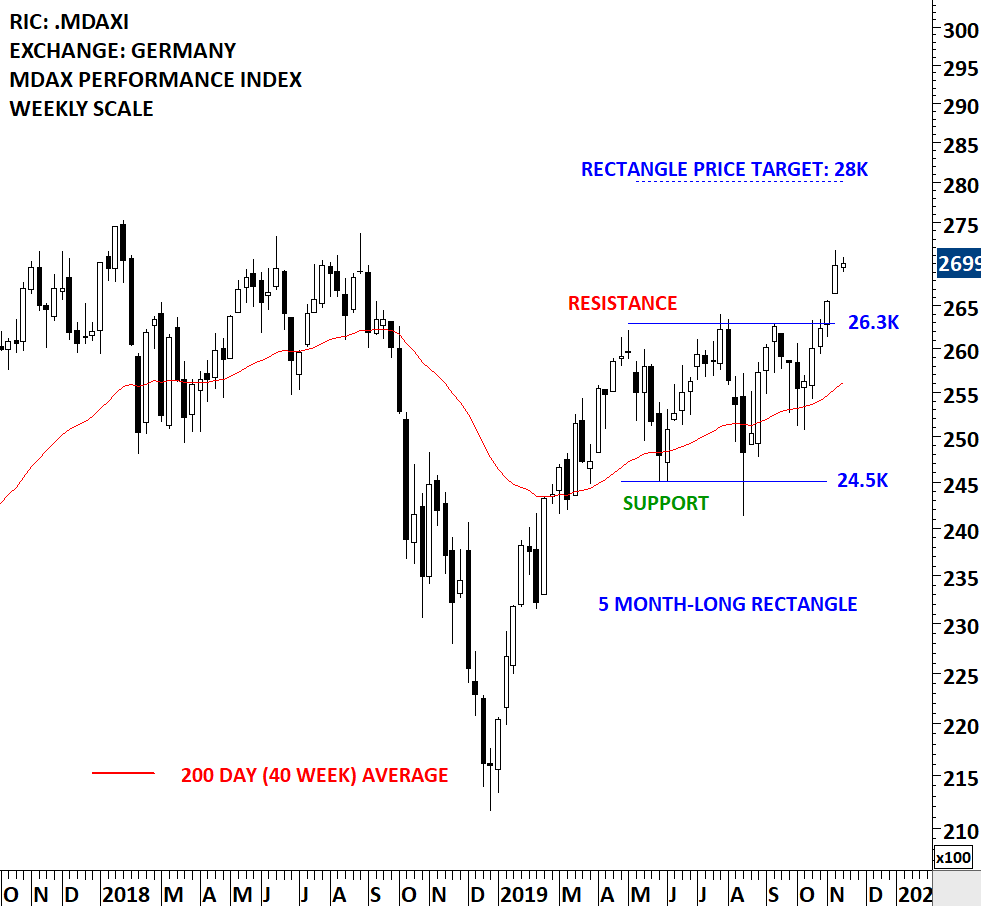
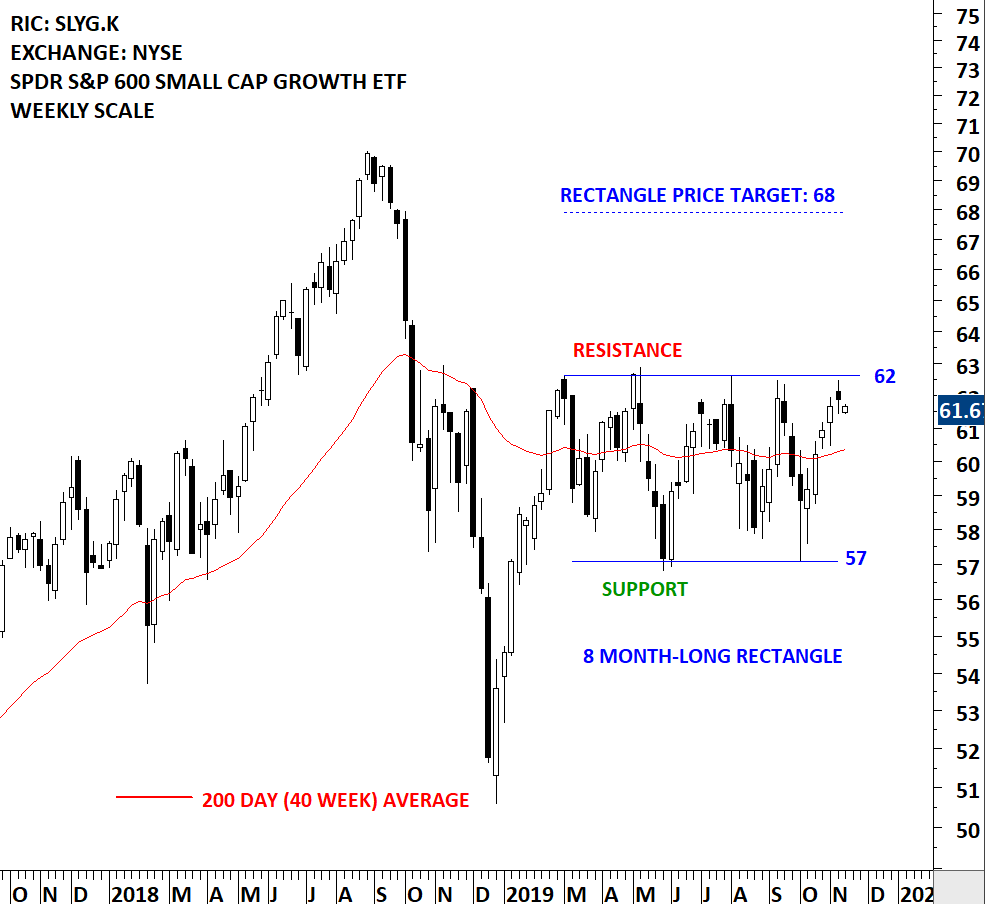
Every week Tech Charts Global Equity Markets report features some of the well-defined, mature classical chart patterns under a lengthy watchlist and the chart pattern breakout signals that took place during that week. Global Equity Markets report covers single stocks from developed, emerging and frontier markets, ETF’s and global equity indices. The report starts with a review section that highlights the important chart developments on global equity benchmarks. This blog post features from the review section two rectangle chart patterns on Germany’s MDAX Index and S&P SPDR 600 Small Cap Growth ETF.

There are several Global benchmarks that are stuck in a range and looking for direction. In this update I added the Germany’s mid-cap equities benchmark MDAX as well as S&P 600 Small Cap Growth ETF. Germany’s mid-cap MDAX Index recently completed a 5 month-long rectangle chart pattern. MDAX resumed higher after breaking above the upper boundary of its consolidation. Possible price target for the rectangle stands at 28K.

SPDR S&P 600 Small Cap Growth ETF has also well-defined boundaries between 57 and 62 levels. The ETF is possibly forming another rectangle chart pattern. Chart pattern price target for the SPDR S&P 600 Small Cap ETF stands at 68 levels.

(Data as of November 12, 2019). It is important to note that price charts are shown on weekly scale and the last candlestick only contains two days of trading data.


Tech Charts Membership

By becoming a Premium Member, you’ll be able to improve your knowledge of the principles of classical charting.

With this knowledge, you can merge them with your investing system. In fact, some investors use my analyses to modify their existing style to invest more efficiently and successfully.

Get Access Now

As a Premium Member of Aksel Kibar’s Tech Charts,

You will receive:

  • Global Equities Report. Delivered weekly.
  • Classical charting principles. Learn patterns and setups.
  • Actionable information. Worldwide indices and stocks of interest.
  • Risk management advice. The important trading points of each chart.
  • Information on breakout opportunities. Identify the ones you want to take action on.
  • Video tutorials. How patterns form and why they succeed or fail.
  • Watch list alerts. As they become available so you can act quickly.
  • Breakout alerts. Usually once a week.
  • Access to everything (now and as it becomes available)
    o Reports
    o Videos and video series
  • Multi-part webinar course. You learn the 8 most common charting principles.
  • Webinars. Actionable and timely advice on breaking out chart patterns.

For your convenience your membership auto renews each year.
Get Access Now

MICROCHIP TECHNOLOGY INC (MCHP.O)

Every week Tech Charts Global Equity Markets report features some of the well-defined, mature classical chart patterns under a lengthy watchlist and the chart pattern breakout signals that took place during that week. Global Equity Markets report covers single stocks from developed, emerging and frontier markets, ETF’s and global equity indices. The report starts with a review section that highlights the important chart developments on global equity benchmarks. This blog post features from the watchlist section a symmetrical triangle chart pattern opportunity, listed on the Nasdaq Stock Exchange.

MICROCHIP TECHNOLOGY INC (MCHP.O)

Microchip Technology Incorporated is engaged in developing, manufacturing and selling specialized semiconductor products used by its customers for a range of embedded control applications. The stock is listed on the Nasdaq Stock Exchange. Price chart formed a 6 month-long symmetrical triangle with the upper boundary acting as strong resistance at 97.60 levels. The upper boundary was tested several times over the course of the chart pattern. A daily close above 100.50 levels will confirm the breakout from the 6 month-long symmetrical triangle with the possible chart pattern price target of 121.0 levels. (Data as of November 4, 2019)


Tech Charts Membership

By becoming a Premium Member, you’ll be able to improve your knowledge of the principles of classical charting.

With this knowledge, you can merge them with your investing system. In fact, some investors use my analyses to modify their existing style to invest more efficiently and successfully.

Get Access Now

As a Premium Member of Aksel Kibar’s Tech Charts,

You will receive:

  • Global Equities Report. Delivered weekly.
  • Classical charting principles. Learn patterns and setups.
  • Actionable information. Worldwide indices and stocks of interest.
  • Risk management advice. The important trading points of each chart.
  • Information on breakout opportunities. Identify the ones you want to take action on.
  • Video tutorials. How patterns form and why they succeed or fail.
  • Watch list alerts. As they become available so you can act quickly.
  • Breakout alerts. Usually once a week.
  • Access to everything (now and as it becomes available)
    o Reports
    o Videos and video series
  • Multi-part webinar course. You learn the 8 most common charting principles.
  • Webinars. Actionable and timely advice on breaking out chart patterns.

For your convenience your membership auto renews each year.

Get Access Now

JD.COM INC (JD.O)

Every week Tech Charts Global Equity Markets report features some of the well-defined, mature classical chart patterns under a lengthy watchlist and the chart pattern breakout signals that took place during that week. Global Equity Markets report covers single stocks from developed, emerging and frontier markets, ETF’s and global equity indices. The report starts with a review section that highlights the important chart developments on global equity benchmarks. This blog post features from the watchlist section a rectangle chart pattern opportunity, listed on the Nasdaq Stock Exchange.

JD.COM INC (JD.O)

JD.com, Inc. is an online direct sales company. The Company engages in the sale of electronics and home appliance products and general merchandise products (including audio, video products and books) sourced from manufacturers, distributors and publishers in China on the Internet through its Website, www.jd.com. The stock is listed on the Nasdaq Stock Exchange. Price chart formed a 7 month-long rectangle with the horizontal boundary acting as strong resistance at 32.00 levels. The horizontal boundary was tested several times over the course of the chart pattern. A daily close above 33.00 levels will confirm the breakout from the 7 month-long rectangle with the possible chart pattern price target of 38.25 levels. (Data as of October 28, 2019)


Tech Charts Membership

By becoming a Premium Member, you’ll be able to improve your knowledge of the principles of classical charting.

With this knowledge, you can merge them with your investing system. In fact, some investors use my analyses to modify their existing style to invest more efficiently and successfully.

Get Access Now

As a Premium Member of Aksel Kibar’s Tech Charts,

You will receive:

  • Global Equities Report. Delivered weekly.
  • Classical charting principles. Learn patterns and setups.
  • Actionable information. Worldwide indices and stocks of interest.
  • Risk management advice. The important trading points of each chart.
  • Information on breakout opportunities. Identify the ones you want to take action on.
  • Video tutorials. How patterns form and why they succeed or fail.
  • Watch list alerts. As they become available so you can act quickly.
  • Breakout alerts. Usually once a week.
  • Access to everything (now and as it becomes available)
    o Reports
    o Videos and video series
  • Multi-part webinar course. You learn the 8 most common charting principles.
  • Webinars. Actionable and timely advice on breaking out chart patterns.

For your convenience your membership auto renews each year.
Get Access Now

GERMANY MDAX and S&P SPDR 600 ETF

Every week Tech Charts Global Equity Markets report features some of the well-defined, mature classical chart patterns under a lengthy watchlist and the chart pattern breakout signals that took place during that week. Global Equity Markets report covers single stocks from developed, emerging and frontier markets, ETF’s and global equity indices. The report starts with a review section that highlights the important chart developments on global equity benchmarks. This blog post features from the review section two rectangle consolidations on Germany’s MDAX Index and S&P SPDR 600 Small Cap Growth ETF. Both chart patterns can act as bullish continuations.

Over the past few weeks I featured the tight consolidation that was taking place on Ishares MSCI Belgium ETF (EWK). The breakout took place with a strong weekly candlestick. There are several Global benchmarks that are stuck in a range and looking for direction. In this update I added the Germany’s mid-cap equities benchmark MDAX as well as S&P 600 Small Cap Growth ETF.

Both charts show the past few months well-defined consolidations. MDAX is now closer to the upper boundary of its consolidation. There has been several tests of the chart pattern  boundaries. I monitor 26.3K resistance for a possible breakout from the 6 month-long rectangle chart pattern. (Data as of October 22, 2019, 4:35 pm). It is important to note that price charts are shown on weekly scale and the last candlestick only contains two days of trading data.


Tech Charts Membership

By becoming a Premium Member, you’ll be able to improve your knowledge of the principles of classical charting.

With this knowledge, you can merge them with your investing system. In fact, some investors use my analyses to modify their existing style to invest more efficiently and successfully.

Get Access Now

As a Premium Member of Aksel Kibar’s Tech Charts,

You will receive:

  • Global Equities Report. Delivered weekly.
  • Classical charting principles. Learn patterns and setups.
  • Actionable information. Worldwide indices and stocks of interest.
  • Risk management advice. The important trading points of each chart.
  • Information on breakout opportunities. Identify the ones you want to take action on.
  • Video tutorials. How patterns form and why they succeed or fail.
  • Watch list alerts. As they become available so you can act quickly.
  • Breakout alerts. Usually once a week.
  • Access to everything (now and as it becomes available)
    o Reports
    o Videos and video series
  • Multi-part webinar course. You learn the 8 most common charting principles.
  • Webinars. Actionable and timely advice on breaking out chart patterns.

For your convenience your membership auto renews each year.
Get Access Now

ASCENDING TRIANGLE (CONTINUATION)

Every week Tech Charts Global Equity Markets report features some of the well-defined, mature classical chart patterns under a lengthy watchlist and the chart pattern breakout signals that took place during that week. Global Equity Markets report covers single stocks from developed, emerging and frontier markets, ETF’s and global equity indices. The report starts with a review section that highlights the important chart developments on global equity benchmarks. This blog post features from the watchlist section a bullish ascending triangle chart pattern opportunity, listed on the Nasdaq Stock Exchange.

PROOFPOINT INC (PFPT.O)

Proofpoint, Inc. is a security-as-a-service provider that enables large and mid-sized organizations to defend, protect, archive and govern their sensitive data. The stock is listed on the Nasdaq Stock Exchange. Price chart formed a 5 month-long ascending triangle with the horizontal boundary acting as strong resistance at 132.00 levels. The horizontal boundary was tested several times over the course of the chart pattern. A daily close above 136.00 levels will confirm the breakout from the 5 month-long ascending triangle with the possible chart pattern price target of 160.00 levels. Data as of  October 15, 2019


Tech Charts Membership

By becoming a Premium Member, you’ll be able to improve your knowledge of the principles of classical charting.

With this knowledge, you can merge them with your investing system. In fact, some investors use my analyses to modify their existing style to invest more efficiently and successfully.

Get Access Now

As a Premium Member of Aksel Kibar’s Tech Charts,

You will receive:

  • Global Equities Report. Delivered weekly.
  • Classical charting principles. Learn patterns and setups.
  • Actionable information. Worldwide indices and stocks of interest.
  • Risk management advice. The important trading points of each chart.
  • Information on breakout opportunities. Identify the ones you want to take action on.
  • Video tutorials. How patterns form and why they succeed or fail.
  • Watch list alerts. As they become available so you can act quickly.
  • Breakout alerts. Usually once a week.
  • Access to everything (now and as it becomes available)
    o Reports
    o Videos and video series
  • Multi-part webinar course. You learn the 8 most common charting principles.
  • Webinars. Actionable and timely advice on breaking out chart patterns.

For your convenience your membership auto renews each year.
Get Access Now

CUP & HANDLE (CONTINUATION)

Every week Tech Charts Global Equity Markets report features some of the well-defined, mature classical chart patterns under a lengthy watchlist and the chart pattern breakout signals that took place during that week. Global Equity Markets report covers single stocks from developed, emerging and frontier markets, ETF’s and global equity indices. The report starts with a review section that highlights the important chart developments on global equity benchmarks. This blog post features from the watchlist section a bullish continuation cup & handle chart pattern opportunity, listed on the Nasdaq Stock Exchange.

GCI LIBERTY INC (GLIBA.O)

GCI Liberty, Inc., formerly General Communication, Inc., is a holding company. The Company, together with its subsidiaries, is a communications provider with operations primarily in the State of Alaska. The Company provides a range of wireless, data, video, voice and managed services to residential customers, businesses, governmental entities, and educational and medical institutions primarily in Alaska under its GCI brand. The stock is listed on the Nasdaq Stock Exchange. Price chart formed a 3 month-long cup & handle continuation with the horizontal boundary acting as strong resistance at 65.00 levels. The horizontal boundary was tested several times over the course of the chart pattern. A daily close above 66.00 levels will confirm the breakout from the 3 month-long cup & handle continuation with the possible chart pattern price target of 72.75 levels. Breakout can push the stock to all-time highs. Data as of 10:30 am October 9, 2019

A recent breakout alert was issued in the Global Equity Markets report covering a similar cup & handle breakout opportunity on Novocure. The weekly scale price chart featured a 7 month-long cup & handle that broke out to all-time highs. Breakout to all-time highs from bullish continuation chart patterns is the path of least resistance. Similar chart patterns can form on daily, weekly and monthly scale price charts. The underlying dynamics are the same. Though it is important to note that the shorter the time frame the higher the probability of failure. My default time frame for research is weekly scale. I also look at chart patterns on daily scale.


Tech Charts Membership

By becoming a Premium Member, you’ll be able to improve your knowledge of the principles of classical charting.

With this knowledge, you can merge them with your investing system. In fact, some investors use my analyses to modify their existing style to invest more efficiently and successfully.

Get Access Now

As a Premium Member of Aksel Kibar’s Tech Charts,

You will receive:

  • Global Equities Report. Delivered weekly.
  • Classical charting principles. Learn patterns and setups.
  • Actionable information. Worldwide indices and stocks of interest.
  • Risk management advice. The important trading points of each chart.
  • Information on breakout opportunities. Identify the ones you want to take action on.
  • Video tutorials. How patterns form and why they succeed or fail.
  • Watch list alerts. As they become available so you can act quickly.
  • Breakout alerts. Usually once a week.
  • Access to everything (now and as it becomes available)
    o Reports
    o Videos and video series
  • Multi-part webinar course. You learn the 8 most common charting principles.
  • Webinars. Actionable and timely advice on breaking out chart patterns.

For your convenience your membership auto renews each year.
Get Access Now

UBISOFT ENTERTAINMENT SA (UBIP.PA)

Every week Tech Charts Global Equity Markets report features some of the well-defined, mature classical chart patterns under a lengthy watchlist and the chart pattern breakout signals that took place during that week. Global Equity Markets report covers single stocks from developed, emerging and frontier markets, ETF’s and global equity indices. The report starts with a review section that highlights the important chart developments on global equity benchmarks. This blog post features from the watchlist section a bearish continuation symmetrical triangle chart pattern opportunity, listed on the Paris Stock Exchange.

UBISOFT ENTERTAINMENT SA (UBIP.PA)

Ubisoft Entertainment SA is a France-based company that is engaged in the development, publishing and distribution of video games. The stock is listed on the Paris Stock Exchange. Price chart formed a 7 month-long symmetrical triangle with the lower boundary acting as strong support at 67 levels. The lower boundary was tested several times over the course of the chart pattern. The daily close below 65 levels confirmed the breakdown from the 7 month-long symmetrical triangle with the possible chart pattern price target of 50 levels. The long-term price chart below shows the critical support level the stock is breaching. The breakdown from the symmetrical triangle breached the long-term uptrend line. (Learn more: Video Tutorial) (Data as of Oct 1, 2019) Important note: The weekly scale price chart shows the first 2 days of trading (Monday & Tuesday) on the last candlestick)


Tech Charts Membership

By becoming a Premium Member, you’ll be able to improve your knowledge of the principles of classical charting.

With this knowledge, you can merge them with your investing system. In fact, some investors use my analyses to modify their existing style to invest more efficiently and successfully.

Get Access Now

As a Premium Member of Aksel Kibar’s Tech Charts,

You will receive:

  • Global Equities Report. Delivered weekly.
  • Classical charting principles. Learn patterns and setups.
  • Actionable information. Worldwide indices and stocks of interest.
  • Risk management advice. The important trading points of each chart.
  • Information on breakout opportunities. Identify the ones you want to take action on.
  • Video tutorials. How patterns form and why they succeed or fail.
  • Watch list alerts. As they become available so you can act quickly.
  • Breakout alerts. Usually once a week.
  • Access to everything (now and as it becomes available)
    o Reports
    o Videos and video series
  • Multi-part webinar course. You learn the 8 most common charting principles.
  • Webinars. Actionable and timely advice on breaking out chart patterns.

For your convenience your membership auto renews each year.
Get Access Now

A review of the most reliable chart patterns Tech Charts Global Equity Markets report featured over the past two years – September 2019 Tech Charts Webinar

A review of the most reliable chart patterns Tech Charts Global Equity Markets report featured over the past two years – September 2019 Tech Charts Webinar

Webinar Outline

  • We will review some of those chart pattern breakouts that were featured in the Global Equity Markets report 
  • We will review some of the conditions that are required for successful completion of different chart patterns 
  • We will look at some of the developing bullish continuation chart patterns 
  • We will continue to highlight Tech Charts members favorite chart pattern setups in different equity markets
  • We will have a member Q&A at the end of the webinar

Live questions from Members  

  1. On triangle breakouts, how important do you feel it is to clear the last pivot point (as opposed to buying the breakout immediately) before entering a trade? 1:07:49
  2. Could you please comment the HUI or GDX graph? 1:08:30
  3. You have been using SSE50 to analyze China. May I suggest including or start using A50? The reason is apparently the futures contracts trading on SGX. Or, is there a leveraged way to trade SSE50 other than CFD? 1:09:15
  4. Slide 2 – Is the moving average simple, exponential, or something else? 1:09:52
  5. Can you start posting the slides with the member webinar on the member site? It would be very helpful. 1:10:52
  6. H&S bottom reversal: it looks like from the examples that the downtrend line would be breached, retested and form the right shoulder and then breakout. The question, would it be advisable to take position after right shoulder(retest of the down trend line)? 1:11:09
  7. When a H&S has a neckline that is slanted left or right, to which point do you trade? 1:12:08
  8. Why three times 10-period ATR? Is it from experience, is this the best setting for Aksel’s time frame? 1:13:02
  9. Broadening triangle – It’s probably not worth taking a position but when a flat top broadening triangle forms in the downtrend, is there a bias? Example Canada government bond 2-year rate. Flat top broadening triangle formed from March, in the middle of the downtrend. 1:14:30
  10. How do you answer something like this: “I never thought buying breakouts was a good way to trade. Takes so many buyer s to get a stock through resistance. You don’t wanna be buying AFTER that…Pullbacks after the breakout or ahead of a breakout only for me.” 1:15:32
  11. When a premature breakout happens, and the stop is hit, if the breakout happens again, would you take the signal again? If yes, do you change the position size if the risk is lower this time (pivot closer to breakout level)? 1:16:47
  12. Have you calculated which patterns tend to assume which roles: continuation vs. reversal? 1:17:37
  13. Is there any suggestion, other than using the correlation table, which breakout signals to select from because you highlight many and they all look pretty good. 1:18:32
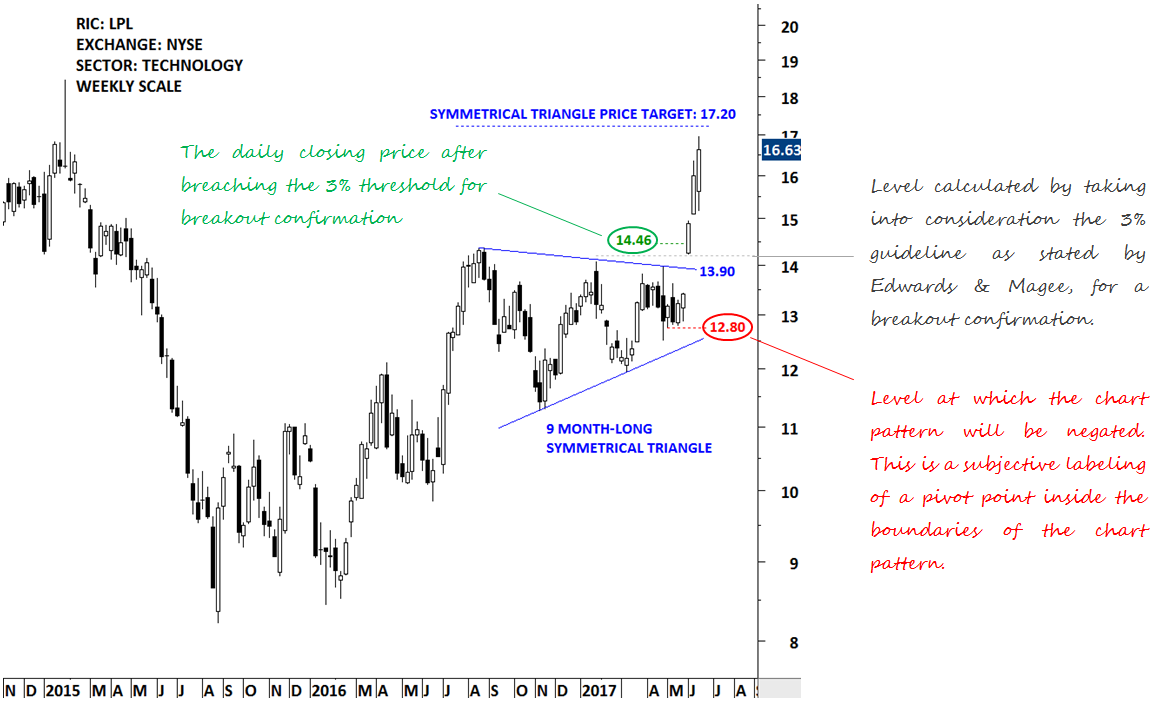
  14. What does on a daily closing basis mean – example when saying, “That the 3%-breakout-confirmation has to happen on a daily closing basis?” 1:19:14

Recorded live 9.15.2019 


SaveSave

SaveSave

JD.COM INC (JD.O)

Every week Tech Charts Global Equity Markets report features some of the well-defined, mature classical chart patterns under a lengthy watchlist and the chart pattern breakout signals that took place during that week. Global Equity Markets report covers single stocks from developed, emerging and frontier markets, ETF’s and global equity indices. The report starts with a review section that highlights the important chart developments on global equity benchmarks. This blog post features from the watchlist section a rectangle chart pattern opportunity, listed on the Nasdaq Stock Exchange.

JD.COM INC (JD.O)

JD.com, Inc. is an online direct sales company. The Company engages in the sale of electronics and home appliance products and general merchandise products (including audio, video products and books) sourced from manufacturers, distributors and publishers in China on the Internet through its Website, www.jd.com. The stock is listed on the Nasdaq Stock Exchange. Price chart formed a 5 month-long rectangle with the horizontal boundary acting as strong resistance at 32.00 levels. The horizontal boundary was tested several times over the course of the chart pattern. A daily close above 33.00 levels will confirm the breakout from the 5 month-long rectangle with the possible chart pattern price target of 38.25 levels. (Data as of September 16, 2019)


Tech Charts Membership

By becoming a Premium Member, you’ll be able to improve your knowledge of the principles of classical charting.

With this knowledge, you can merge them with your investing system. In fact, some investors use my analyses to modify their existing style to invest more efficiently and successfully.

Get Access Now

As a Premium Member of Aksel Kibar’s Tech Charts,

You will receive:

  • Global Equities Report. Delivered weekly.
  • Classical charting principles. Learn patterns and setups.
  • Actionable information. Worldwide indices and stocks of interest.
  • Risk management advice. The important trading points of each chart.
  • Information on breakout opportunities. Identify the ones you want to take action on.
  • Video tutorials. How patterns form and why they succeed or fail.
  • Watch list alerts. As they become available so you can act quickly.
  • Breakout alerts. Usually once a week.
  • Access to everything (now and as it becomes available)
    o Reports
    o Videos and video series
  • Multi-part webinar course. You learn the 8 most common charting principles.
  • Webinars. Actionable and timely advice on breaking out chart patterns.

For your convenience your membership auto renews each year.

Get Access Now