Every week Tech Charts Global Equity Markets report features some of the well-defined, mature classical chart patterns under a lengthy watchlist and the chart pattern breakout signals that took place during that week. Global Equity Markets report covers single stocks from developed, emerging and frontier markets, ETF’s and global equity indices. The report starts with a review section that highlights the important chart developments on global equity benchmarks. This blog post features from the breakouts section some of the text-book rectangle chart pattern breakouts. Rectangle is one of my favorite classical chart pattern. It has well-defined boundaries. It is easier to identify on price charts. Usually before the breakout takes place price has several tests of the chart pattern boundary. Breakouts after several tests of pattern boundary are usually powerful and are followed by strong trends.
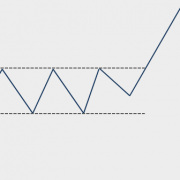
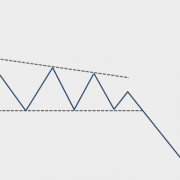
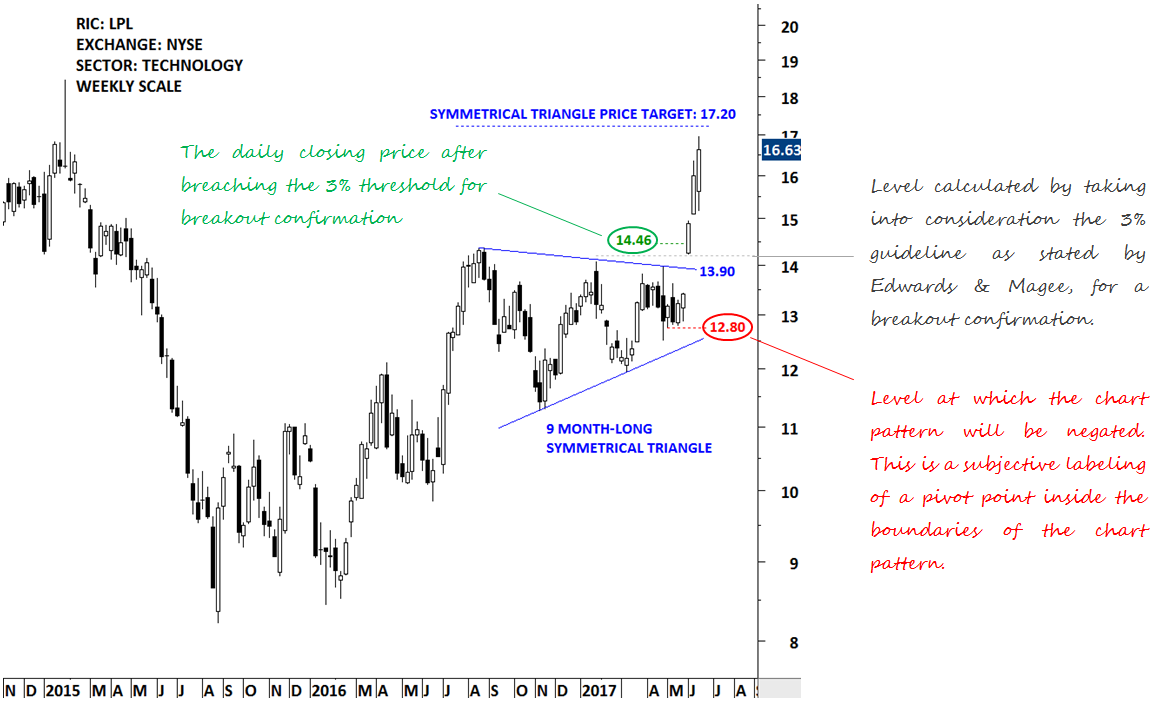
A quick note for our new followers; the red lines on price charts are not provided as stop-loss levels. While they can be used as stop-loss, they are actually a subjective level for chart pattern negation. Chart pattern negation is different than a stop-loss. A stop-loss can be placed below the chart pattern boundary tighter or wider depending on your risk profile and other factors. I attached below a chart that explains each labeling on price charts.
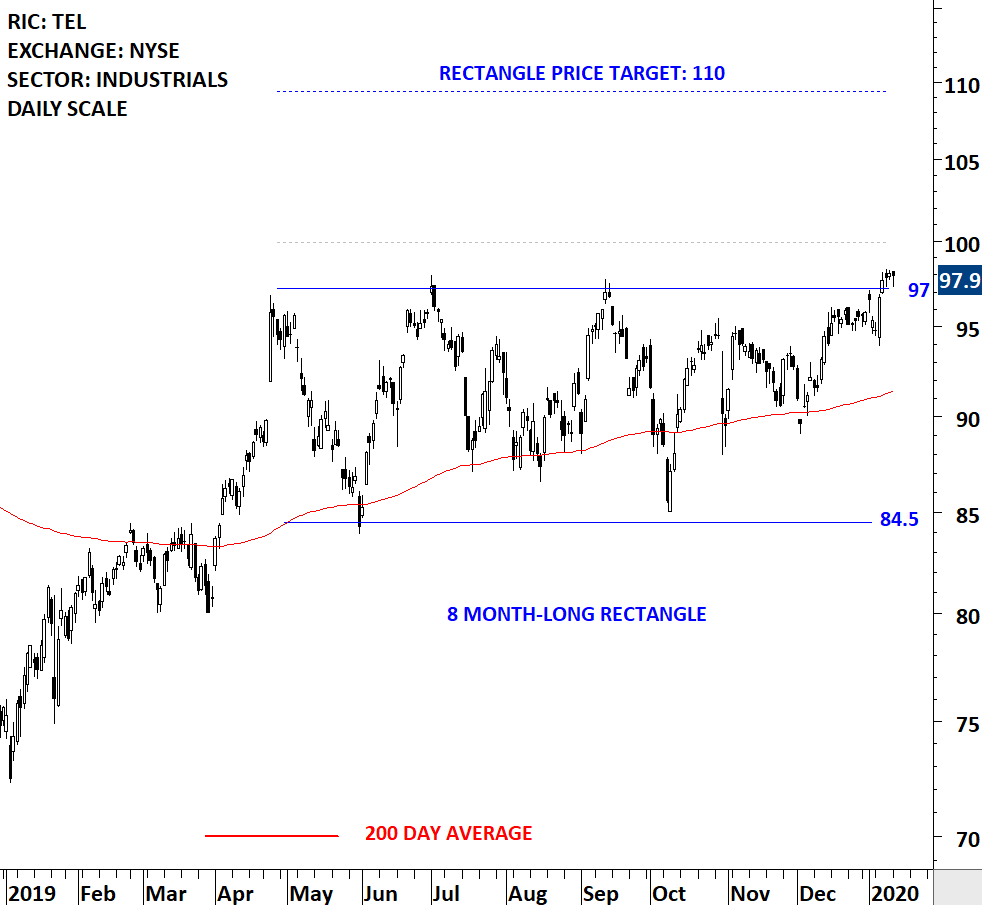
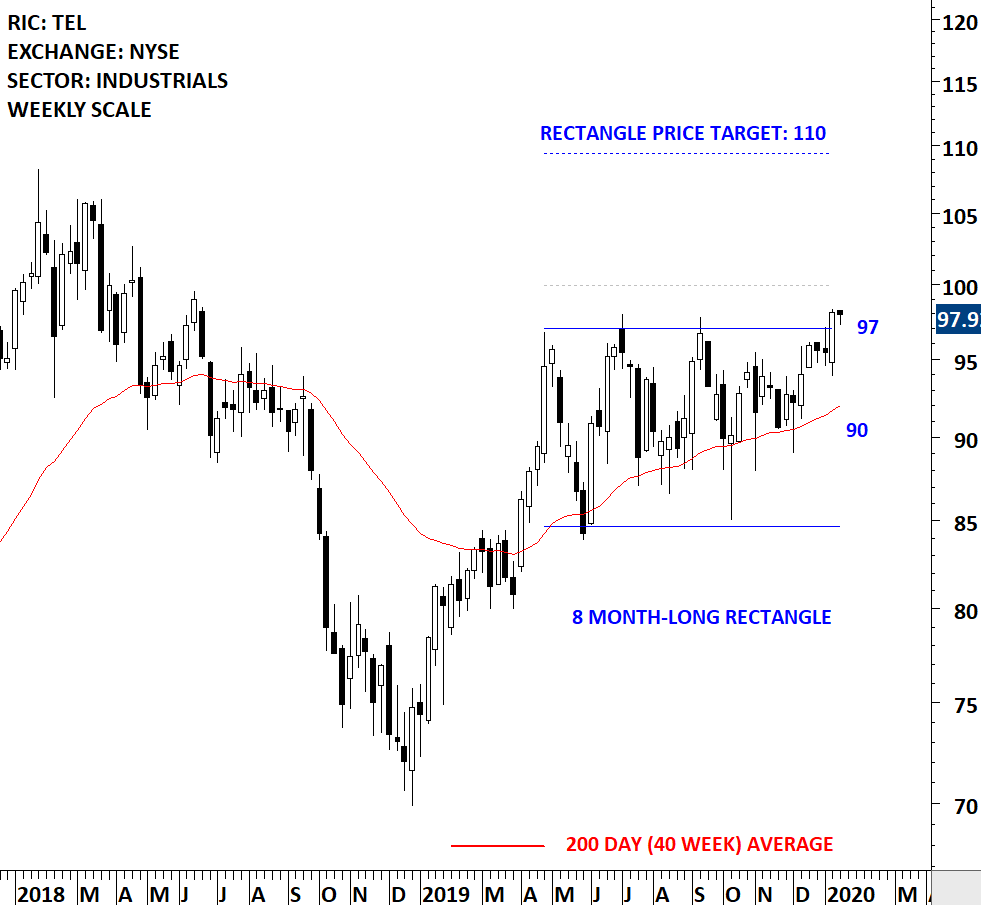
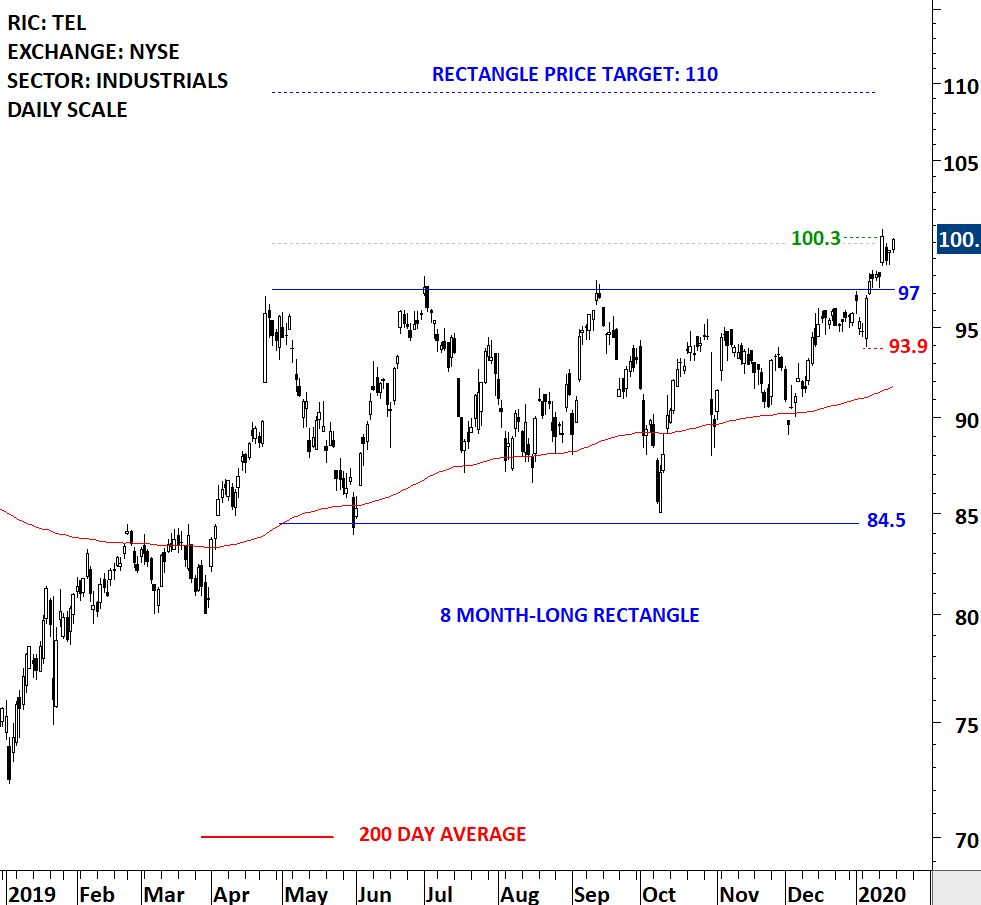
TE CONNECTIVITY LTD (TEL)
TE Connectivity Ltd. is a technology company. The Company designs and manufactures connectivity and sensors solutions. The stock is listed on the New York Stock Exchange. Price chart formed a 8 month-long ascending triangle with the horizontal boundary acting as strong resistance at 97.0 levels. The horizontal boundary was tested several times over the course of the chart pattern. The daily close above 100.0 levels confirmed the breakout from the 8 month-long ascending triangle with the possible chart pattern price target of 110.0 levels.
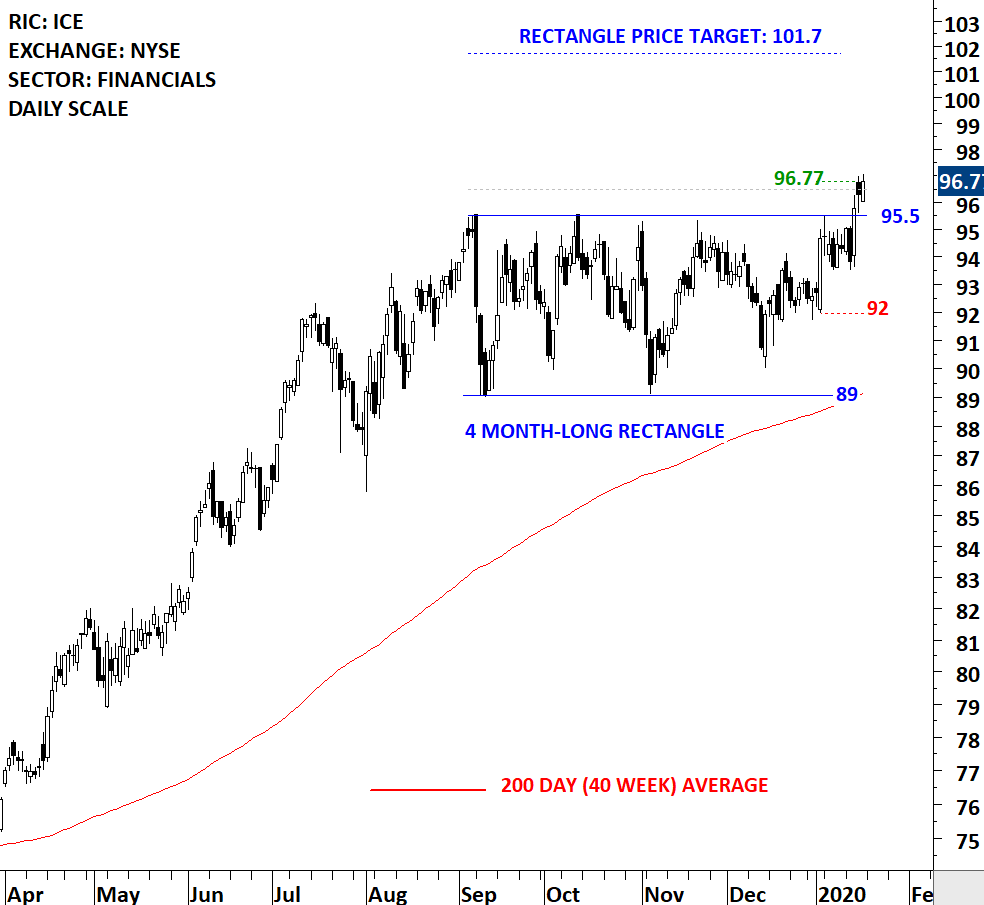
INTERCONTINENTAL EXCHANGE INC (ICE)
Intercontinental Exchange, Inc. is an operator of regulated exchanges, clearing houses and listings venues. The Company provides data services for commodity and financial markets. The stock is listed on the New York Stock Exchange. Price chart formed a 4 month-long rectangle with the horizontal boundary acting as strong resistance at 95.50 levels. The horizontal boundary was tested several times over the course of the chart pattern. The daily close above 96.50 levels confirmed the breakout from the 4 month-long rectangle with the possible chart pattern price target of 101.70 levels.
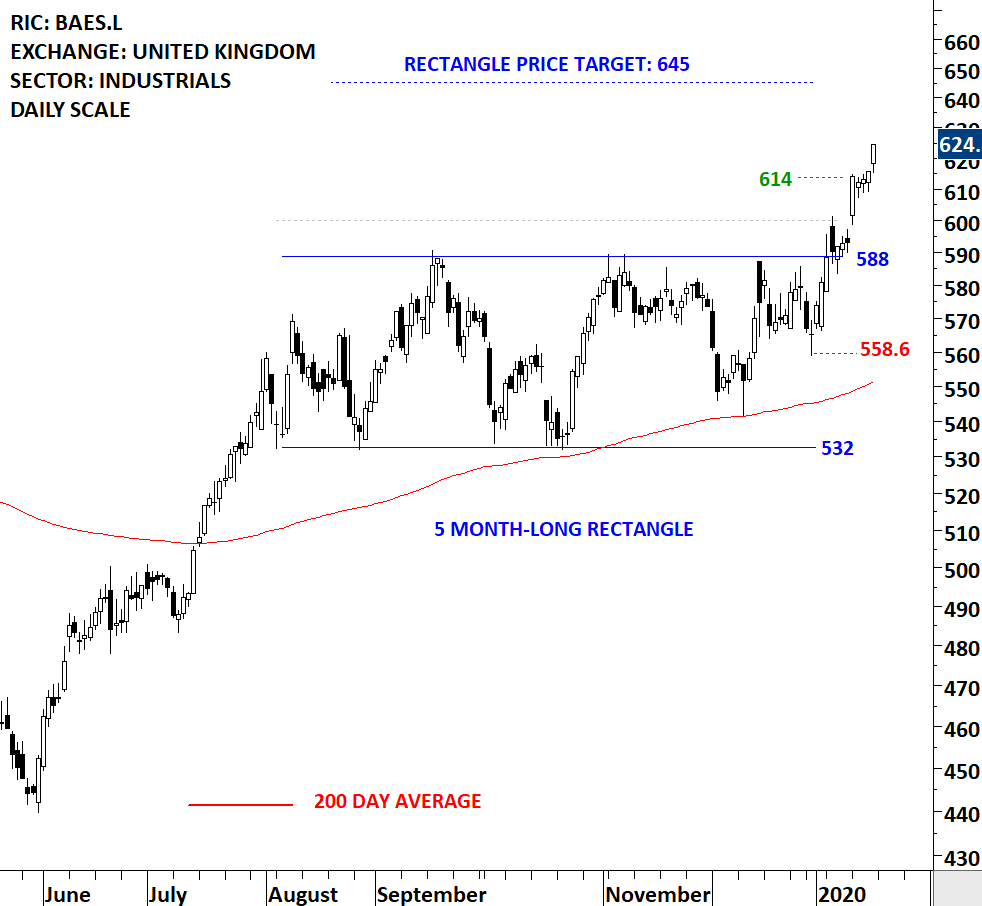
BAE SYSTEMS PLC (BAES.L)
BAE Systems plc is a defense, aerospace and security company. The stock is listed on the London Stock Exchange. Price chart formed a 5 month-long rectangle with the horizontal boundary acting as strong resistance at 588.0 levels. The horizontal boundary was tested several times over the course of the chart pattern. The daily close above 600.0 levels confirmed the breakout from the 5 month-long rectangle with the possible chart pattern price target of 645.0 levels.
What each labeling on price charts stand for:
Tech Charts Membership

By becoming a Premium Member, you’ll be able to improve your knowledge of the principles of classical charting.
With this knowledge, you can merge them with your investing system. In fact, some investors use my analyses to modify their existing style to invest more efficiently and successfully.
Get Access Now
As a Premium Member of Aksel Kibar’s Tech Charts,
You will receive:
-
Global Equities Report. Delivered weekly.
-
Classical charting principles. Learn patterns and setups.
-
Actionable information. Worldwide indices and stocks of interest.
-
Risk management advice. The important trading points of each chart.
-
Information on breakout opportunities. Identify the ones you want to take action on.
-
Video tutorials. How patterns form and why they succeed or fail.
-
Watch list alerts. As they become available so you can act quickly.
-
Breakout alerts. Usually once a week.
-
Access to everything (now and as it becomes available)
o Reports
o Videos and video series
-
Multi-part webinar course. You learn the 8 most common charting principles.
-
Webinars. Actionable and timely advice on breaking out chart patterns.
For your convenience your membership auto renews each year.
Get Access Now