“Demystifying the world of Classical Charting”
– AKSEL KIBAR

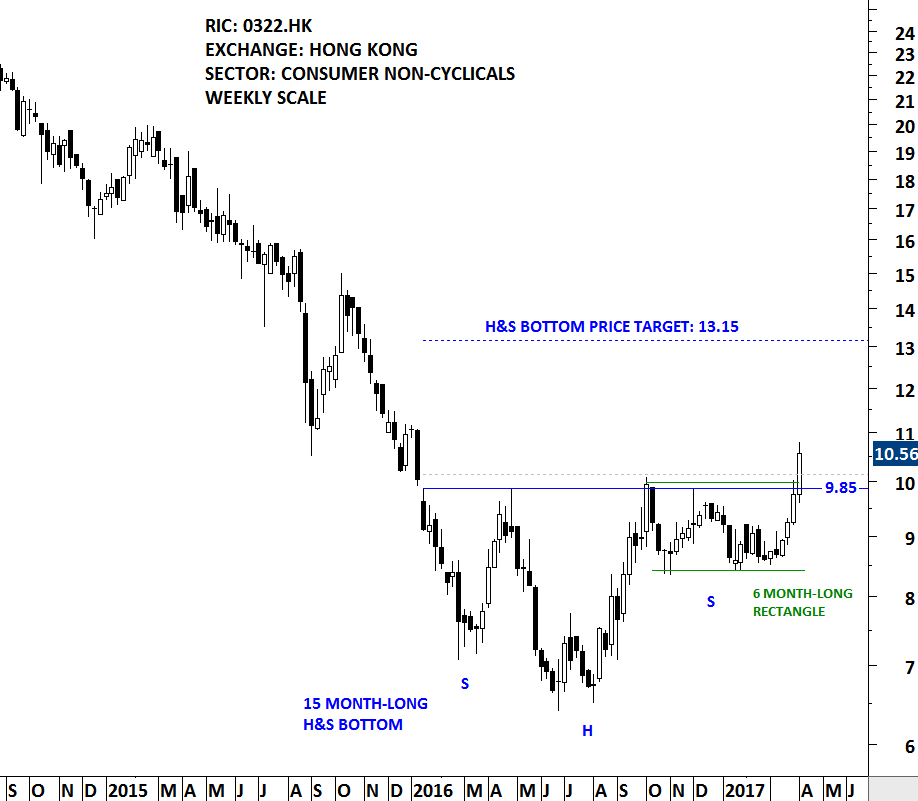
Tingyi (Cayman Islands) Holdings Corp. is a Hong Kong-based investment holding company principally engaged in the production and sales of instant noodles, beverages and instant food products. The stock is listed on the Hong Kong Stock Exchange. Price chart formed a 15 month-long H&S bottom with the right shoulder in the form of a 6 month-long rectangle. The neckline of the H&S bottom standing as a resistance at 9.85 has been tested for 4 times over the past year. The daily close above 10.15 confirmed the breakout from the multi-month base formation. 9.85 levels will now become support. Possible chart pattern price target stands at 13.15 levels.

Rectangles are usually considered to be a continuation chart pattern. They form as a trading range during a pause in the trend. The pattern is identifiable by two comparable highs and two comparable lows. Rectangles are sometimes referred to as consolidation ranges or trading areas. The rectangle chart pattern is not complete until a breakout is occurred.
To qualify as a continuation chart pattern, a prior trend should exist. Rectangles can extend for a few weeks or many months. If the pattern is less than 3 weeks, it is usually considered a flag, also a continuation chart pattern. Ideally, rectangles will develop over a 3-month period. Generally, the longer the pattern, the more significant the breakout. The direction of the next significant move can only be determined after the breakout has occurred. The estimated move is found by measuring the height of the rectangle and applying it to the breakout level.
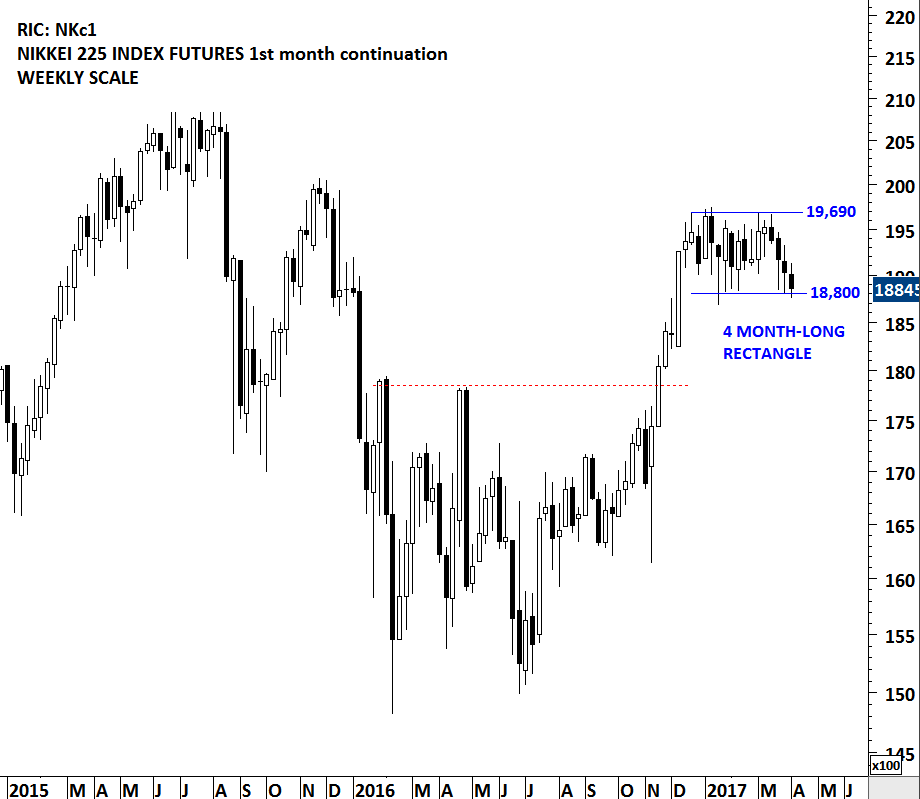
Japan's NIKKEI 225 Index is possibly forming a rectangle chart pattern with the boundaries between 18,800 and 19,690. The index is now testing the lower boundary of its 4 month-long sideways consolidation. Due to the tight consolidation range, volatility on both daily and weekly scale reached an extreme low level. These type of low volatility periods are usually followed by strong price action. It is important to note that there are times when a rectangle can act as a reversal chart pattern. A breakdown below the lower boundary at 18,800 will suggest lower prices in the coming weeks. However, failure to breakdown the support at 18,800 and a possible rebound from the current levels will increase the likelihood of a rectangle as a continuation chart pattern, targeting higher levels.

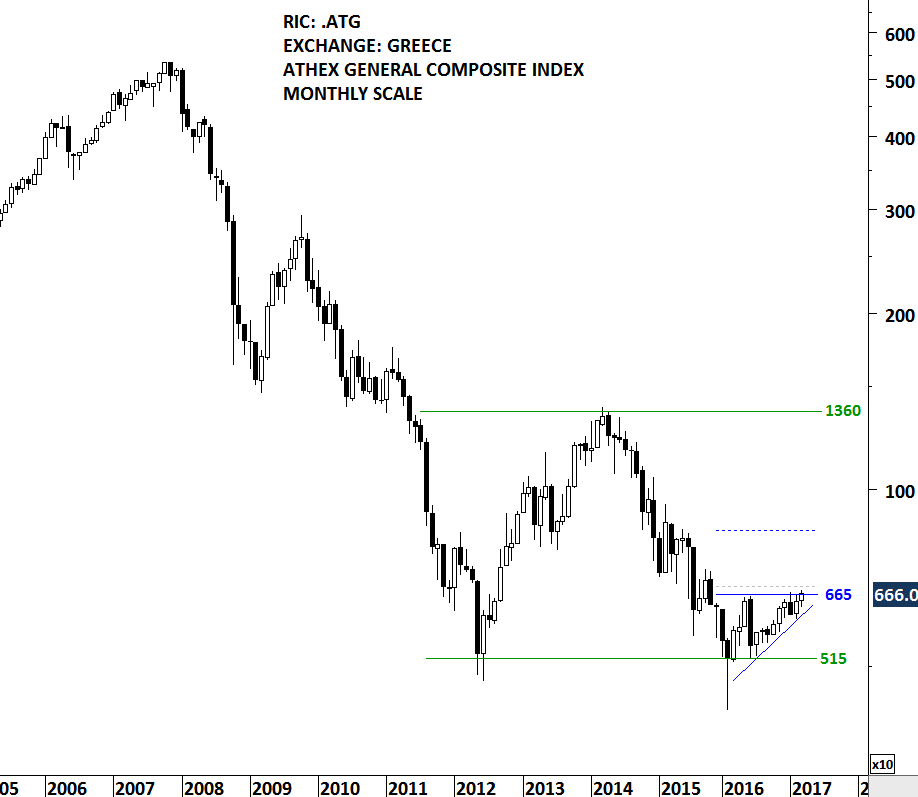
After several years of downtrend and a major bear market, Greek equities can offer great opportunities in the following weeks/months. This week's update features two benchmark equity indices from Greece. Athens General Composite index with a long-term view and FTSE Athex Market index with the latest bullish chart development. In the beginning of 2016, Athens General Index rebounded from the lows of 2012. Over the past year the index remained sideways in a choppy trading range. Last one year's range bound price action is possibly a bullish ascending triangle with the horizontal boundary standing at 445 levels for the FTSE Athex Market Index and at 665 levels for the Athens General Composite index. The upward sloping lower boundary of the ascending triangle gives the chart pattern its bullish bias. Higher lows is indicative of increasing demand. A daily close above 460 levels on the FTSE Athex Market Index will confirm the breakout from the year-long ascending triangle with a possible price target of 580 levels.
 Read More
Global equity markets continue to offer great opportunities and text book chart pattern developments. In this update I bring to your attention well-defined chart patterns from Asia, Europe, North America and Emerging Markets that are candidates for possible breakouts and I also report fresh breakout alerts. Before we move on to equity markets, I want to draw your attention to a possibility developing in the interest rates and bonds market. During the weekly review of financial markets, I spotted the similar chart development on almost all kinds of bond market ETFs.
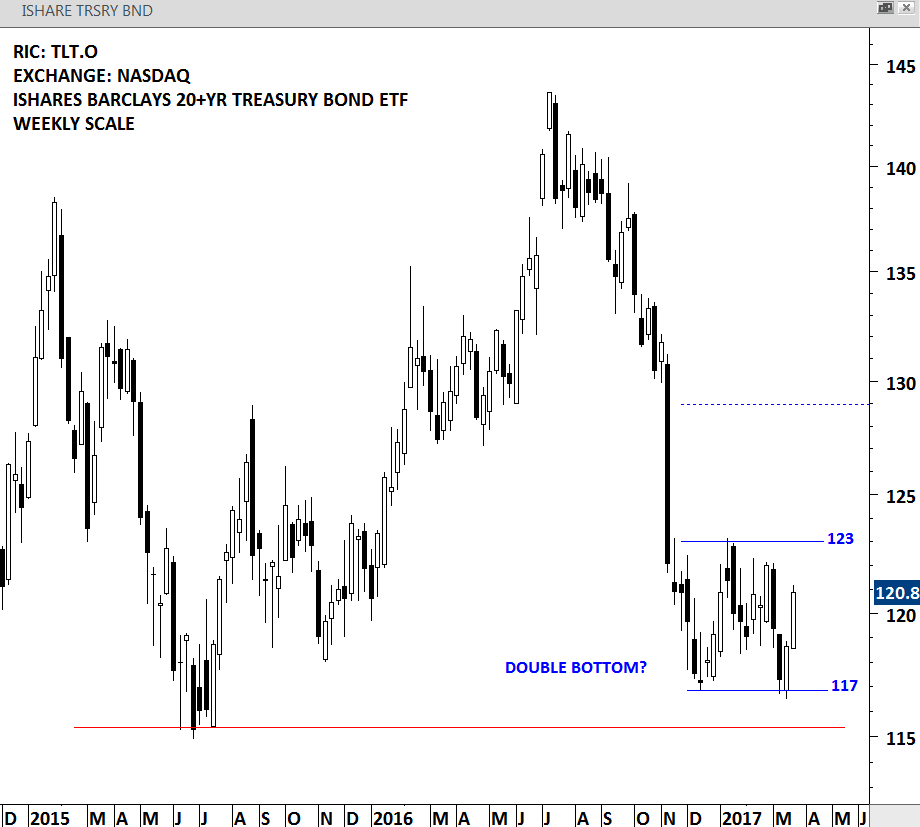
ISHARES BARCLAYS 20+YR TREASURY BOND ETF is an exchange traded fund listed on the Nasdaq Stock Exchange. The Fund seeks investment results that correspond generally to the price and yield performance of the long-term sector of the U.S. Treasury market as defined by the Barclays Capital 20+ Year Treasury Index. Price chart of this ETF is possibly forming a 4 month-long double bottom. This chart pattern is still at its early stages. The short-term consolidation remains between 117 and 123 levels. The low for the year 2015 stands at 115 as an other important medium/long-term support level. The latest chart development suggests that in the short/medium-term bonds might be finding support. Price should either break 117 levels on the downside or 123 levels on the upside for the chart pattern to complete.
 Read More
This week there has been 8 additions to the #TECHCHARTSWATCHLIST. Most of the chart patterns are bullish as major global equity indices continue to remain in an uptrend. This week's watch list includes 2 charts from the earlier updates. It is important to review the two chart set-ups that are now very close to generating chart pattern breakout signals. Below you will find the updated charts for CBO TERRITORIA SA (CBOT.PA) and INDUSTRIAL AND COMMERCIAL BANK OF CHINA (1398.HK)
Uponor Oyj is a Finland-based supplier of plumbing and heating systems. The stock is listed on the Helsinki Stock Exchange. Price chart formed a 7 month-long H&S continuation chart pattern with the strong horizontal resistance standing at 17.20 levels. H&S continuation is a bullish chart pattern. While H&S top/bottom act as a major reversal chart pattern, H&S can also form as a continuation chart pattern in an up/down trend. The H&S continuation on Uponor Oyj formed after a 7 month-long uptrend. Due to the prior uptrend, H&S continuation on this chart is expected to resolve on the upside. A daily close above 17.70 will confirm the breakout from the multi-month consolidation with a possible price target of 20.5 levels.
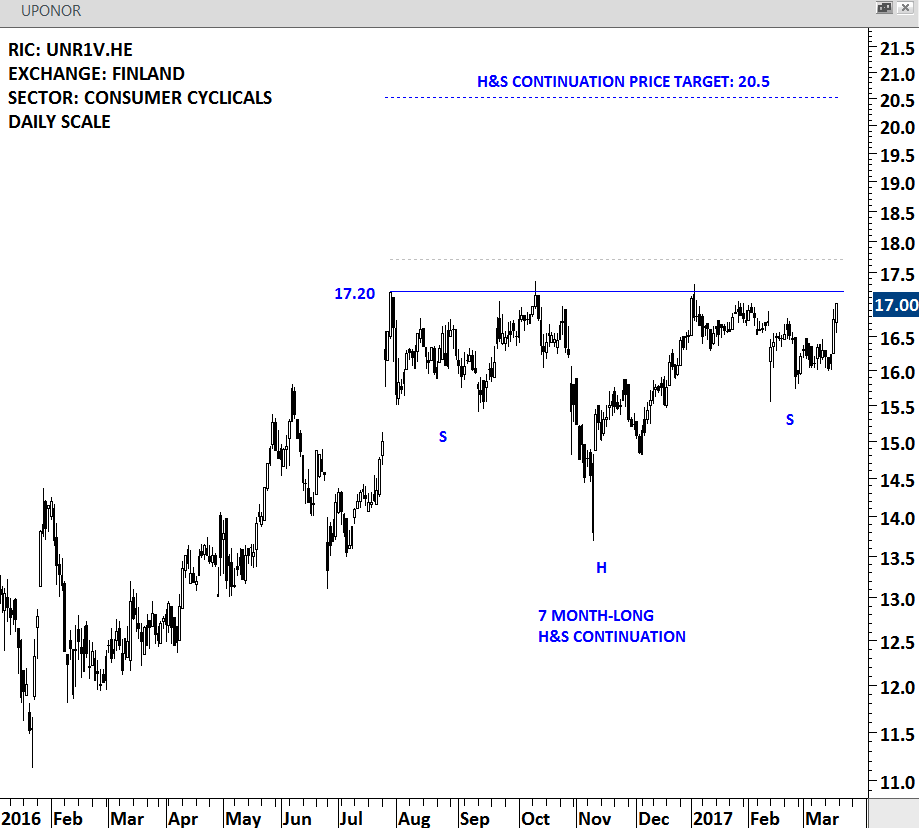
UPONOR OYJ - DAILY SCALE

This week there has been 7 additions to the #TECHCHARTSWATCHLIST. Most of the chart patterns are bullish as major global equity indices continue to remain in a uptrend.
SSY Group Limited is an investment holding company principally engaged in the research, development, manufacture and sale of pharmaceutical products. The stock is listed on the Hong Kong Stock Exchange. Price chart of SSY GROUP formed a 10 month-long rectangle with the strong horizontal resistance standing at 2.78 levels. Rectangle is a continuation chart pattern. A daily close above 2.86 will confirm the breakout from the bullish chart pattern. Possible price target for the rectangle stands at 3.2 levels.
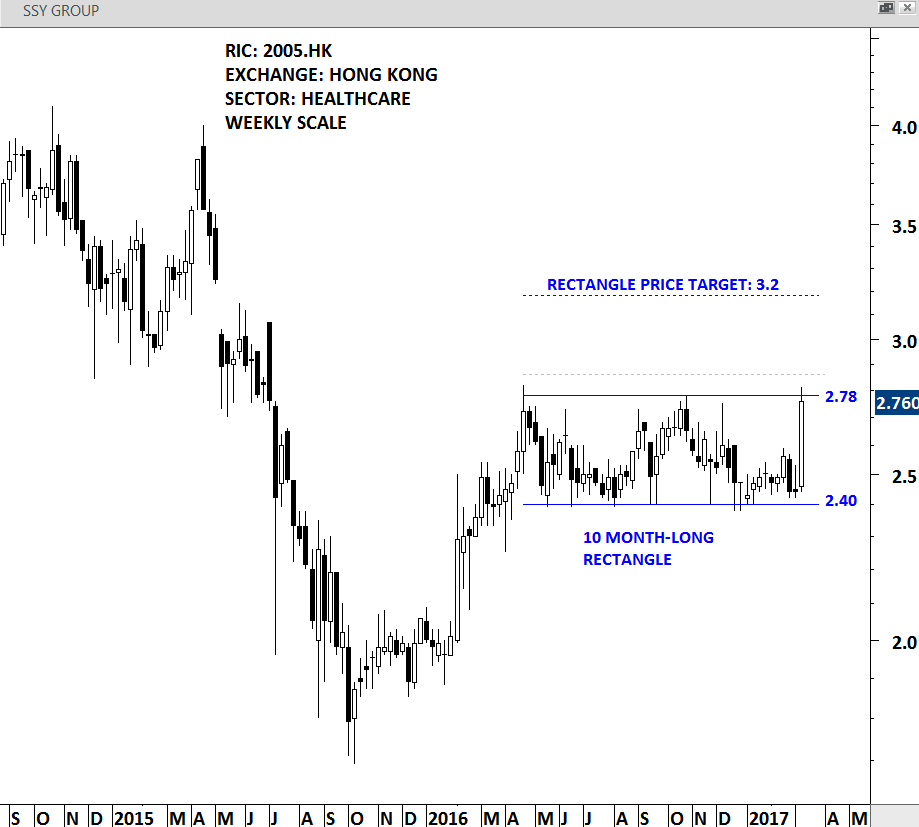
SSY GROUP - WEEKLY SCALE
The MSCI Emerging Markets index is created by Morgan Stanley Capital International (MSCI) designed to measure equity market performance in global emerging markets. It is a float-adjusted market capitalization index that consists of indices in 23 emerging economies Brazil, Chile, China, Colombia, Czech Republic, Egypt, Greece, Hungary, India, Indonesia, Korea, Malaysia, Mexico, Peru, Philippines, Poland, Qatar, Russia, South Africa, Taiwan, Thailand, Turkey and United Arab Emirates.
Initiated in 1988, the MSCI Emerging Markets Index (MSCI EMI) represented 10 nations with a total world market capitalization of less than 1%. In 2016, the index has since grown to incorporate 23 countries that comprise about 10% of global market cap. Hence, the MSCI EMI is appropriately used as a benchmark for performance by many emerging market growth mutual funds.
The iShares MSCI Emerging Markets ETF seeks to track the investment results of MSCI Emerging Markets Index. This ETF does not include any currency hedging. This means investors in this product gain exposure to the underlying securities and the currencies in which they are denominated. It is an efficient way to take advantage of trends in the emerging markets and cyclical movements related to emerging markets local currencies.
Last week's update drew attention to the developing bearish candlestick reversal pattern, a shooting star, usually suggests lower prices following its completion. This week's lower opening and weak closing confirms the short-term pull-back in emerging markets equities.
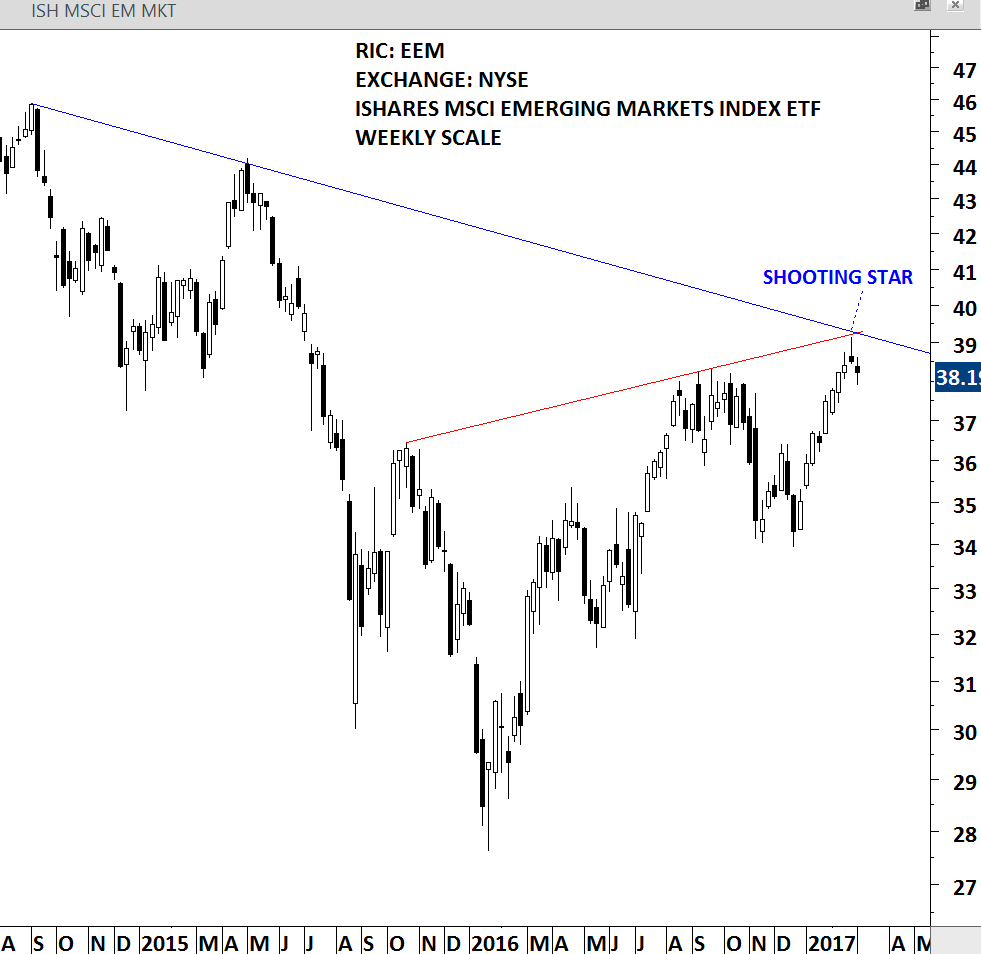
ISHARES MSCI EMERGING MARKETS ETF - WEEKLY SCALE
Compared to traditional bar charts, candlestick charts can be more helpful to analyze price action. We can see the relationship between the open and close as well as the high and low. The relationship between the open and close is considered vital information and forms the essence of candlesticks. This week's price action in global equity markets is worth analyzing with the help of candlestick chart patterns.
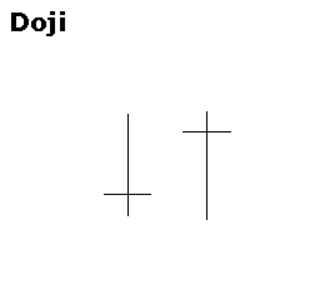
Doji are important candlesticks that provide information on their own and as components of in a number of important patterns. Doji form when a security's open and close are virtually equal. The length of the upper and lower shadows can vary and the resulting candlestick looks like a cross, inverted cross or plus sign. Alone, doji are neutral patterns. Any bullish or bearish bias is based on preceding price action and future confirmation.
Doji convey a sense of indecision between buyers and sellers. Prices move above and below the opening level during the session, but close at or near the opening level. Neither bulls nor bears were able to gain control and a turning point could be developing. The relevance of a doji depends on the preceding trend or preceding candlesticks. After an advance, or long white candlestick, a doji signals that the buying pressure is starting to weaken.
After a year-long uptrend ISHARES MSCI ALL COUNTRIES WORLD INDEX ETF (ACWI.O) reached its 2015 high levels that acted as resistance. This week's price action formed a Doji on the weekly scale chart. Given that the preceding trend was up and strong, this week's Doji clearly suggested that the buying power has stalled. Strong horizontal resistance stands at 63 levels. Global equities can experience a consolidation of the earlier gains and possibly a pullback towards the year-long upward trend line. Doji alone is not enough to forecast a reversal. Following week's price action around the strong resistance will provide valuable information.
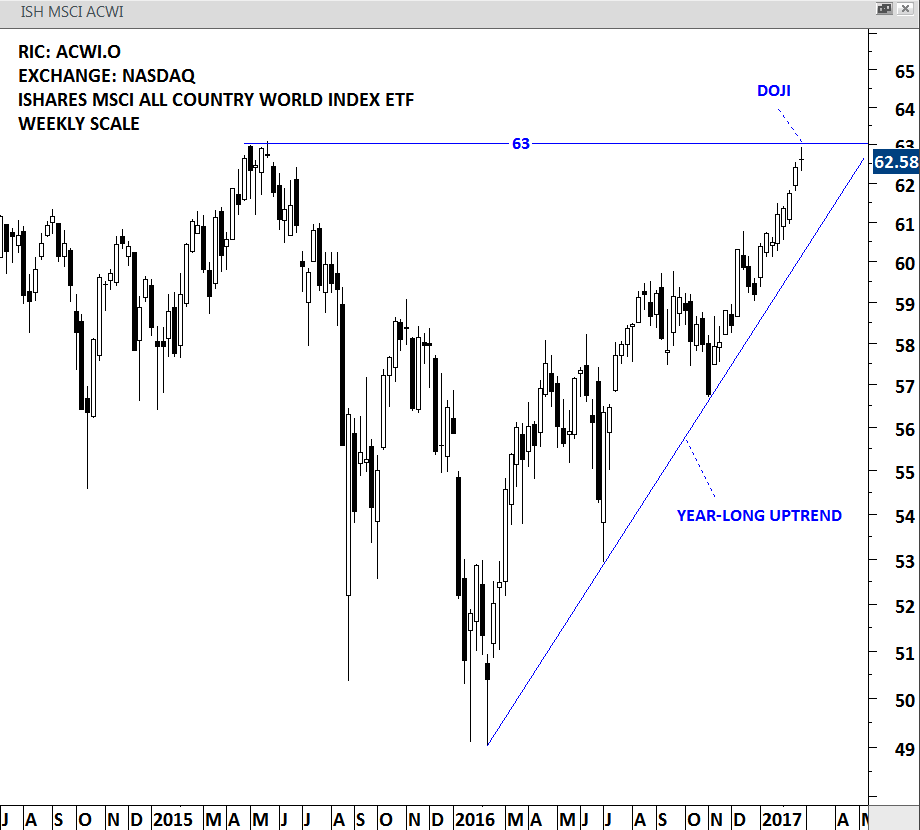
ISHARES MSCI ACWI ETF - WEEKLY SCALE
Energy prices are due for a strong directional movement after volatility reached extreme low levels. 2 month-long tight consolidation should end soon, possibly resulting in a sharp price movement. After breaking above 51.95 resistance, Brent Crude Oil entered in to a short-term sideways consolidation. Last 2 month's price action remained range bound between 52.50 and 56.10. Breakout above 56.10 will add further momentum to Brent Crude oil prices that are already in a uptrend for the past year.
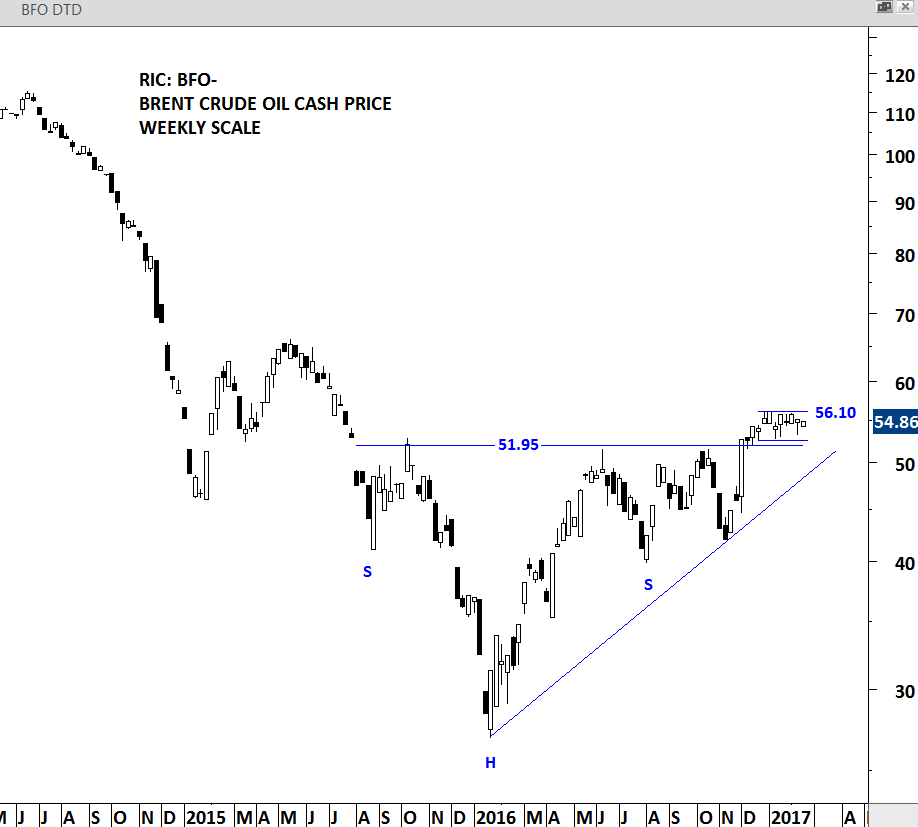
BRENT CRUDE OIL - WEEKLY SCALE
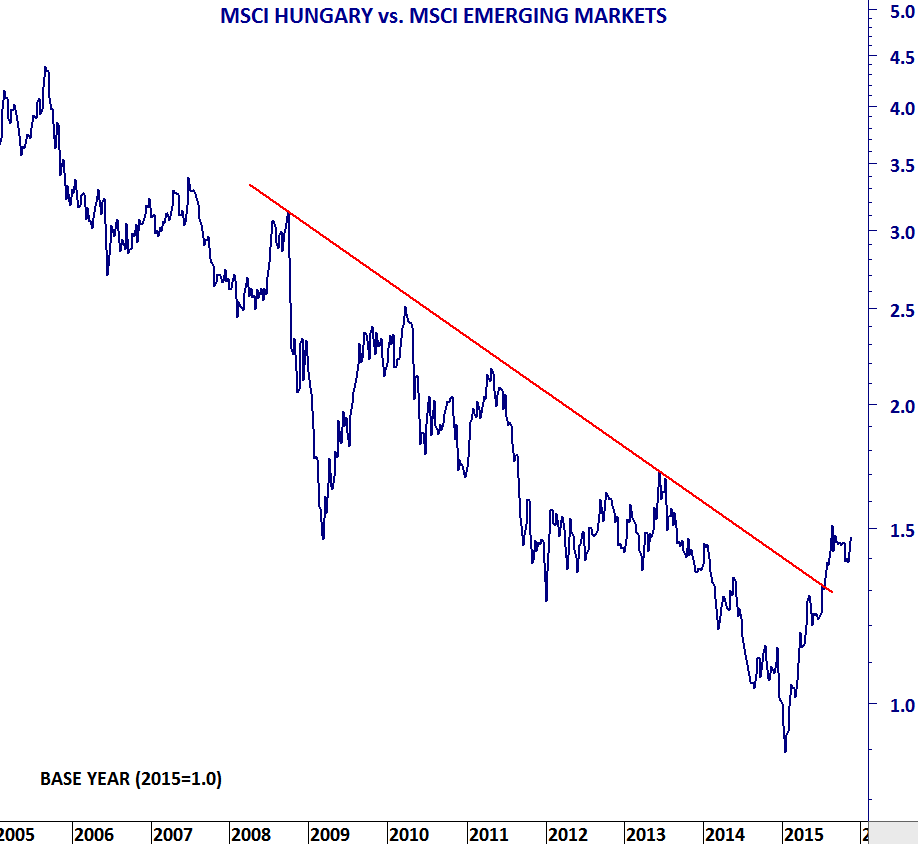
Since the beginning of 2011, developed market equities have been performing better than emerging markets. This trend is still intact.
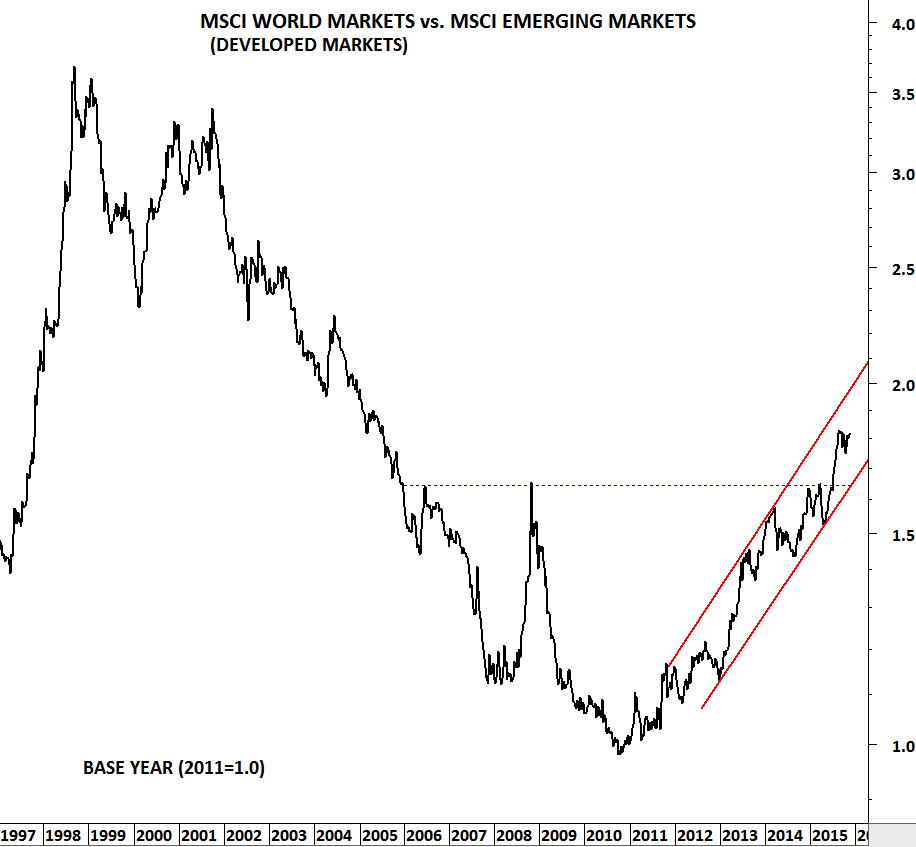
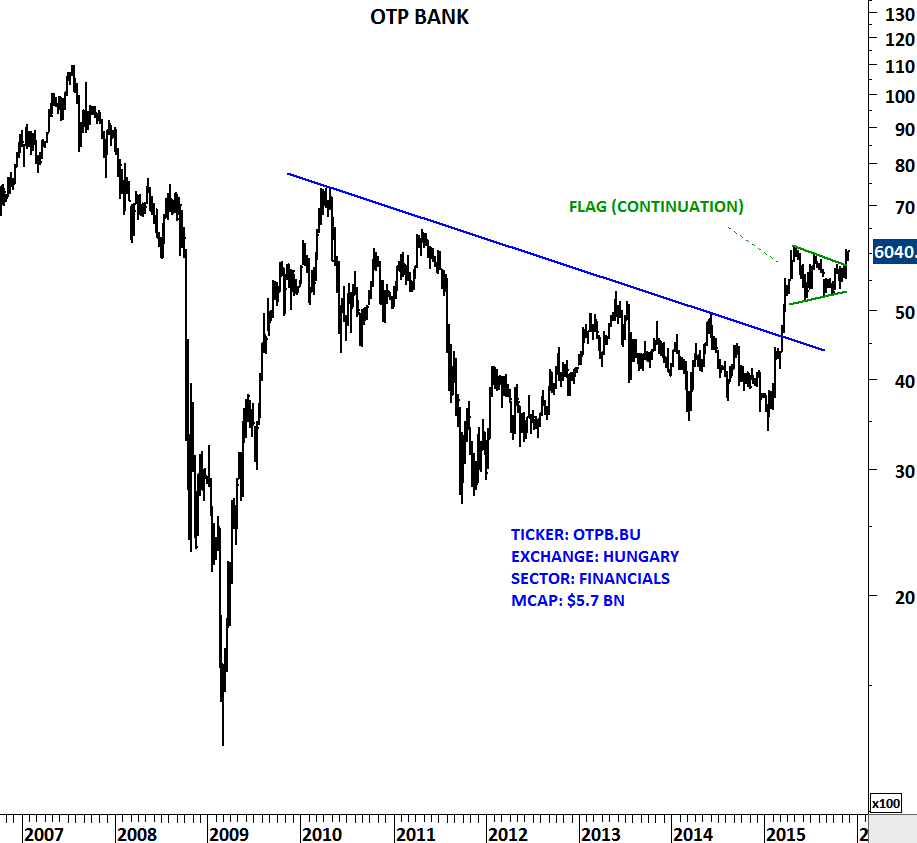
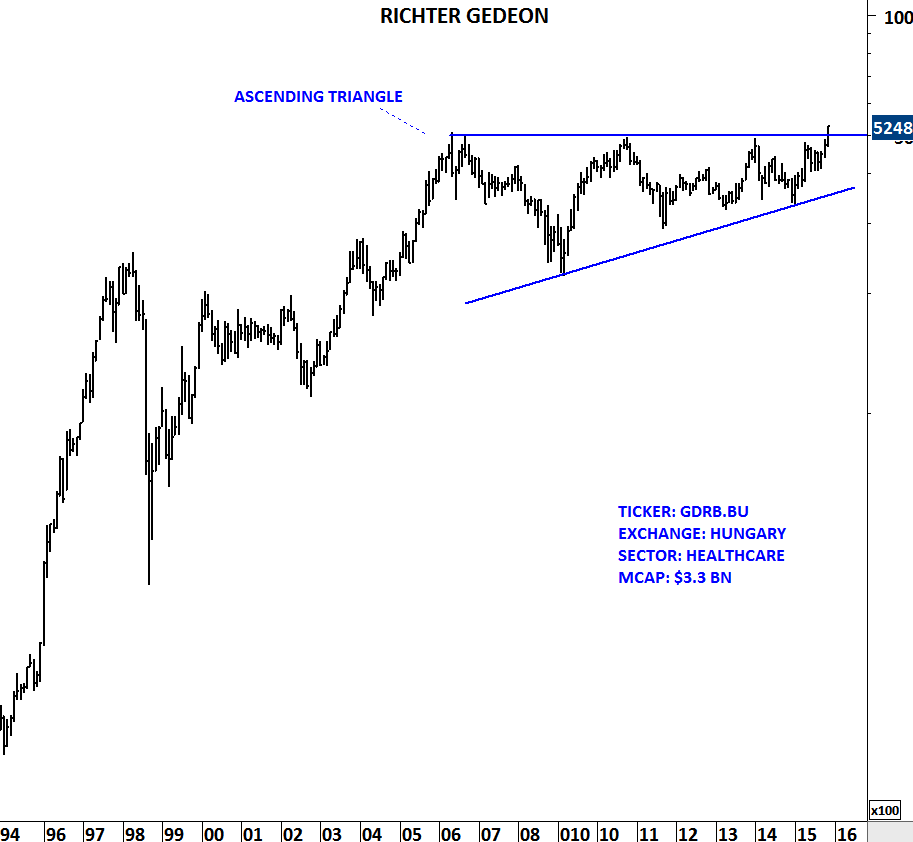
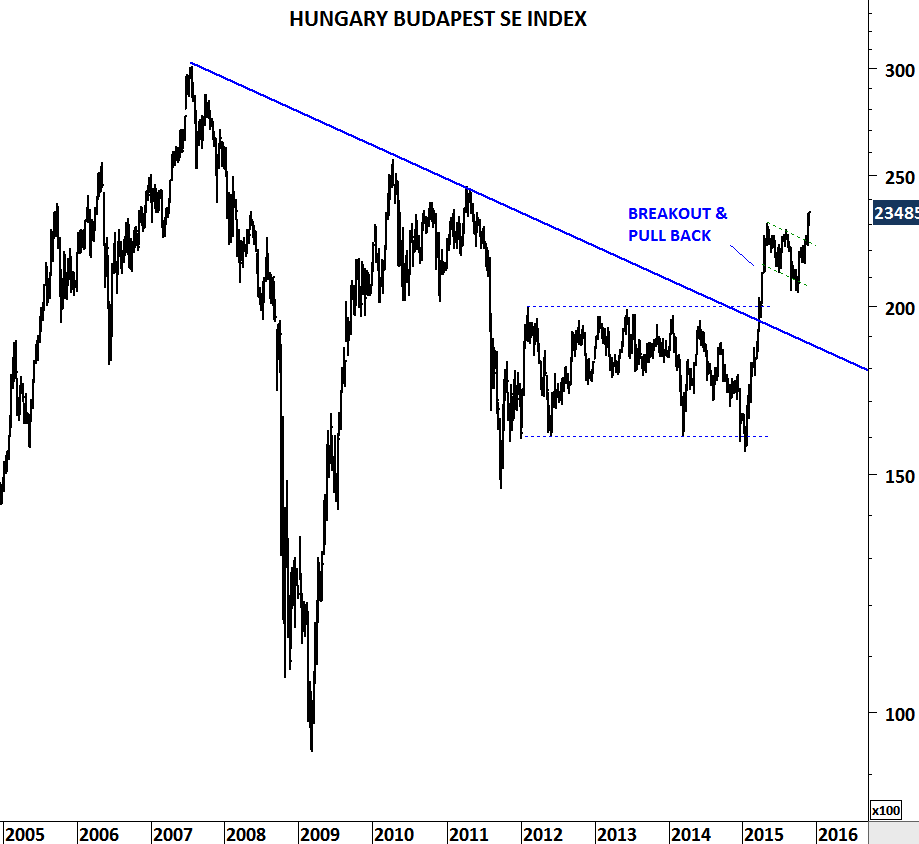
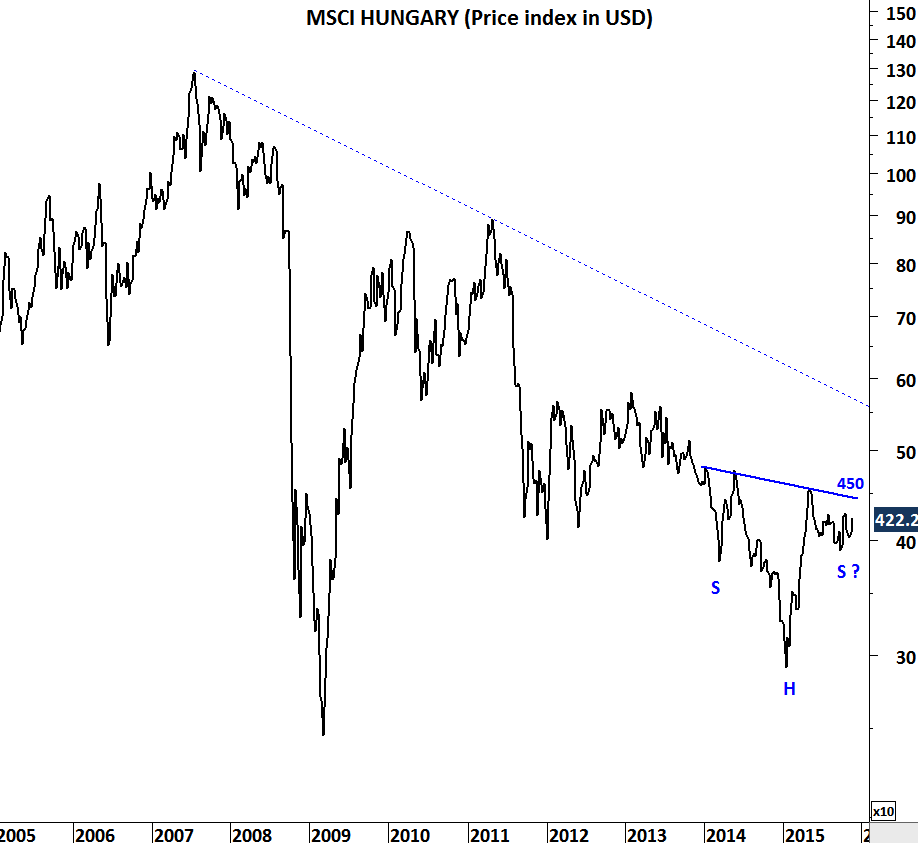
Though there is one emerging European equity market that is showing clear strength against its peers. That is HUNGARY. Budapest SE index is ready for another upward leg, after an initial breakout followed by a pullback.
Since the beginning of the year MSCI Hungary has been outperforming MSCI emerging markets index. Also, a major reversal chart pattern; head and shoulder bottom, might be developing on the MSCI HUNGARY price index. These are bullish sign for the emerging European country.
Two charts from the constituents of Budapest SE index have positive technical outlook:
OTP BANK formed a flag (or symmetrical triangle) continuation chart pattern.
RICHTER GEDEON formed a massive bullish ascending triangle.
Breakouts from these chart patterns should resume existing uptrends.