“Demystifying the world of Classical Charting”
– AKSEL KIBAR
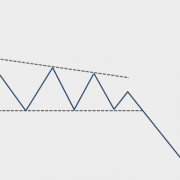
Every week Tech Charts Global Equity Markets report features some of the well-defined, mature classical chart patterns under a lengthy watchlist and the chart pattern breakout signals that took place during that week. Global Equity Markets report covers single stocks from developed, emerging and frontier markets, ETF’s and global equity indices. The report starts with a review section that highlights the important chart developments on global equity benchmarks. This blog post features from the watchlist section a bearish descending triangle that is completing on the downside. Descending triangle is a bearish chart pattern with a downward sloping upper boundary. Trading in the first two days of the week confirmed the breakdown from the 14 month-long bearish continuation chart pattern.
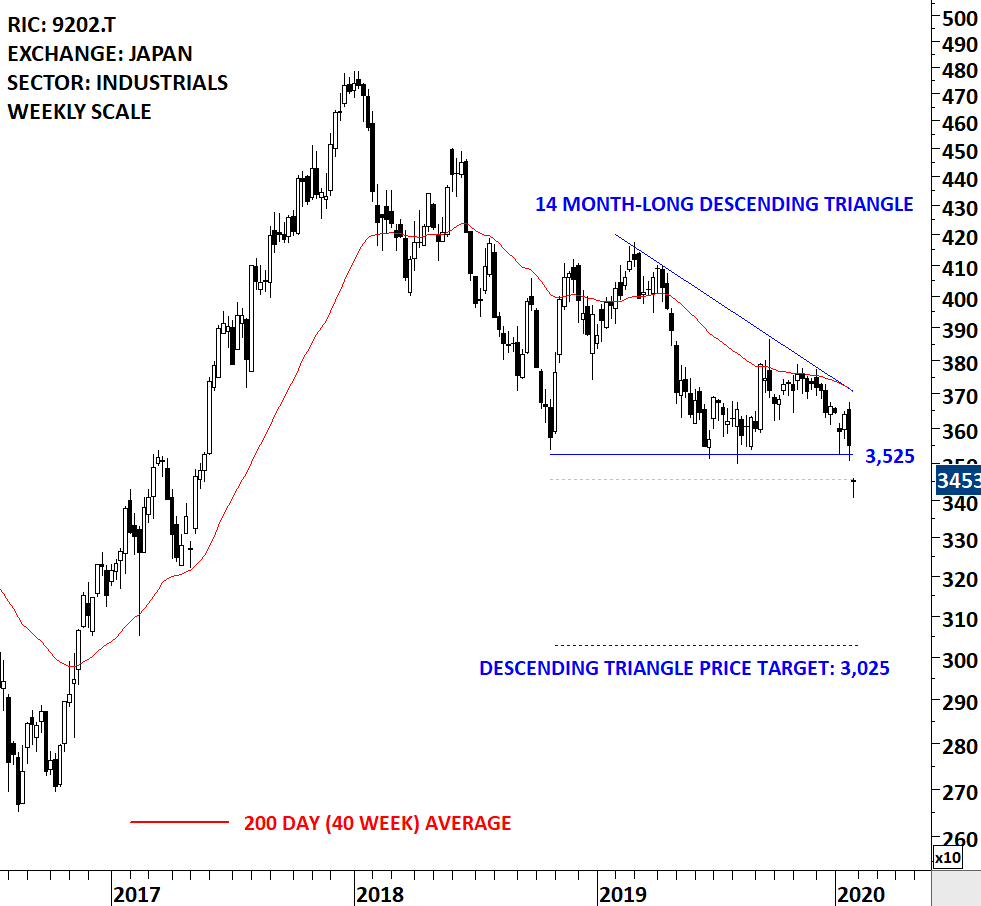
ANA HOLDINGS INC. is a Japan-based holding company principally engaged in the aviation business. The stock is listed on the Tokyo Stock Exchange. Price chart formed a 14 month-long descending triangle with the horizontal boundary acting as strong support at 3,525.0 levels. The horizontal boundary was tested several times over the course of the chart pattern. The daily close below 3,455.0 levels confirmed the breakdown from the 14 month-long descending triangle with the possible chart pattern price target of 3,025.0 levels. Data as of 28/01/2020. Please note that the last bar on the weekly scale price chart includes two days of trading.

By becoming a Premium Member, you’ll be able to improve your knowledge of the principles of classical charting.
With this knowledge, you can merge them with your investing system. In fact, some investors use my analyses to modify their existing style to invest more efficiently and successfully.
You will receive:
For your convenience your membership auto renews each year.
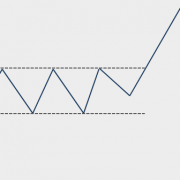
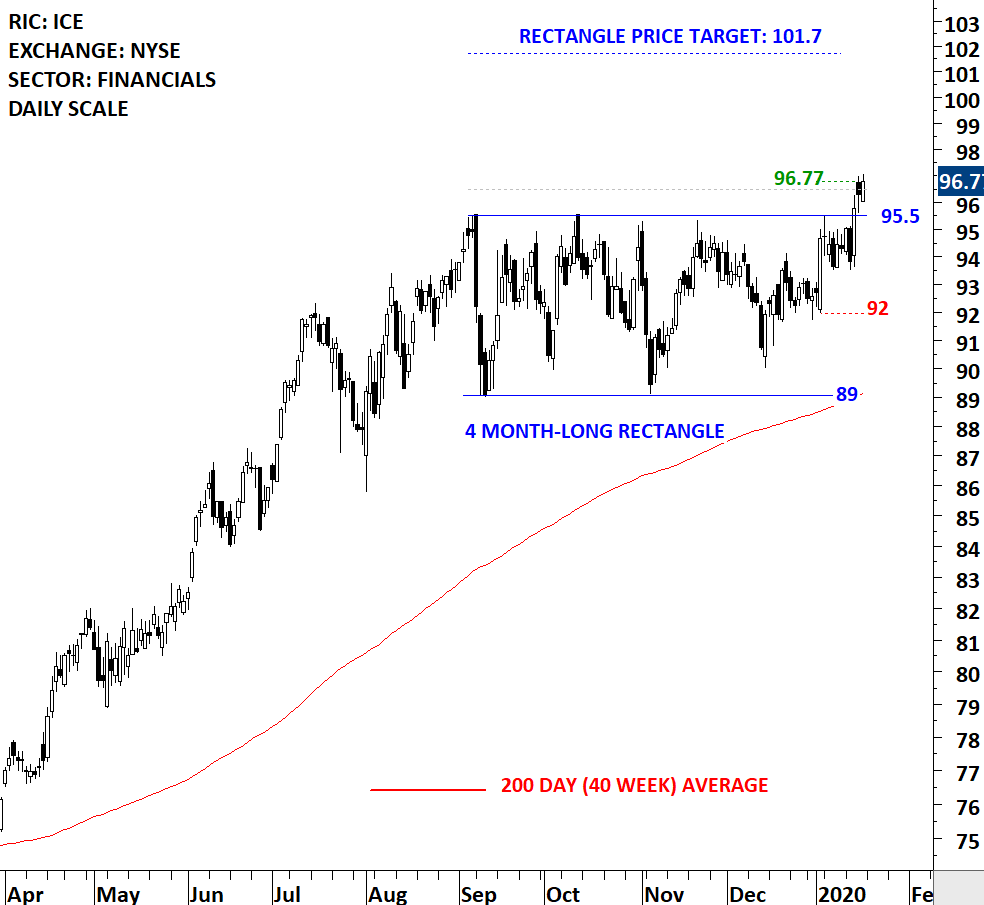
Every week Tech Charts Global Equity Markets report features some of the well-defined, mature classical chart patterns under a lengthy watchlist and the chart pattern breakout signals that took place during that week. Global Equity Markets report covers single stocks from developed, emerging and frontier markets, ETF’s and global equity indices. The report starts with a review section that highlights the important chart developments on global equity benchmarks. This blog post features from the breakouts section some of the text-book rectangle chart pattern breakouts. Rectangle is one of my favorite classical chart pattern. It has well-defined boundaries. It is easier to identify on price charts. Usually before the breakout takes place price has several tests of the chart pattern boundary. Breakouts after several tests of pattern boundary are usually powerful and are followed by strong trends.
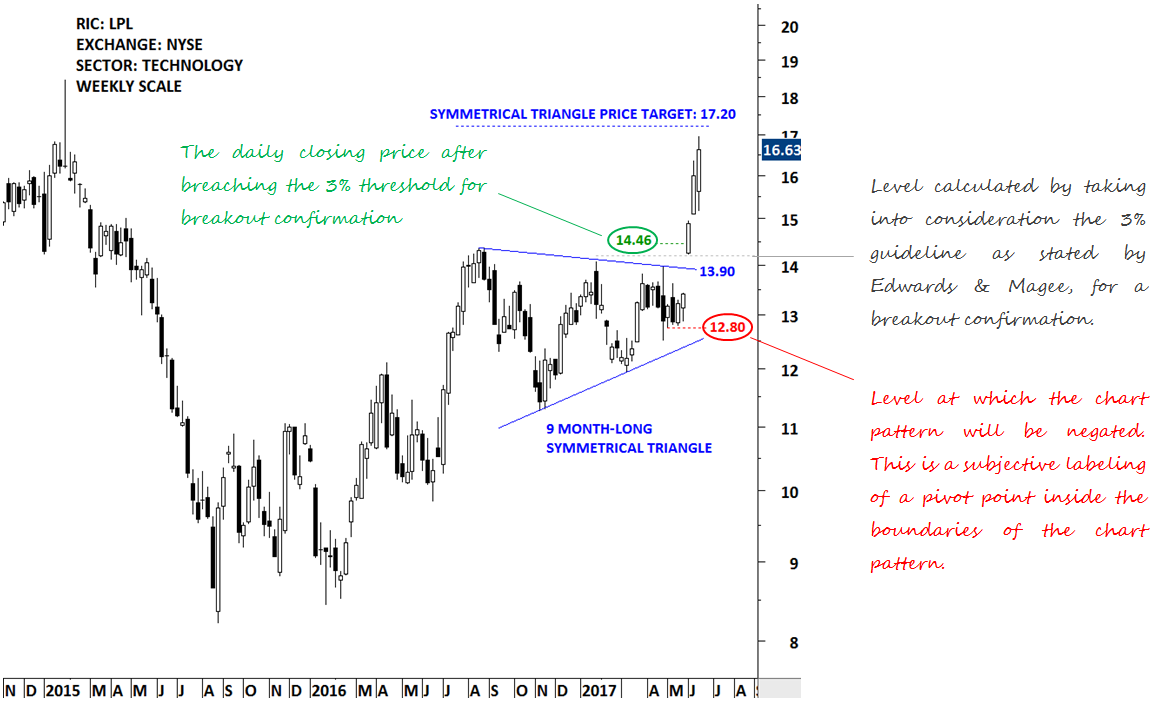
A quick note for our new followers; the red lines on price charts are not provided as stop-loss levels. While they can be used as stop-loss, they are actually a subjective level for chart pattern negation. Chart pattern negation is different than a stop-loss. A stop-loss can be placed below the chart pattern boundary tighter or wider depending on your risk profile and other factors. I attached below a chart that explains each labeling on price charts.
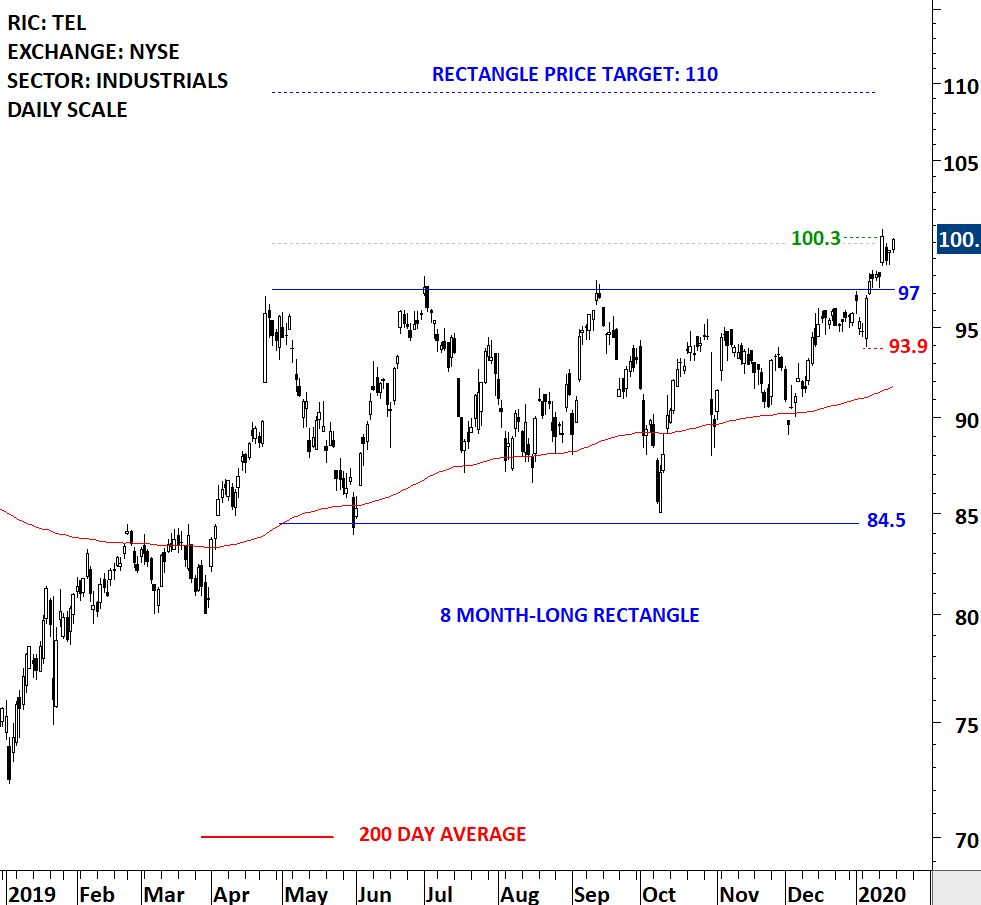
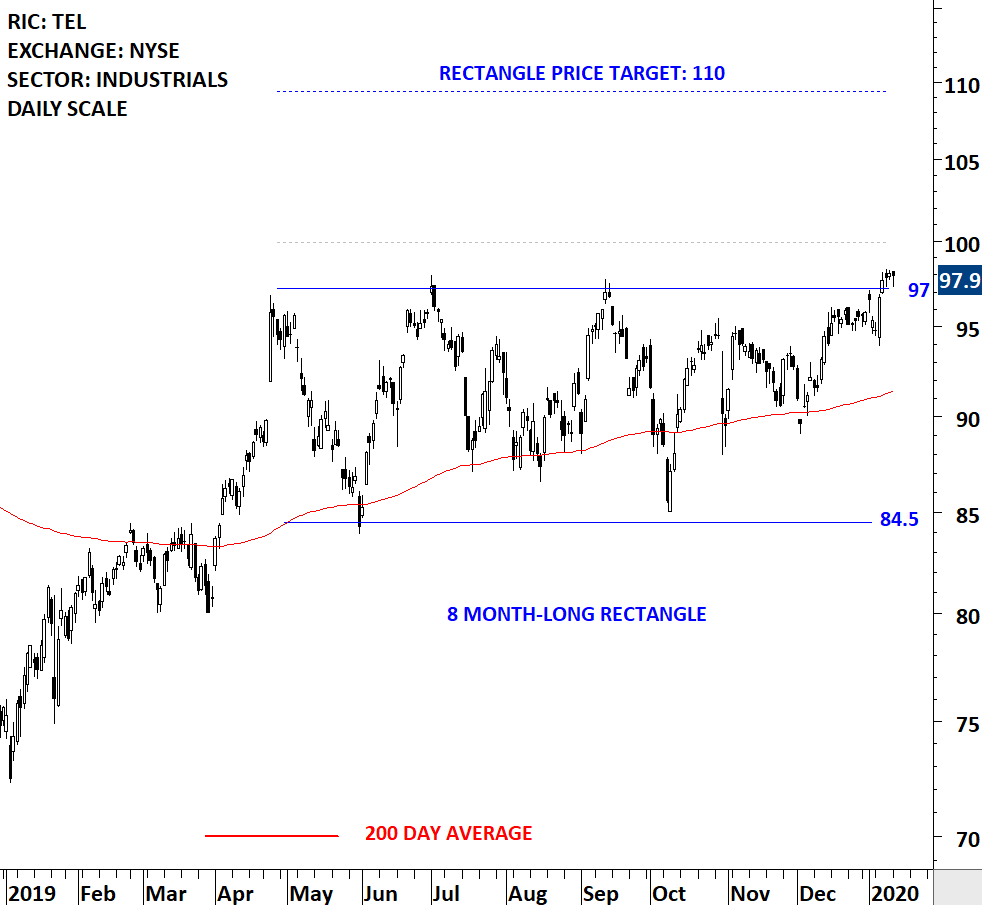
TE Connectivity Ltd. is a technology company. The Company designs and manufactures connectivity and sensors solutions. The stock is listed on the New York Stock Exchange. Price chart formed a 8 month-long ascending triangle with the horizontal boundary acting as strong resistance at 97.0 levels. The horizontal boundary was tested several times over the course of the chart pattern. The daily close above 100.0 levels confirmed the breakout from the 8 month-long ascending triangle with the possible chart pattern price target of 110.0 levels.
Intercontinental Exchange, Inc. is an operator of regulated exchanges, clearing houses and listings venues. The Company provides data services for commodity and financial markets. The stock is listed on the New York Stock Exchange. Price chart formed a 4 month-long rectangle with the horizontal boundary acting as strong resistance at 95.50 levels. The horizontal boundary was tested several times over the course of the chart pattern. The daily close above 96.50 levels confirmed the breakout from the 4 month-long rectangle with the possible chart pattern price target of 101.70 levels.
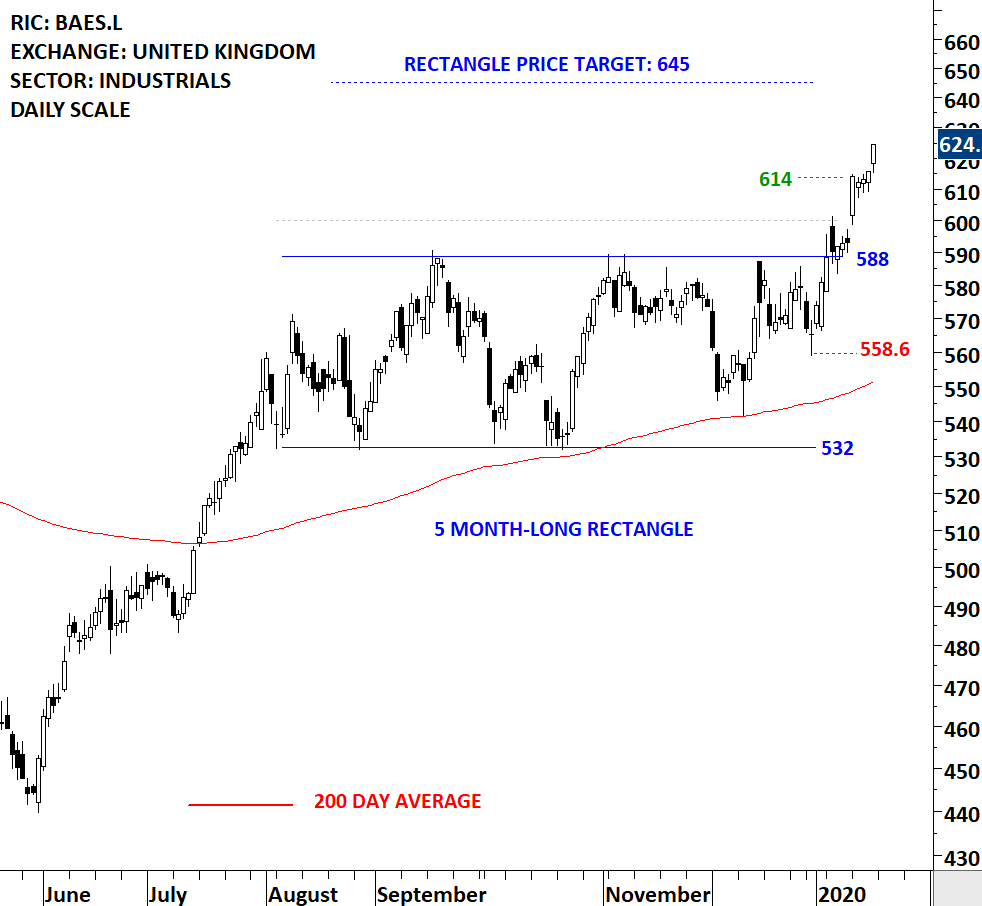
BAE Systems plc is a defense, aerospace and security company. The stock is listed on the London Stock Exchange. Price chart formed a 5 month-long rectangle with the horizontal boundary acting as strong resistance at 588.0 levels. The horizontal boundary was tested several times over the course of the chart pattern. The daily close above 600.0 levels confirmed the breakout from the 5 month-long rectangle with the possible chart pattern price target of 645.0 levels.
By becoming a Premium Member, you’ll be able to improve your knowledge of the principles of classical charting.
With this knowledge, you can merge them with your investing system. In fact, some investors use my analyses to modify their existing style to invest more efficiently and successfully.
You will receive:
For your convenience your membership auto renews each year.

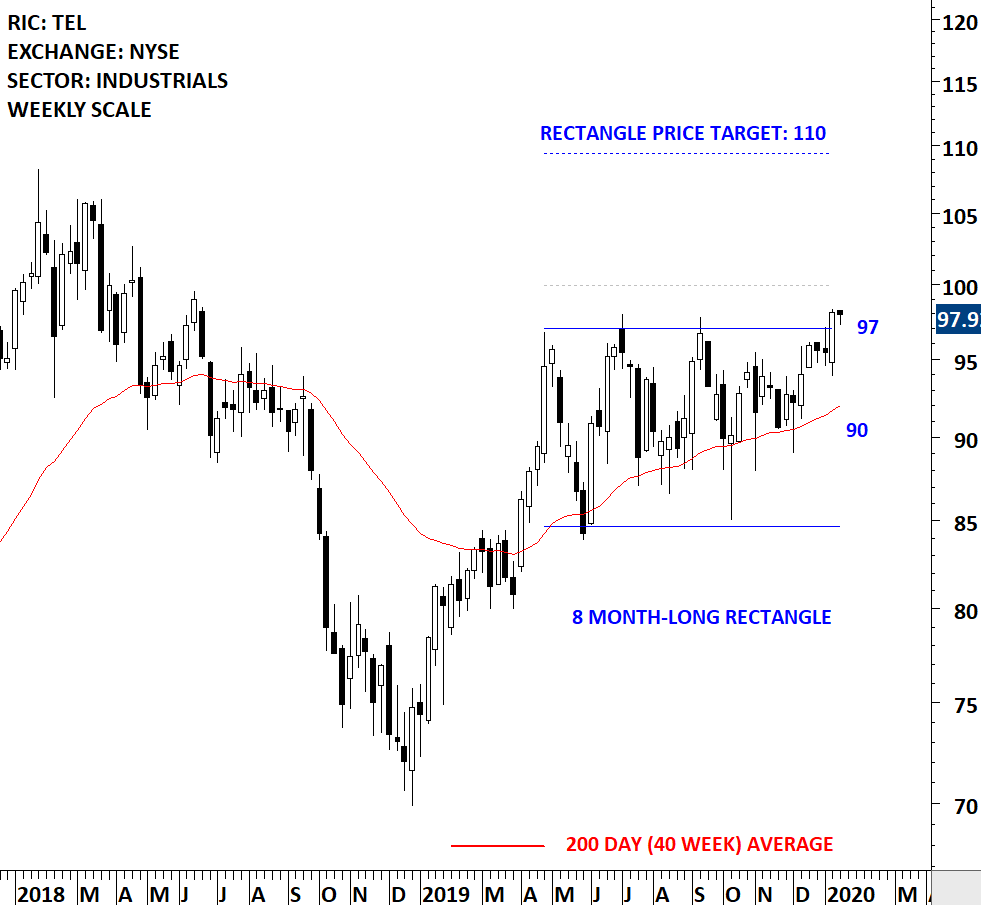
Every week Tech Charts Global Equity Markets report features some of the well-defined, mature classical chart patterns under a lengthy watchlist and the chart pattern breakout signals that took place during that week. Global Equity Markets report covers single stocks from developed, emerging and frontier markets, ETF’s and global equity indices. The report starts with a review section that highlights the important chart developments on global equity benchmarks. This blog post features from the watchlist section a rectangle chart pattern opportunity, listed on the New York Stock Exchange.
Both the weekly and daily scale price charts are featured below.
TE Connectivity Ltd. is a technology company. The Company designs and manufactures connectivity and sensors solutions. The stock is listed on the New York Stock Exchange. Price chart formed an 8 month-long rectangle with the horizontal boundary acting as strong resistance at 97.0 levels. The horizontal boundary was tested several times over the course of the chart pattern. A daily close above 100.0 levels will confirm the breakout from the 8 month-long rectangle with the possible chart pattern price target of 110.0 levels. (Data as of 13/01/2020) Last candlestick of the weekly scale price chart includes only one trading session (Monday).
By becoming a Premium Member, you’ll be able to improve your knowledge of the principles of classical charting.
With this knowledge, you can merge them with your investing system. In fact, some investors use my analyses to modify their existing style to invest more efficiently and successfully.
You will receive:
For your convenience your membership auto renews each year.

Please enjoy this Tech Charts Member webinar recorded live December 12, 2019
Short-Term Chart Patterns - December 2019 Tech Charts Webinar
This webinar is a discussion on chart patterns that develop and complete on a short-term time frame, in the duration between 1 month to 3 months.
Webinar Outline
Live questions from Members

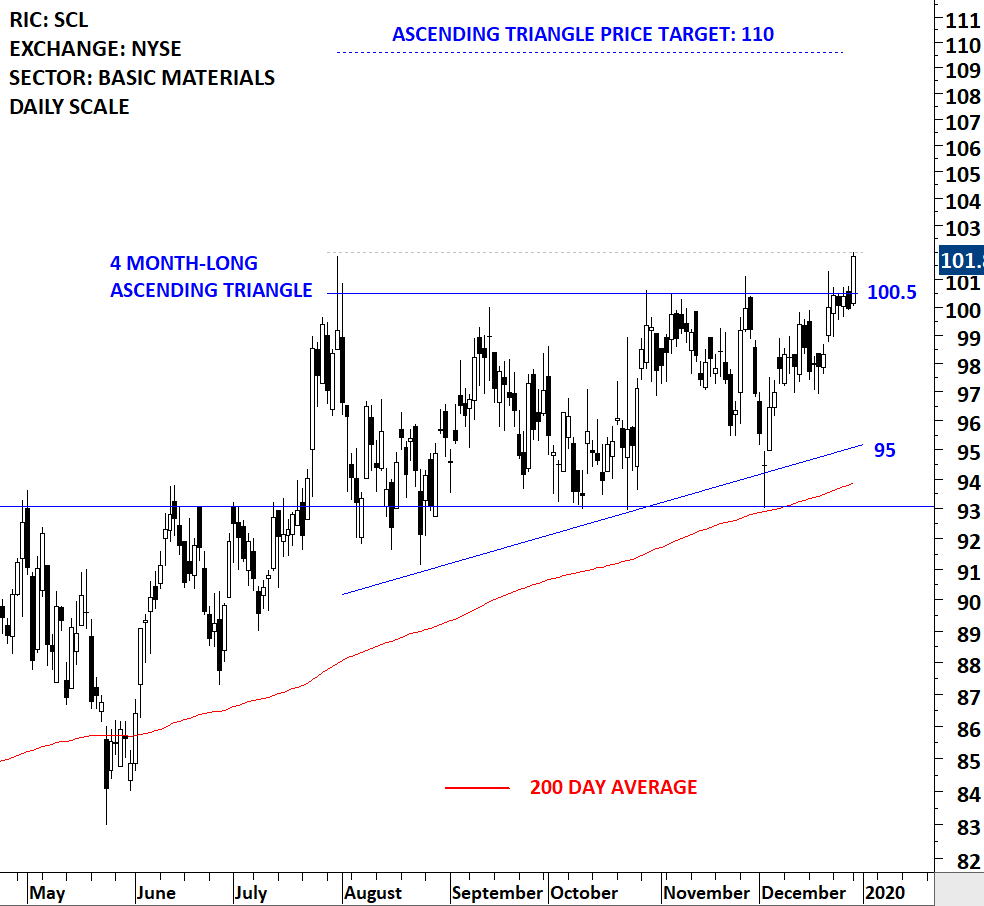
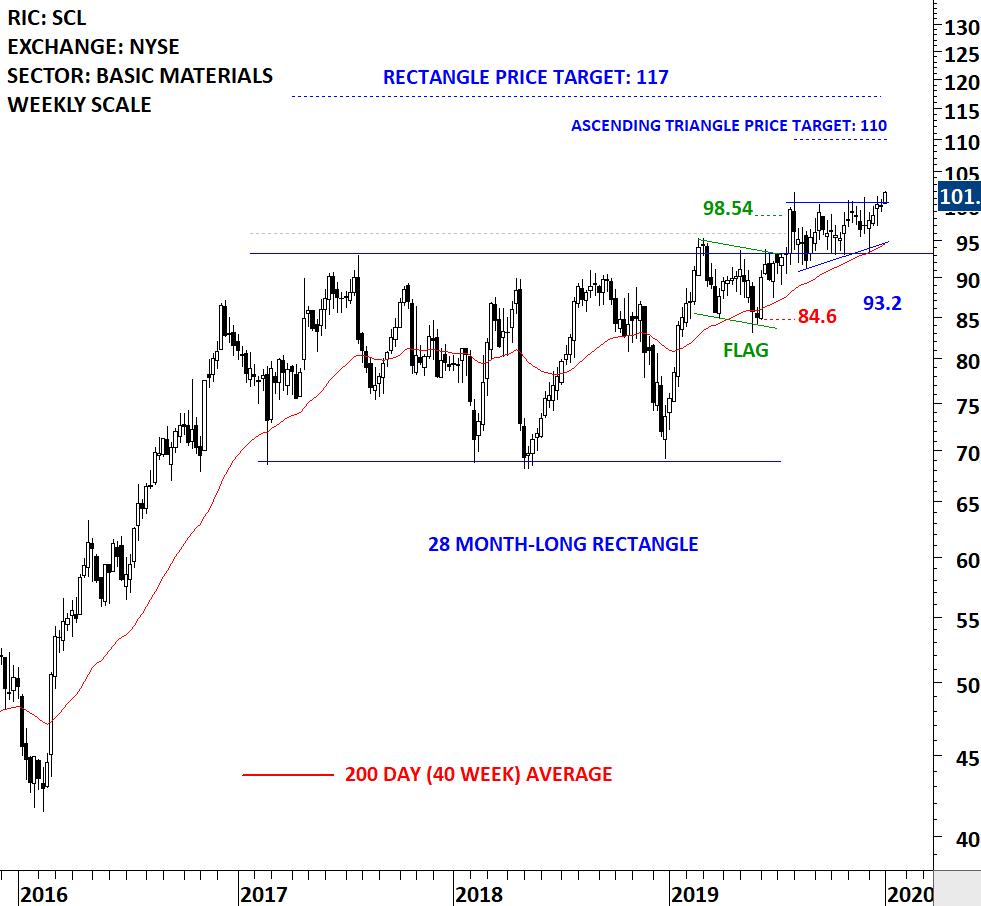
Every week Tech Charts Global Equity Markets report features some of the well-defined, mature classical chart patterns under a lengthy watchlist and the chart pattern breakout signals that took place during that week. Global Equity Markets report covers single stocks from developed, emerging and frontier markets, ETF’s and global equity indices. The report starts with a review section that highlights the important chart developments on global equity benchmarks. This blog post features from the watchlist section an ascending triangle chart pattern opportunity, listed on the New York Stock Exchange. Stepan Company was featured before as part of Breakout Alerts when the stock completed the 28 month-long rectangle. However since then, price formed another sideways consolidation above the horizontal support (upper boundary of the rectangle). The chart pattern is possibly an ascending triangle (bullish continuation) that can resume the existing uptrend.
Below you can also find a short educational video explaining how several bullish chart patterns can form during a steady uptrend.
Stepan Company produces specialty and intermediate chemicals, which are sold to other manufacturers and used in a range of end products. The stock is listed on the New York Stock Exchange. Price chart formed a 4 month-long ascending triangle with the horizontal boundary acting as strong resistance at 100.5 levels. The horizontal boundary was tested several times over the course of the chart pattern. A daily close above 102.0 levels will confirm the breakout from the 4 month-long ascending triangle with the possible chart pattern price target of 110.0 levels. Breakout can push the stock to all-time highs.
A short educational video explaining formation of several bullish chart patterns in an uptrend
By becoming a Premium Member, you’ll be able to improve your knowledge of the principles of classical charting.
With this knowledge, you can merge them with your investing system. In fact, some investors use my analyses to modify their existing style to invest more efficiently and successfully.
You will receive:
For your convenience your membership auto renews each year.
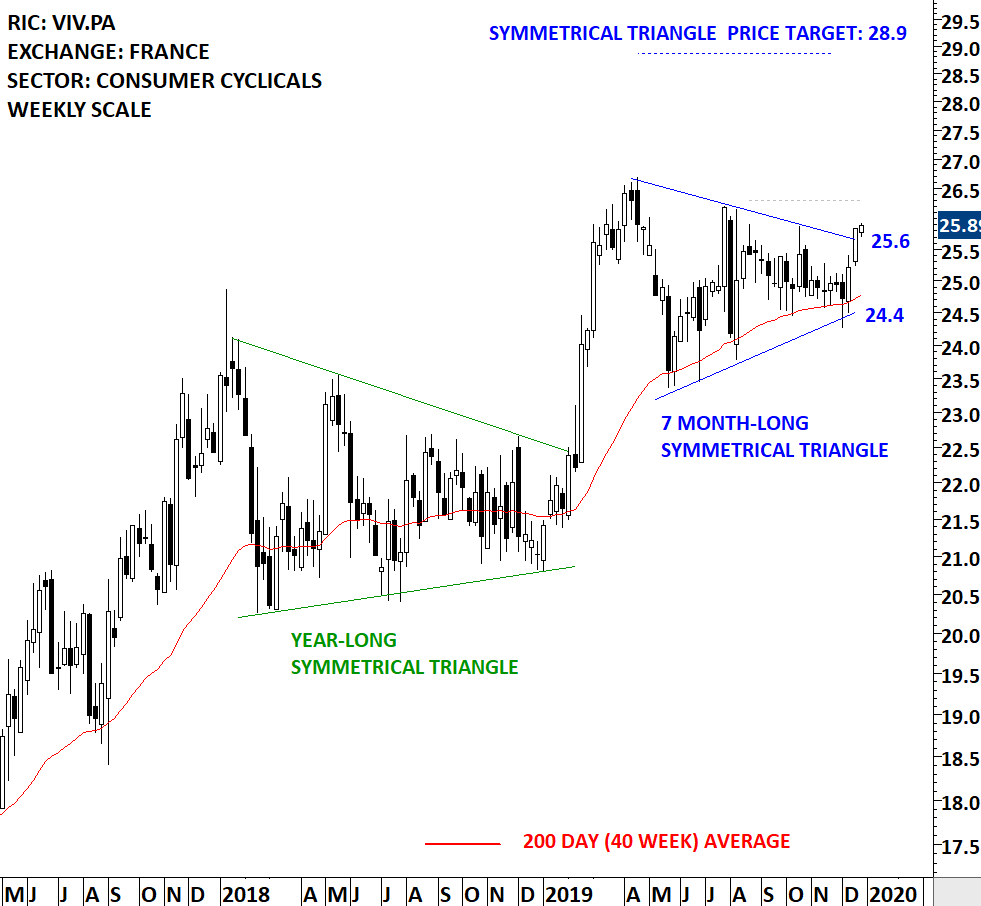
Every week Tech Charts Global Equity Markets report features some of the well-defined, mature classical chart patterns under a lengthy watchlist and the chart pattern breakout signals that took place during that week. Global Equity Markets report covers single stocks from developed, emerging and frontier markets, ETF’s and global equity indices. The report starts with a review section that highlights the important chart developments on global equity benchmarks. This blog post features from the watchlist section a symmetrical triangle chart pattern opportunity, listed on the Paris Stock Exchange.
Vivendi SA is a France-based company engaged in media and content businesses. It operates businesses throughout the media value chain, from talent discovery to the creation, production and distribution of content. The stock is listed on the Paris Stock Exchange. Price chart formed a 7 month-long symmetrical triangle with the upper boundary acting as strong resistance at 25.75 levels. The upper boundary was tested several times over the course of the chart pattern. A daily close above 26.3 levels will confirm the breakout from the 7 month-long symmetrical triangle with the possible chart pattern price target of 28.9 levels. (Data as of December 23, 2019, 11:45 AM)
By becoming a Premium Member, you’ll be able to improve your knowledge of the principles of classical charting.
With this knowledge, you can merge them with your investing system. In fact, some investors use my analyses to modify their existing style to invest more efficiently and successfully.
You will receive:
For your convenience your membership auto renews each year.

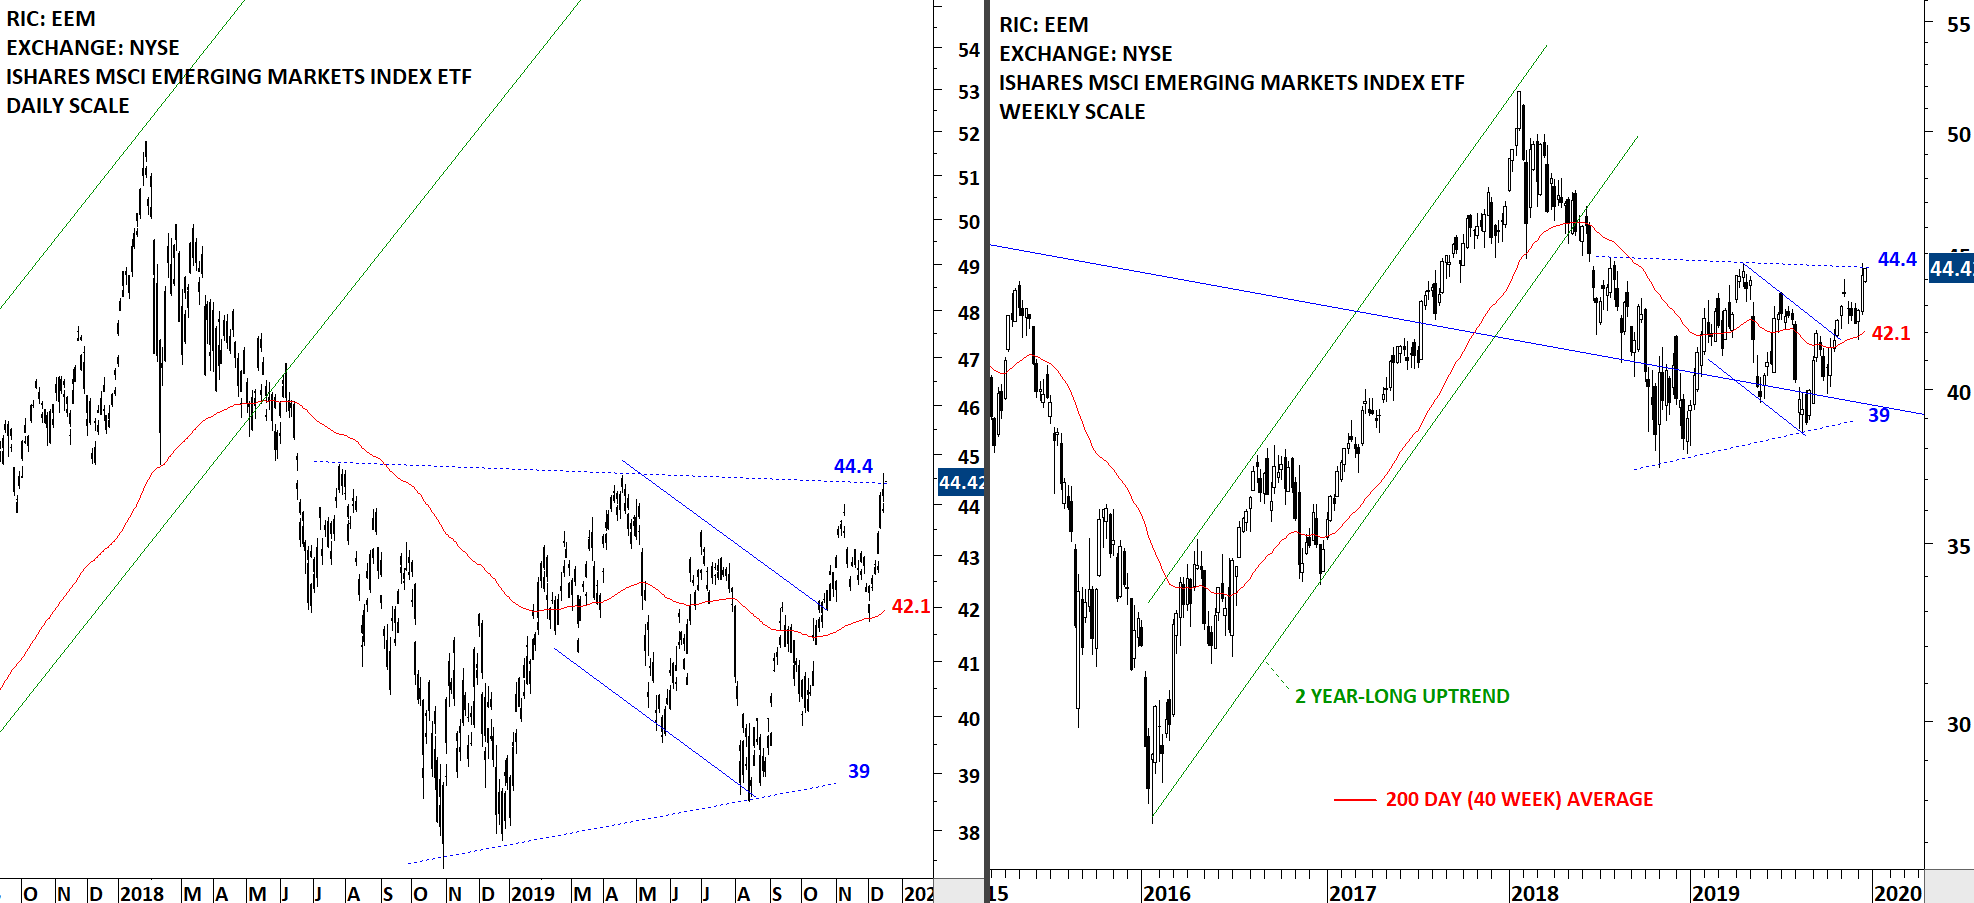
Every week Tech Charts Global Equity Markets report features some of the well-defined, mature classical chart patterns under a lengthy watchlist and the chart pattern breakout signals that took place during that week. Global Equity Markets report covers single stocks from developed, emerging and frontier markets, ETF’s and global equity indices. The report starts with a review section that highlights the important chart developments on global equity benchmarks. This blog post features from the review section the iShares MSCI Emerging Markets Index ETF (EEM), listed on the New York Stock Exchange.
The benchmark for the Emerging Markets performance, the iShares MSCI Emerging Markets Index ETF (EEM) rebounded from the 200-day moving average at 42 levels and reached the upper boundary of its year-long sideways consolidation at 44.4 levels. Without a breakout on China equity benchmarks the Emerging Markets ETF will not get out of the woods. Having said that this week’s price action was promising both on China equity benchmarks and EEM ETF. Price action is still showing sideways consolidation. Breakout above 44.4 levels will be very positive for Emerging Markets. The consolidation can act as a bottom reversal (double bottom) or (symmetrical triangle reversal). Data as of December 16, 2019.
By becoming a Premium Member, you’ll be able to improve your knowledge of the principles of classical charting.
With this knowledge, you can merge them with your investing system. In fact, some investors use my analyses to modify their existing style to invest more efficiently and successfully.
You will receive:
For your convenience your membership auto renews each year.

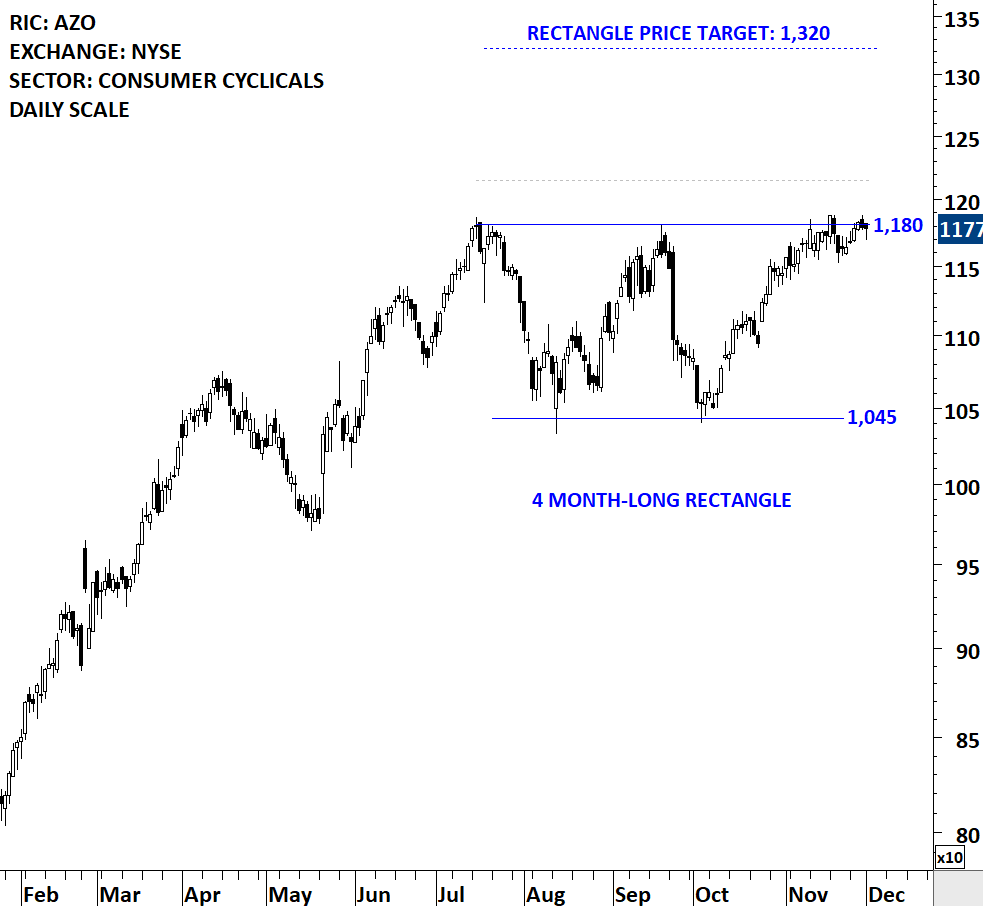
Every week Tech Charts Global Equity Markets report features some of the well-defined, mature classical chart patterns under a lengthy watchlist and the chart pattern breakout signals that took place during that week. Global Equity Markets report covers single stocks from developed, emerging and frontier markets, ETF’s and global equity indices. The report starts with a review section that highlights the important chart developments on global equity benchmarks. This blog post features from the watchlist section a rectangle chart pattern opportunity, listed on the New York Stock Exchange.
AutoZone, Inc. is a retailer and distributor of automotive replacement parts and accessories in the United States. The Company operates through the Auto Parts Locations segment. The Auto Parts Locations segment is a retailer and distributor of automotive parts and accessories. The stock is listed on the New York Stock Exchange. Price chart formed a 4 month-long rectangle with the horizontal boundary acting as strong resistance at 1,180.0 levels. The horizontal boundary was tested several times over the course of the chart pattern. A daily close above 1,215.0 levels will confirm the breakout from the 4 month-long rectangle with the possible chart pattern price target of 1,320.00 levels. Breakout can push the stock to all-time highs. (Data as of December 2, 2019)
By becoming a Premium Member, you’ll be able to improve your knowledge of the principles of classical charting.
With this knowledge, you can merge them with your investing system. In fact, some investors use my analyses to modify their existing style to invest more efficiently and successfully.
You will receive:
For your convenience your membership auto renews each year.

Dear Tech Charts followers,
I reviewed some of the exciting chart pattern setups in Global Equity Markets for Real Vision – Technical Trader section.
You can watch the recording by following the link below. I hope you enjoy it.
https://www.realvision.com/the-power-of-classical-charting-patterns
Regards,
Aksel Kibar, CMT
By becoming a Premium Member, you’ll be able to improve your knowledge of the principles of classical charting.
With this knowledge, you can merge them with your investing system. In fact, some investors use my analyses to modify their existing style to invest more efficiently and successfully.
You will receive:
For your convenience your membership auto renews each year.

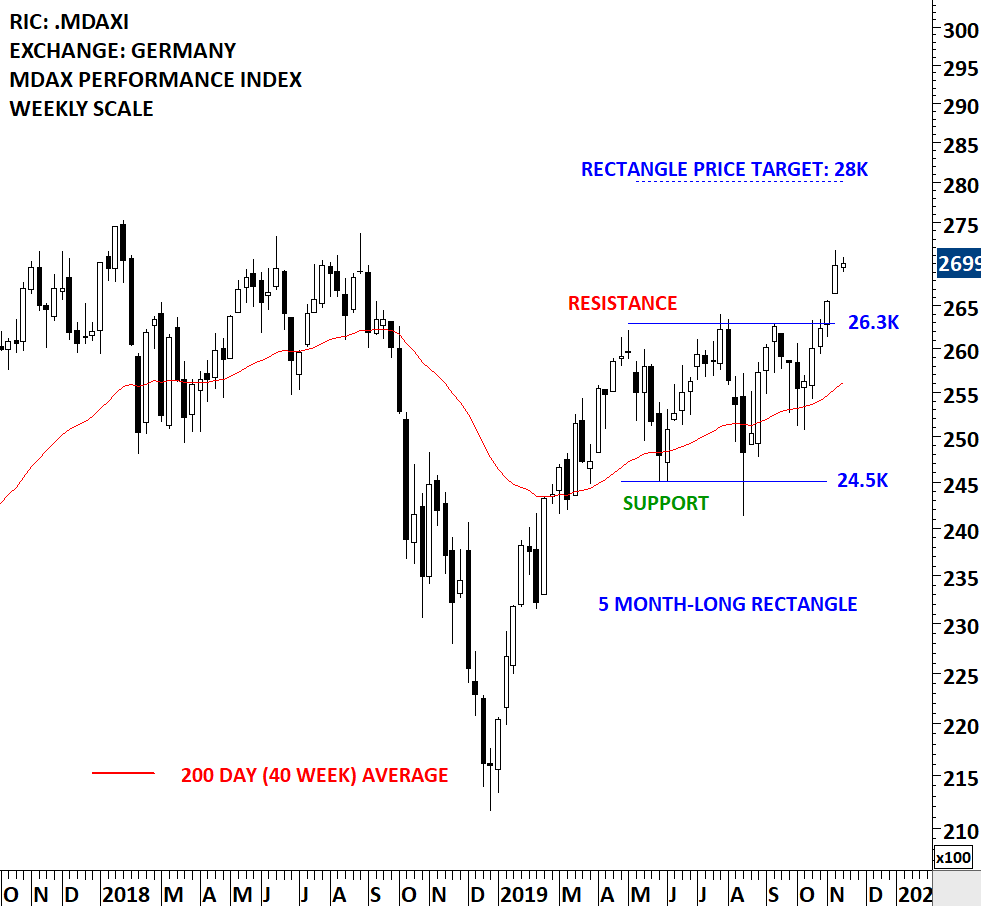
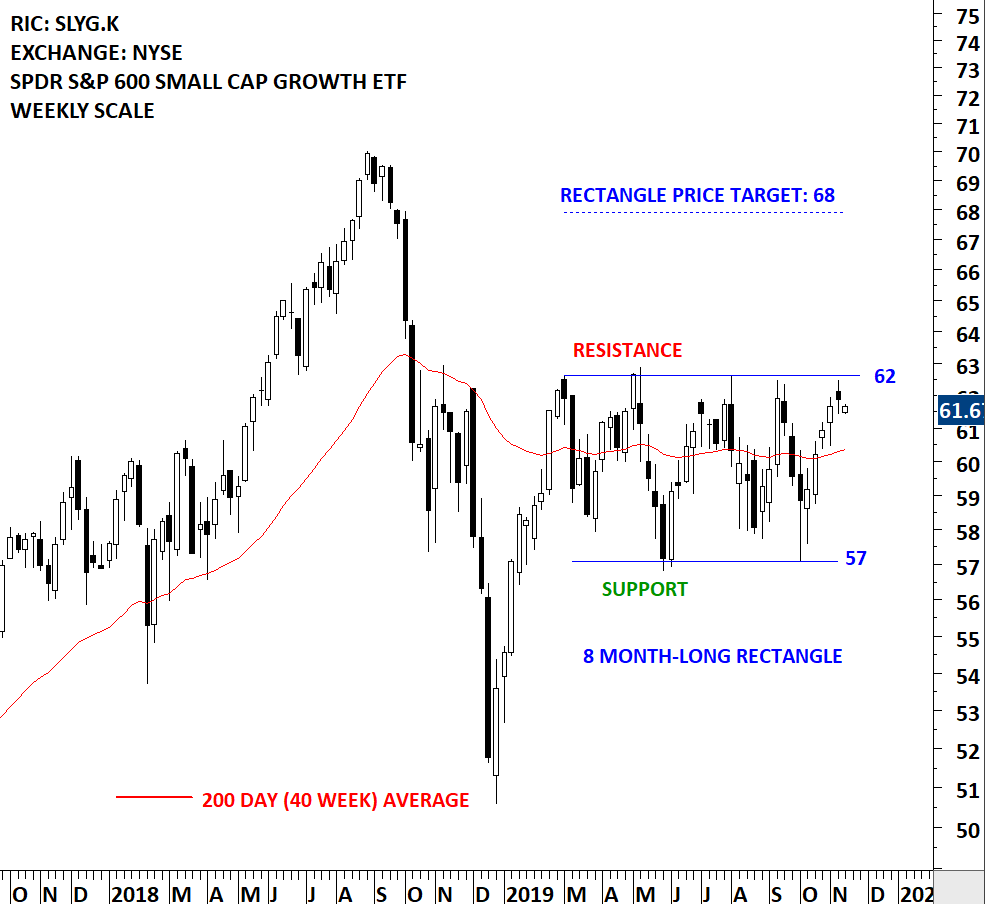
Every week Tech Charts Global Equity Markets report features some of the well-defined, mature classical chart patterns under a lengthy watchlist and the chart pattern breakout signals that took place during that week. Global Equity Markets report covers single stocks from developed, emerging and frontier markets, ETF’s and global equity indices. The report starts with a review section that highlights the important chart developments on global equity benchmarks. This blog post features from the review section two rectangle chart patterns on Germany’s MDAX Index and S&P SPDR 600 Small Cap Growth ETF.
There are several Global benchmarks that are stuck in a range and looking for direction. In this update I added the Germany’s mid-cap equities benchmark MDAX as well as S&P 600 Small Cap Growth ETF. Germany’s mid-cap MDAX Index recently completed a 5 month-long rectangle chart pattern. MDAX resumed higher after breaking above the upper boundary of its consolidation. Possible price target for the rectangle stands at 28K.
SPDR S&P 600 Small Cap Growth ETF has also well-defined boundaries between 57 and 62 levels. The ETF is possibly forming another rectangle chart pattern. Chart pattern price target for the SPDR S&P 600 Small Cap ETF stands at 68 levels.
(Data as of November 12, 2019). It is important to note that price charts are shown on weekly scale and the last candlestick only contains two days of trading data.
By becoming a Premium Member, you’ll be able to improve your knowledge of the principles of classical charting.
With this knowledge, you can merge them with your investing system. In fact, some investors use my analyses to modify their existing style to invest more efficiently and successfully.
You will receive:
For your convenience your membership auto renews each year.


