SOYBEANS (Update)
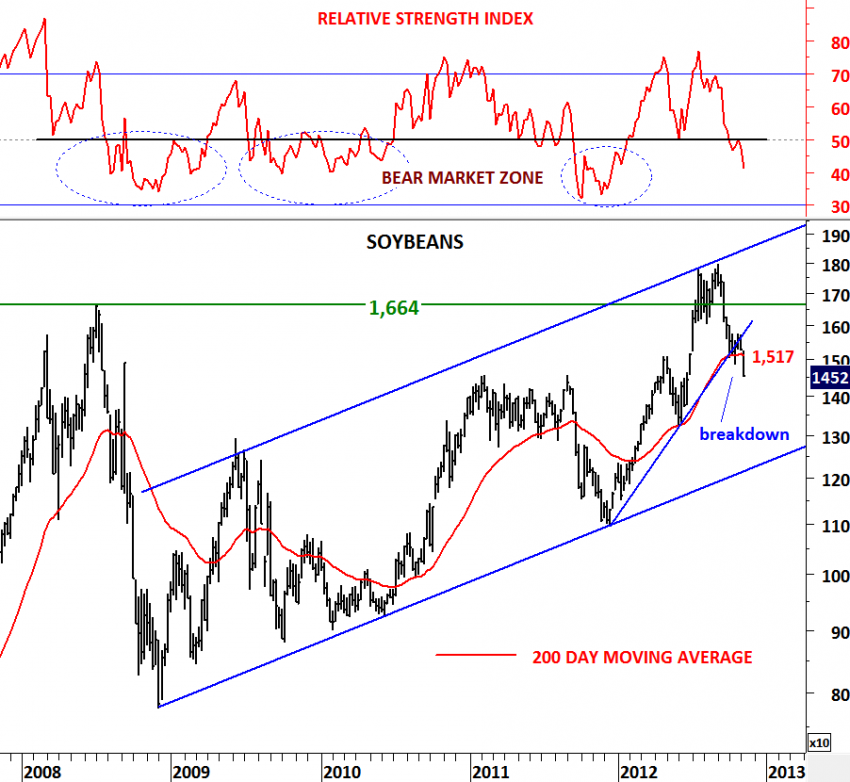
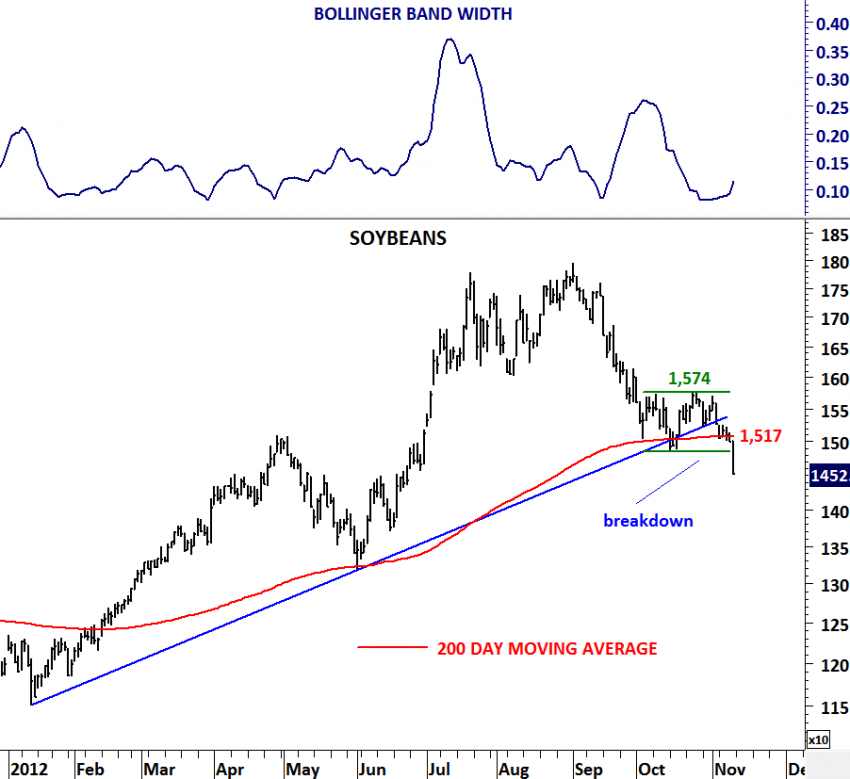
Tech Charts blog followers will remember the earlier analysis on Soybeans forecasting a strong directional move. Low volatility is usually followed by high volatility. Volatility does not have direction but it is cyclical. With this week’s sell-off Soybeans broke down two important technical support; the 200 day moving average and the year-long trend support. Short-term consolidation between 1,484 and 1,574 broke down. Technical outlook on Soy products turned negative. We should expect further weakness towards 1,300 levels. During any rebound, 1,517-1,574 area will act as strong resistance. For the bearish outlook to remain intact price should not breach above the resistance area between 1,517 and 1,574.


