Posts

GLOBAL EQUITY MARKETS – December 14, 2019

REVIEW


The benchmark for the Global equity markets performance, the iShares MSCI All Country World Index ETF (ACWI.O) cleared the resistance at 77.5 levels. After a week of short-term volatility and pullback the ETF resumed higher towards its possible rectangle chart pattern price target at 79.6 levels. Both the daily and weekly price charts show a steady uptrend.

Read More

GLOBAL EQUITY MARKETS – December 7, 2019

REVIEW


The benchmark for the Global equity markets performance, the iShares MSCI All Country World Index ETF (ACWI.O) found resistance at 77.5 levels. Last week's bearish shooting star candlestick pattern proved to be a short-term correction signal. Following a quick sell-off (intra-week) the ETF recovered to test its previous high.

Is the short-term correction over? Read More

GLOBAL EQUITY MARKETS – November 30, 2019

REVIEW


The benchmark for the Global equity markets performance, the iShares MSCI All Country World Index ETF (ACWI.O) found resistance at 77.5 levels. This week's price action formed a shooting star candlestick around the resistance area. The shooting star is common candlestick that indicates the potential for a bearish reversal. This candlestick is characterized by a small body with a long upper wick and a short or nonexistent lower wick. In order to be classified as a shooting star, the upper wick of the candlestick should be at least twice as long as its body. The shooting star candlestick looks very similar to the inverted hammer candlestick. The defining difference is that shooting stars are bearish reversal signals at the top of of uptrends, while inverted hammers are bullish reversal signals at the bottom of downtrends.

The 5 month-long rectangle price target stands at 79.6 levels. Breakout above the minor resistance can push the ETF towards the price target at 79.6. Both the daily and weekly price charts show a steady uptrend. Unless we see a strong breakout above this week's high, ACWI ETF can trade between 74.8 and 77.5 levels in the following weeks.

Read More

GLOBAL EQUITY MARKETS – November 23, 2019

REVIEW


The benchmark for the Global equity markets performance, the iShares MSCI All Country World Index ETF (ACWI.O) continued to trade close to the resistance level at 77.5 levels. The ETF found short-term resistance around 77.5 levels. The 5 month-long rectangle price target stands at 79.6 levels. Breakout above the minor resistance can push the ETF towards the price target at 79.6. Both the daily and weekly price charts show a steady uptrend. 74.8 levels will act as support during any pullback.

Read More

GLOBAL EQUITY MARKETS – November 16, 2019

REVIEW


The benchmark for the Global equity markets performance, the iShares MSCI All Country World Index ETF (ACWI.O) remained strong and close to the resistance level at 77.5 levels. The ETF found short-term resistance around 77.5 levels. The 5 month-long rectangle price target stands at 79.6 levels. Breakout above the minor resistance can push the ETF towards the price target at 79.6. Both the daily and weekly price charts show a steady uptrend. 74.8 levels will act as support during any pullback.

Read More

GLOBAL EQUITY MARKETS – November 18, 2017

REVIEW


Emerging Markets equities continue to remain strong. A widely followed benchmark for the Emerging Markets equity performance, MSCI Emerging Markets index resumes its multi-month uptrend in a steady parallel trend channel. Last one month's short-term consolidation can be identified as a possible flag; a bullish continuation chart pattern. The lower boundary of the flag at 1,100 level will act as a short-term support. Earlier in July 2017, the MSCI Emerging Markets index cleared a decade-long trend line resistance at 1,015 levels as shown on the monthly scale price chart.

Read More

CONSUMER DISC. SELECT SECTOR SPDR FUND (XLY)

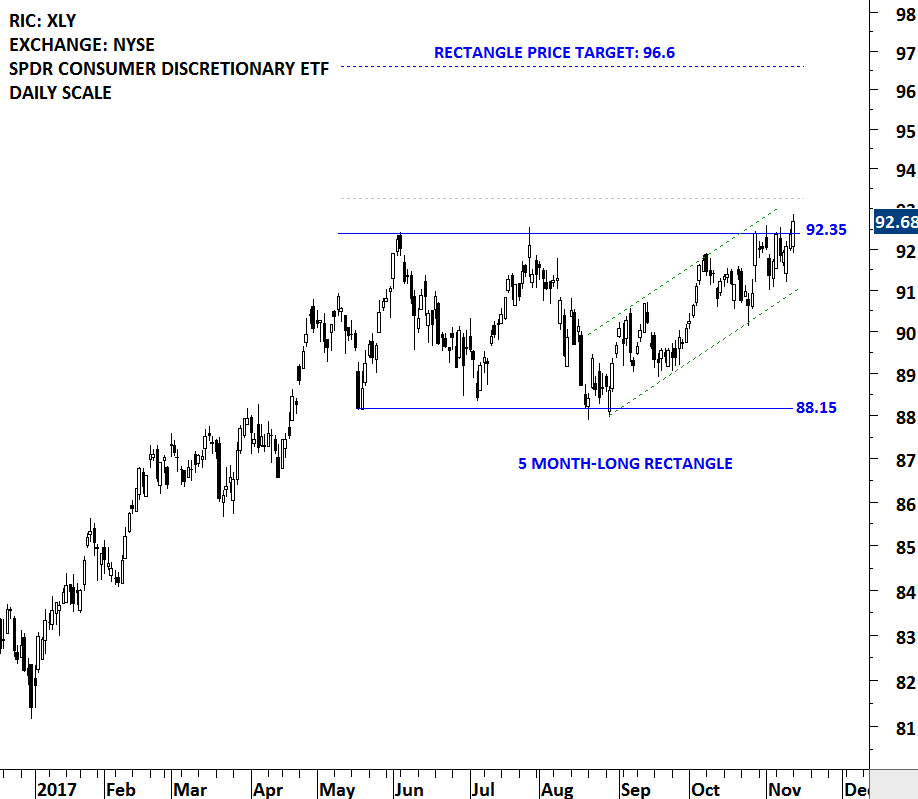
Consumer Discretionary Select Sector SPDR (XLY) Fund (the Fund) seeks to provide investment results that correspond to the price and yield performance of the Consumer Discretionary Select Sector of the S&P 500 Index (the Index). The Index includes companies from industries, such as automobiles and components, consumer durables, apparel, hotels, restaurants, leisure, media and retailing. The ETF is listed on the New York Stock Exchange. Price chart formed a 5 month-long rectangle with the boundaries acting as resistance at 92.35 and support at 88.15 levels. Both the upper and lower boundary of the rectangle was tested several times. A daily close above 93.25 levels will confirm the breakout from the sideways consolidation with the possible chart pattern price target of 96.6 levels. You can check out the sample video below on bullish rectangle continuation.

Here are some of the sample educational videos you might find valuable.  This sample video explains how to identify rectangles and to calculate possible chart pattern price targets. Tech Charts Educational Videos cover major reversal and continuation chart patterns.

Read More

GLOBAL EQUITY MARKETS – November 11, 2017

REVIEW


During established up trends pullback to the long-term averages are considered to be low risk entry points. A widely followed trend indicator is the 200 day moving average. Price action above the 200 day moving average is recognized as an uptrend, while price trading below the 200 day (40 week) average is considered to be a downtrend. In the last quarter of 2016, the Euro Stoxx Banking index breached its long-term average on the upside what was considered to be the beginning of a possible uptrend. Since then, each pullback found support at the long-term moving average, confirming the steady uptrend. Over the past 5 months, the Euro Stoxx Banking index formed a sideways consolidation that can be identified as a symmetrical triangle. Read More

GLOBAL EQUITY MARKETS – November 4, 2017

REVIEW


If there is one theme and well-defined similar chart pattern set ups that I need to highlight, it is in the Gold and Silver mining equities. I discussed the developing chart patterns in an earlier Global Equity Markets report and the Interim update. Whenever similar chart patterns are identified on different equities in the same industry and sector, the price action becomes more important. The Tech Charts Watchlist features some of the well-defined chart setups in the gold & mining equities. In a timely manner, we have also added a new video tutorial for members on Descending Triangle as a bearish reversal chart pattern.

Read More