Posts

WHEAT, SOYBEANS & METALS

SILVER VS GOLD

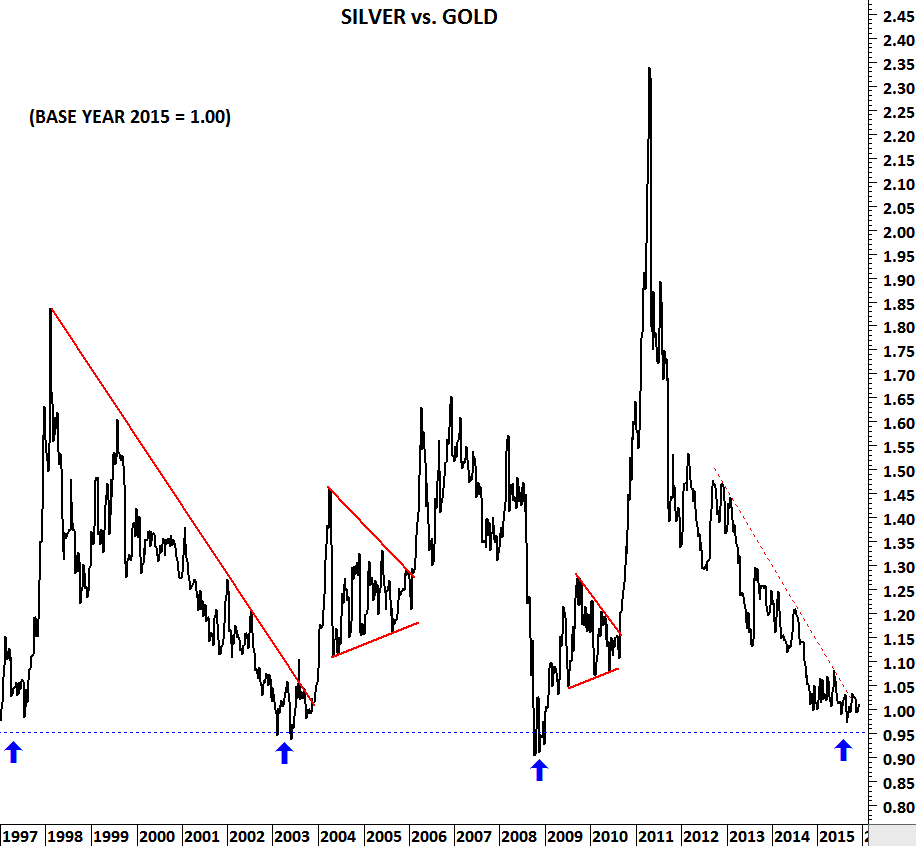
Silver is likely to outperform Gold prices in the coming months. Long-term chart of SILVER/GOLD suggests the ratio is at a major turning point. Multi-decade support reversed the ratio three times over the past two decades and this could be the fourth time. Reversal from the strong support in the past resulted in an approximately 1.5x-1.6x outperformance with the exception of 2.3x during 2009-2011 period.

SOYBEANS

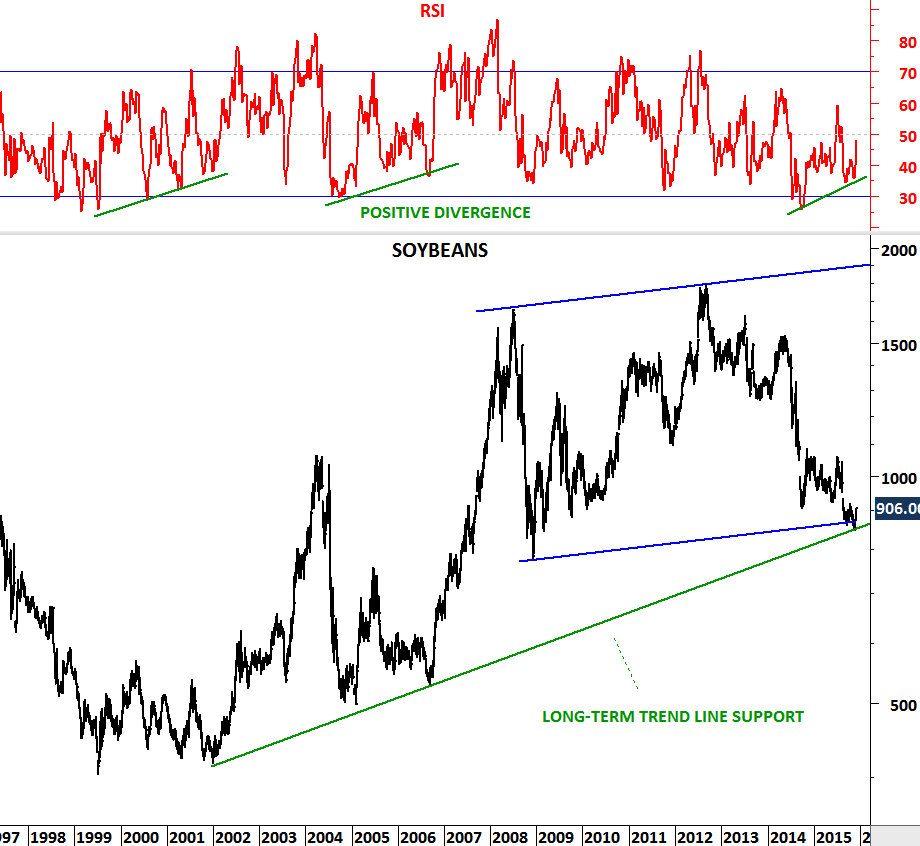
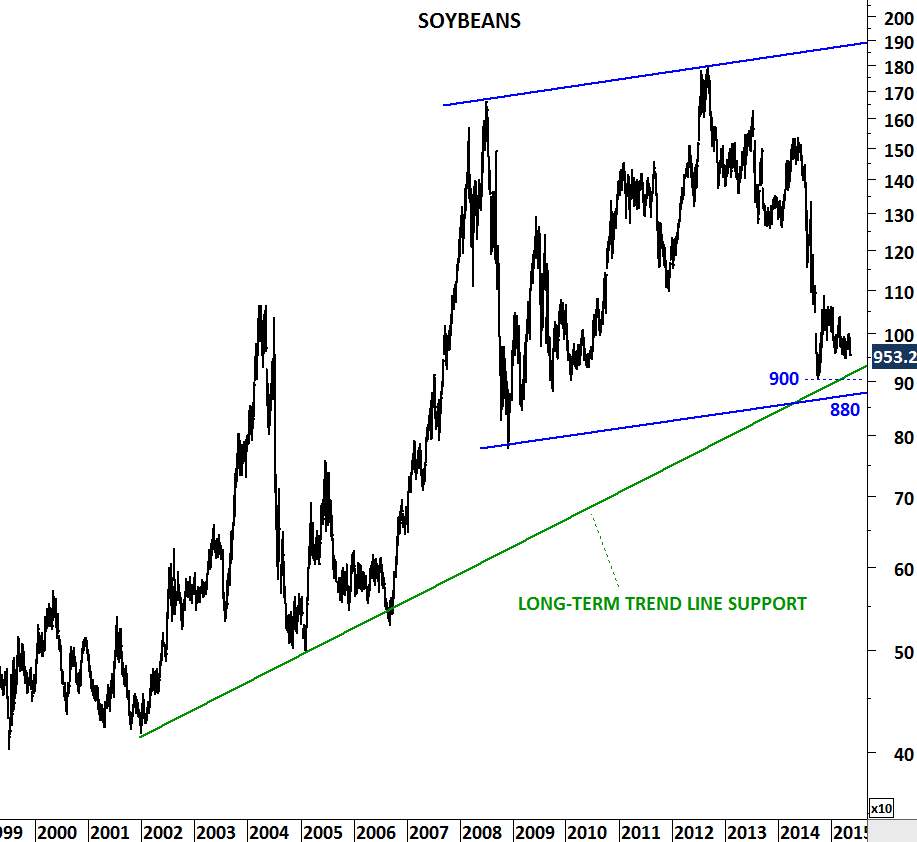
Grains and beans complex is at a major turning point. Soybean price is trying to reverse from a multi-year trend support. Two long-term trend lines acted as support around 850 levels. Momentum indicator RSI formed positive divergence. This could prove to be a major low for Soybeans.

WHEAT

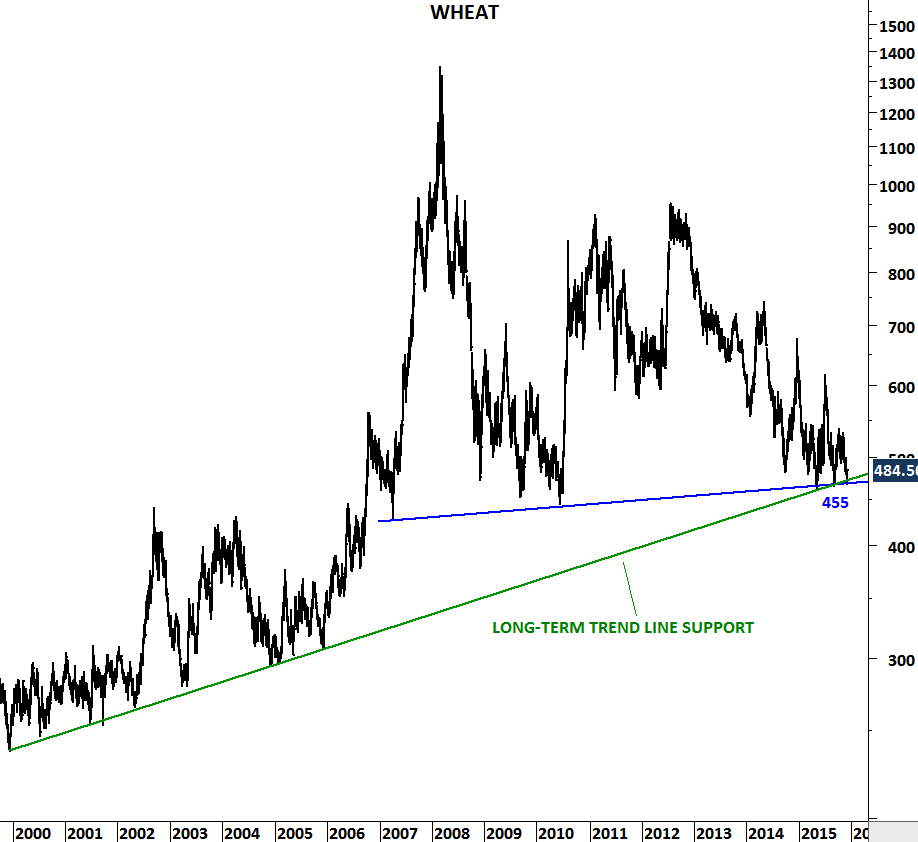
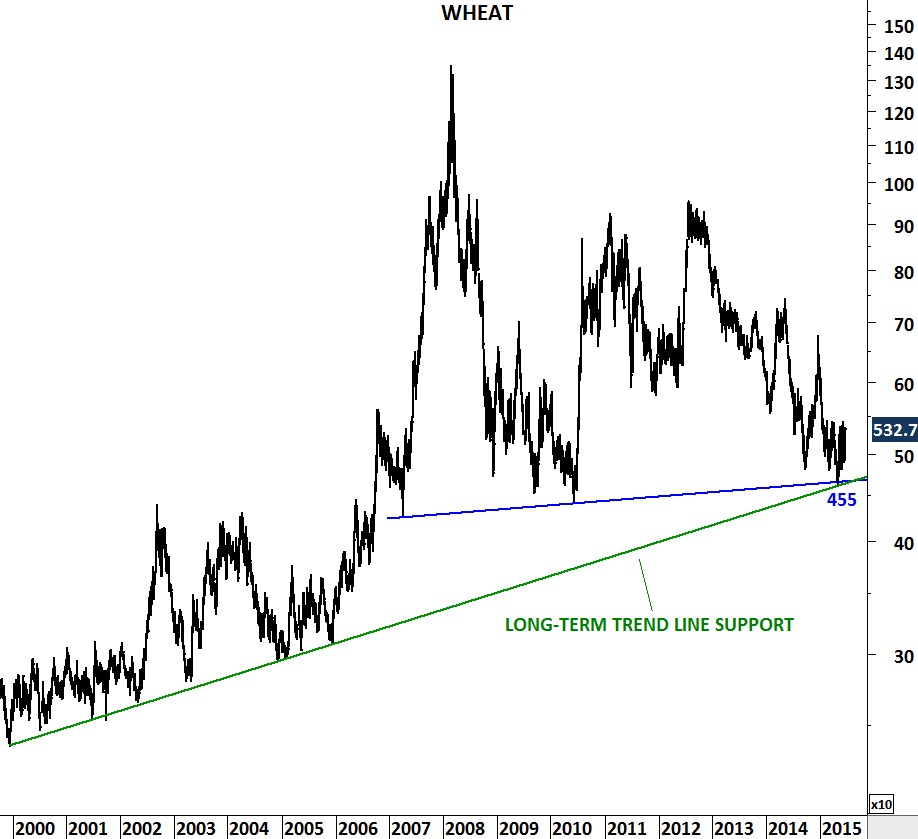
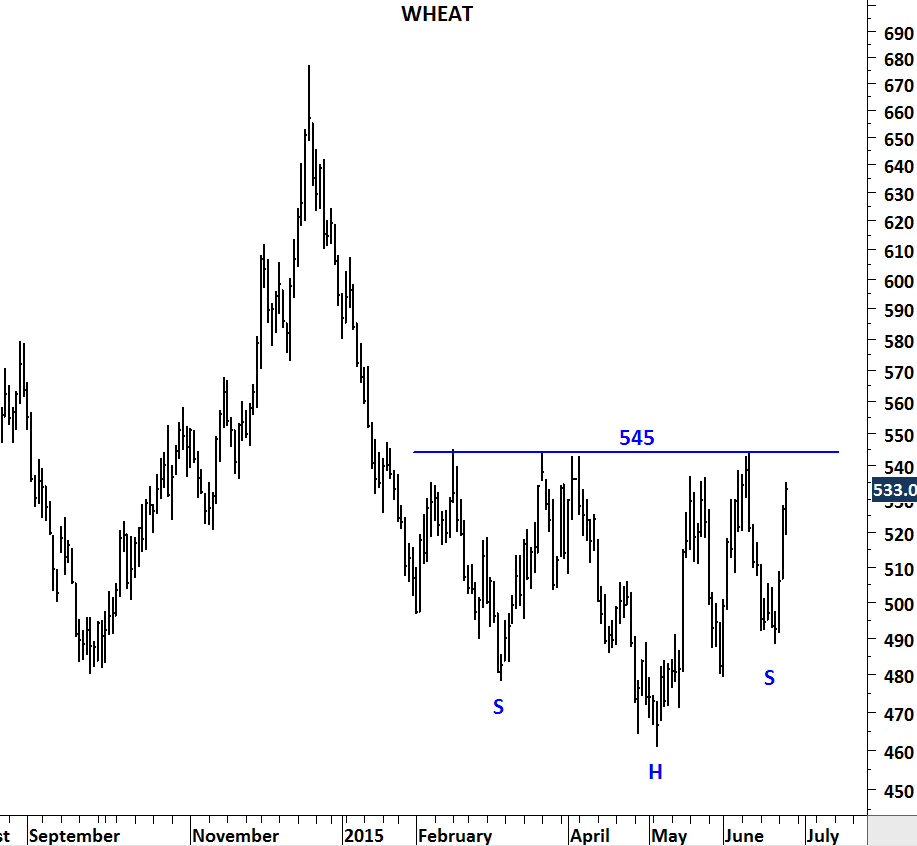
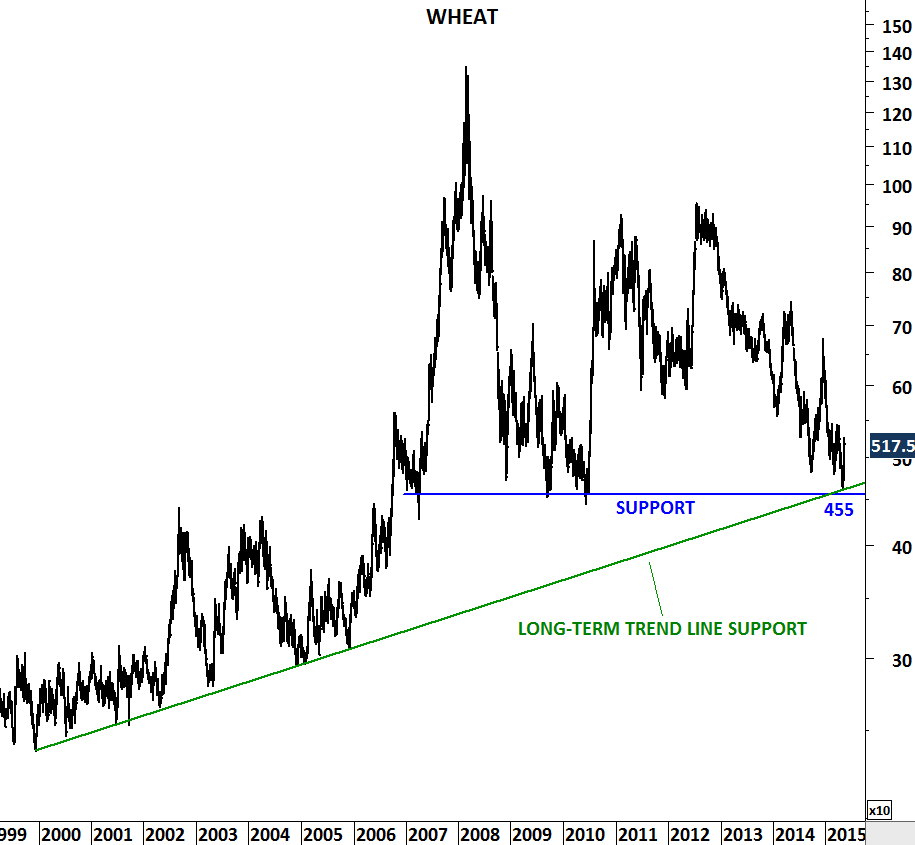
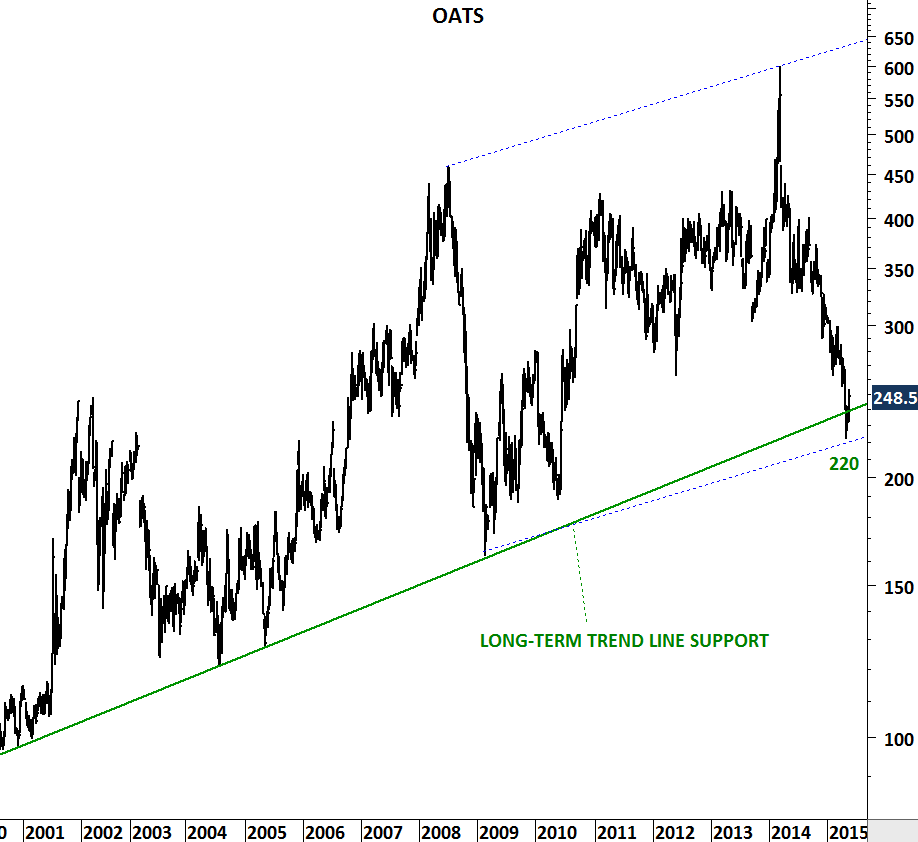
Similar price action can be seen on Wheat price. Last three year’s downtrend found support around 455 levels. Strong support can prove to be a turning point for the agricultural commodity.

WHEAT

I think it is time to revisit our agricultural commodity charts. Especially the latest bullish development on Wheat prices. Agricultural commodities have been weak. They are more than 50% lower from their 2008 levels. Though, a change in trend is in progress. Wheat prices tested long-term trend line support and prices have rebounded.

WHEAT

FUTURES (SEP 2015) – WEEKLY PRICE CHART

On the daily chart price formed an inverse head and shoulder with the short-term resistance standing at 545 levels. Breakout from this short/medium-term base formation can result in an uptrend towards 640-650 area. Both the short-term and the long-term charts suggest higher prices in the following months. A decisive break above 545 levels will confirm the inverse head & shoulder chart pattern.

WHEAT daily

FUTURES (SEP 2015) – DAILY PRICE CHART

CORN, WHEAT, SOYBEANS and OATS

Agricultural commodities are testing their decade-long trend line supports and are likely to rebound in the coming months. Prices are expected to rebound from such strong trend supports and in most cases put in a medium/long-term bottom. Especially when more than one trend line overlaps around the same area, it increases the significance of that support.

Higher prices in agricultural commodities could bring back the memories of 2007 where food inflation and shortages were the main concerns of the public. Most of the agricultural commodities are back to 2006 levels. Given the significance of the long-term supports, agricultural commodities could see an increase in demand in the second half of the year.

You can find more information on these agricultural commodities by clicking the links here (CORN, WHEAT, OATS, SOYBEANS, SOYBEAN OIL).

CORN

1st month continuation CORN futures contract – WEEKLY SCALE


WHEAT

1st month continuation WHEAT futures contract – WEEKLY SCALE


OATS

1st month continuation OATS futures contract – WEEKLY SCALE


SOYBEANS

1st month continuation SOYBEANS futures contract – WEEKLY SCALE


SOYBEAN OIL

1st month continuation SOYBEAN OIL futures contract – MONTHLY SCALE


WHEAT

While global equity markets and commodities are experiencing sharp corrections, an underperforming commodity in the grains complex, wheat started breaking out of its range. Latest technical action is similar to the earlier breakout that wheat experienced in the summer of 2010. In July-August period it took 4 weeks for wheat prices to rally 60% after the breakout.

Wheat is breaking out of its consolidation in a similar fashion by recording a strong weekly close above the 200 day moving average and the trend resistance. Watch this commodity with a bullish outlook by placing an intermediate term stop loss at 650 levels.