Posts

GLOBAL EQUITY MARKETS – October 6, 2018

REVIEW


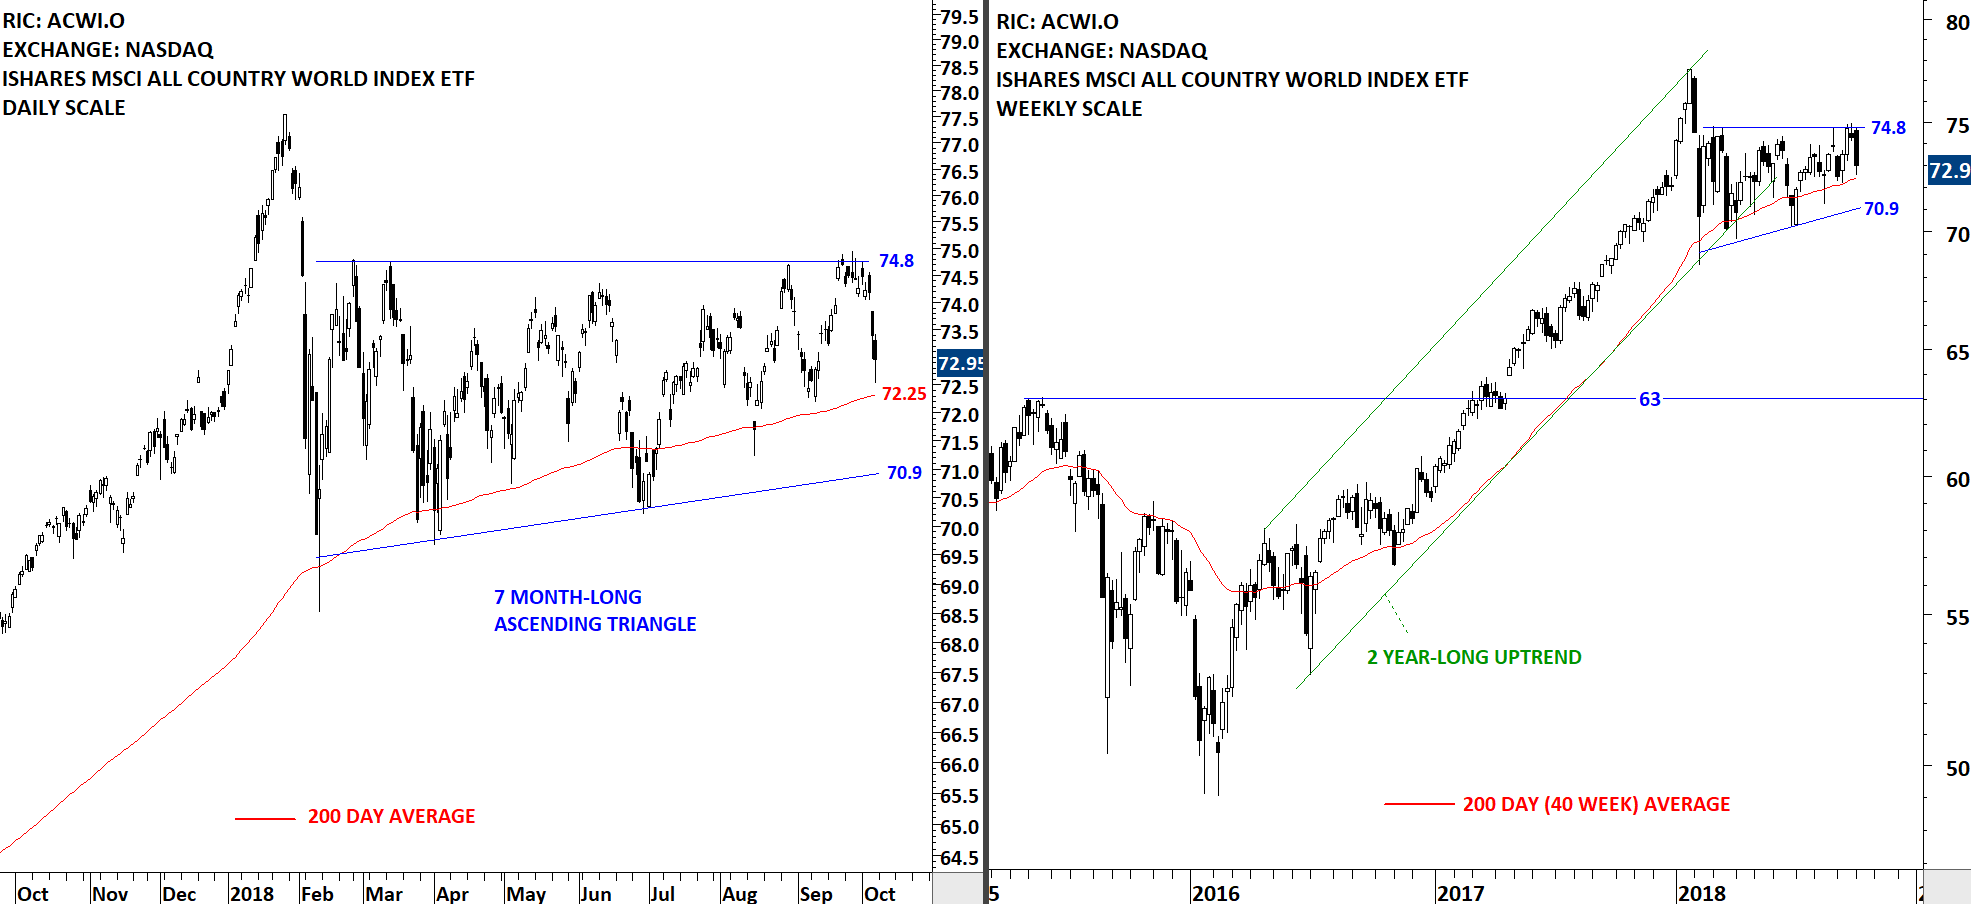
If one needs to explain what "trend less" market looks like, there is no better example other than the iShares MSCI All Country World Index ETF (ACWI.O). Since the beginning of the year the ACWI ETF is stuck in a tight range between 75 and 70. Usually a low volatility period like this is followed by a strong directional movement. ACWI ETF has strong resistance at 74.8 and support at 70.9 levels. The ETF is still holding above its long-term average.
Read More

CROSS-LISTED SECURITIES

Cross listing of shares is when a firm lists its equity shares on one or more foreign stock exchange in addition to its domestic exchange. Many companies cross-list, in which the stock is technically fungible between exchanges. Prices are subject to local market conditions, as well as FX fluctuations and are not kept in perfect parity between markets. Generally such a company's primary listing is on a stock exchange in its country of incorporation, and its secondary listing(s) is/are on an exchange in another country. Cross-listing is especially common for companies that started out in a small market but grew into a larger market.

Read More

GLOBAL EQUITY MARKETS – September 22, 2018

Reminder on Live Webinar

We are continuing our Member webinar series with another classical chart pattern; the symmetrical triangle. Live Webinar and Q&A with Aksel - Tuesday, September 25, 11am mountain. You can register here (Register for the Live Webinar)


REVIEW


Global equity markets performance as measured by the iShares MSCI All Country World Index ETF (ACWI.O) made another attempt this week to break out of its multi-month long sideways consolidations. The weekly close was at the high of the weekly candlestick. This week's price action is possibly a "secondary completion" of the symmetrical triangle chart pattern. Follow through in the following week can resume uptrend towards 2018 high levels.

Read More

GLOBAL EQUITY MARKETS – December 23, 2017

REVIEW


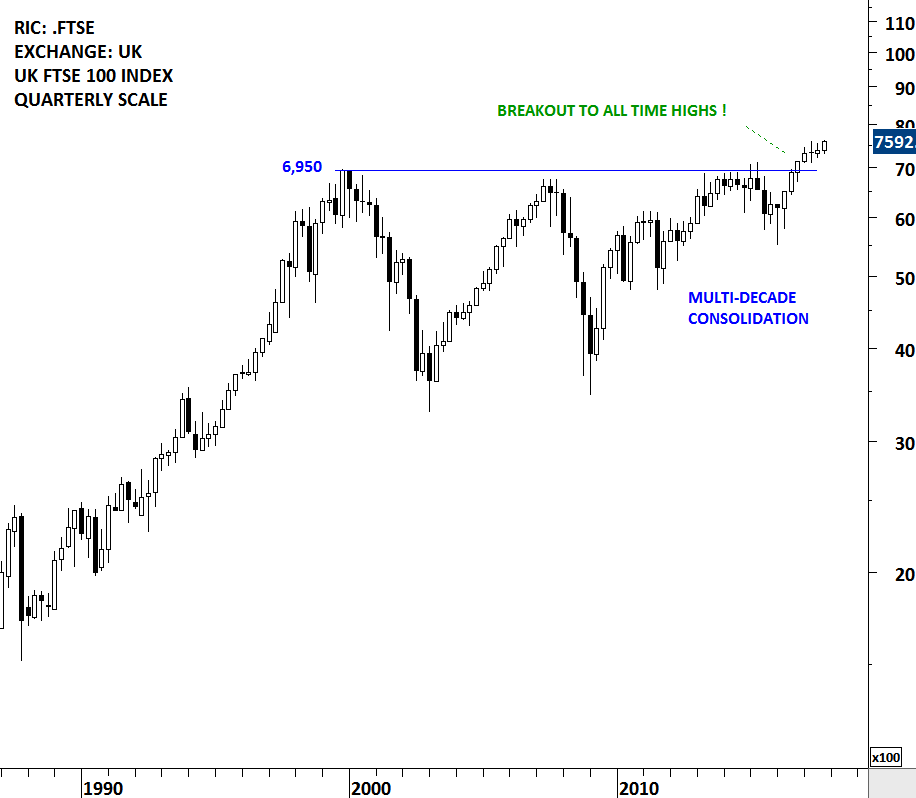
Over the past few weeks I reviewed the UK FTSE 100 index. I believe it is one of the most important long-term opportunity for global equity investors. There are couple of technical developments that I really like about the UK FTSE 100 index chart. First one is that the index cleared its multi-decade long horizontal resistance and reached all-time highs. Stocks or indices that clear long-term resistances and reach all-time highs enter "uncharted territory". Uncharted territory is the path of least resistance. In other words there is no previous price level that the index would find resistance.

Read More

INTERIM UPDATE – December 21, 2017

Vale S.A. is a global producer of iron ore and iron ore pellets, key raw materials for steelmaking, and producer of nickel. The Company also produces copper, metallurgical and thermal coal, potash, phosphates and other fertilizer nutrients, manganese ore, ferroalloys, platinum group metals, gold, silver and cobalt. The stock is listed on the Sao Paulo Stock Exchange. It is also listed on the New York Stock Exchange via depository receipts. This interim update features both the Sao Paulo Stock Exchange and NYSE listing.

Read More