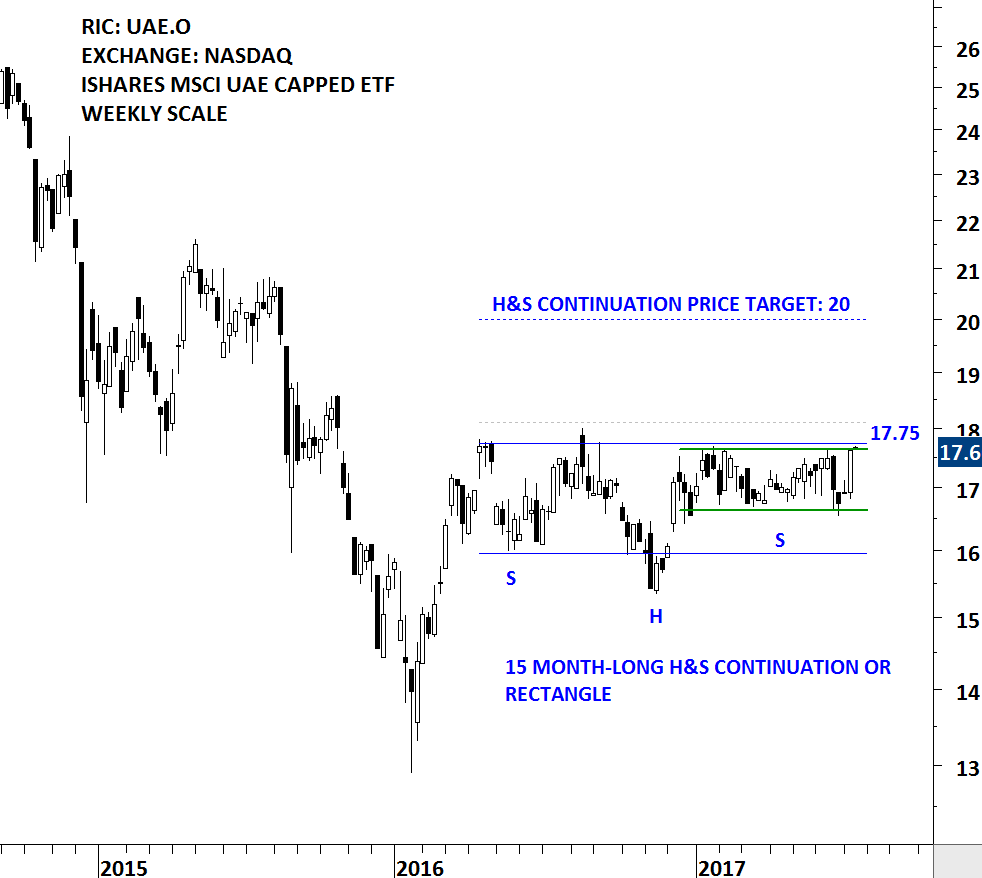
The Fund seeks to track the investment results of the MSCI All UAE Capped Index, which is designed to measure the equity market performance in the United Arab Emirates. The Fund generally invests at least 80% of its assets in securities of the underlying index or in depository receipts representing securities of the underlying index. The ETF is listed on the Nasdaq Stock Exchange. Price chart possibly formed a 15 month-long H&S continuation or a rectangle with the strong horizontal boundary standing at 17.75 levels. Last 6 month's price action can also be identified as a rectangle; another short-term consolidation, usually acting as a preparation for a breakout. A daily close above 18.10 levels will confirm the breakout from the multi-month trading range with the chart pattern price target of 20 levels. Top 10 holdings of the iShares MSCI UAE Capped ETF is compiled in a table below. Also you can find below some examples of H&S continuation chart patterns that Tech Charts Global Equity Markets reports featured in the past issues.
 Read More
 Read More