Posts

SYMMETRICAL TRIANGLE – DIAGONAL CHART PATTERN

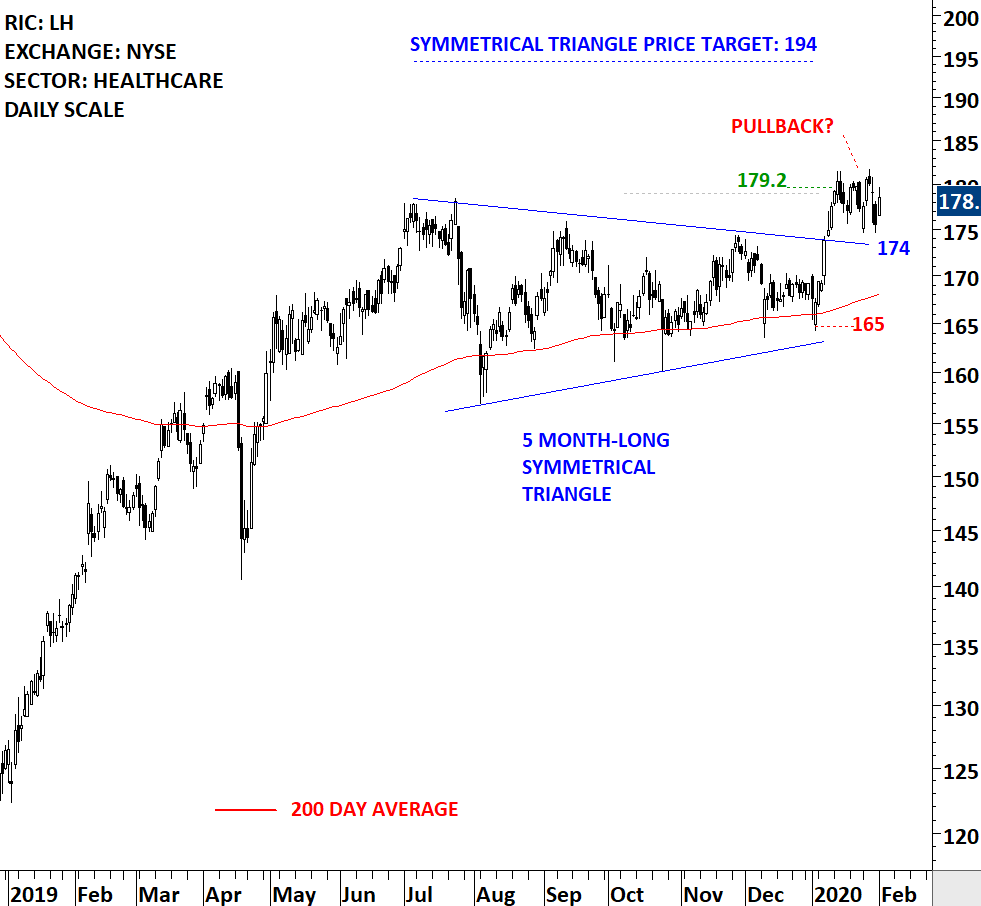
Every week Tech Charts Global Equity Markets report features some of the well-defined, mature classical chart patterns under a lengthy watchlist and the chart pattern breakout signals that took place during that week. Global Equity Markets report covers single stocks from developed, emerging and frontier markets, ETF’s and global equity indices. The report starts with a review section that highlights the important chart developments on global equity benchmarks. This blog post features from the breakout section a symmetrical triangle. Breakout signal was confirmed few weeks back and since then the stock has possibly completed a pullback. This chart is a good example to discuss the dynamics of breakouts from diagonal chart patterns. Below you will also find a short educational video on how breakouts can develop after completing symmetrical triangle chart patterns.

LABORATORY CORPORATION OF AMERICA HOLDINGS (LH)

Laboratory Corporation of America Holdings is a life sciences company that is integrated in guiding patient care, providing clinical laboratory and end-to-end drug development services. The Company operates as a healthcare diagnostics company. The stock is listed on the New York Stock Exchange. Price chart formed a 5 month-long symmetrical triangle with the upper boundary acting as strong resistance at 174.00 levels. Both boundaries were tested several times over the course of the chart pattern. The daily close above 179.00 levels confirmed the breakout from the 5 month-long symmetrical triangle with the possible chart pattern price target of 194.00 levels. The chart below is an update with the latest data from 03/02/2020.
A SHORT EDUCATIONAL VIDEO ON SYMMETRICAL TRIANGLES


Tech Charts Membership

By becoming a Premium Member, you’ll be able to improve your knowledge of the principles of classical charting.

With this knowledge, you can merge them with your investing system. In fact, some investors use my analyses to modify their existing style to invest more efficiently and successfully.

Get Access Now

As a Premium Member of Aksel Kibar’s Tech Charts,

You will receive:

  • Global Equities Report. Delivered weekly.
  • Classical charting principles. Learn patterns and setups.
  • Actionable information. Worldwide indices and stocks of interest.
  • Risk management advice. The important trading points of each chart.
  • Information on breakout opportunities. Identify the ones you want to take action on.
  • Video tutorials. How patterns form and why they succeed or fail.
  • Watch list alerts. As they become available so you can act quickly.
  • Breakout alerts. Usually once a week.
  • Access to everything (now and as it becomes available)
    o Reports
    o Videos and video series
  • Multi-part webinar course. You learn the 8 most common charting principles.
  • Webinars. Actionable and timely advice on breaking out chart patterns.

For your convenience your membership auto renews each year.

Get Access Now

Symmetrical Triangle Chart Patterns – September 2018 Tech Charts Webinar

Symmetrical Triangle Chart Patterns - September 2018 Tech Charts Webinar
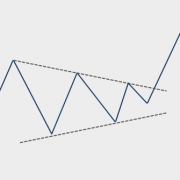
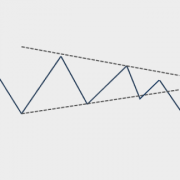
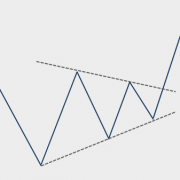
  • The symmetrical triangle is a chart pattern with diagonal boundaries and it is a neutral chart pattern. It can form as a reversal as well as a continuation chart pattern.
  • A symmetrical triangle forms due to the indecision between buyers and sellers.
  • Review chart pattern breakouts that were featured in the Global Equity Markets report.
  • Review some of the failed breakouts and try to analyze what differentiates a successful breakout from a failed breakout.
  • Developing symmetrical triangle chart pattern setups.
  • Highlight Tech Charts members favorite symmetrical triangle setups in different equity markets. Discuss and share some of the best classical chart patterns that members identified or those charts that members might have questions about.
  • Recent chart pattern breakouts
  • Q&A
  • Live questions from Members
Live questions from Members  
  1. Is there a way to distinguish better, stronger, higher probability chart patterns from the large number of those that get published on your watchlist/breakout lists. I am having a hard time choosing the few that I can afford to trade. I am giving priority to horizontal patterns where breakout will be new all time high? Is there another characteristic you would suggest using to screen for higher quality patterns? 54:35 
  2. What’s your minimum W/L Ratio for entering a trade? 56:53
  3. What's the difference between symmetrical triangle reversal formation and a bullish or bearish pennant, before the breakout happens? (For example, Peter Brandt has been talking about USD/TRY pair, is that a pennant or a triangle?) 58:48
  4. In your Global Equity Market update you have charted "ACWI" as a symmetrical triangle on the weekly chart - what would need to happen for you to reclassify the chart as an ascending triangle? 1:00:26
  5. The 3% break out rule is it valid also for the futures market or only for stocks? 1:01:34
  6. Is the 'red' line on the chart patterns a stop level or pattern negation level? If the latter, where does one place stops typically? 1:03:14 
  7. I hear you say often that the best breakouts are those that ‘never look back’. In hindsight analysis I very much agree. But in realtime, without some sort of pullback, I find it very difficult to enter such breakouts with a good reward-to-risk ratio (the price runs away from Moving Averages and other stop-loss indicators and never allows them to catch up). How would you recommend trying to enter these ‘best’ breakouts? How to place stop loss if reversal? 1:05:59
  8. Confused about what to consider a breakout. Can you define at what point exactly a symmetrical triangle can be considered a pattern breakout? (Not the 3% confirmation point, but the actual level required to call it a breakout). Seems like you are using the actual chart boundary in some cases, but a prior high in other cases (for upward breakouts). 1:07:56  
  9. It seems like most of the charts are around 10 months to 24 months or so; is that what you focus on as a time length for these patterns? Of the successful triangles; how long (as a %) of the pattern length does it take to meet the target (or 70% of target for those that don't make it all the way)? 1:09:22 
  10. Most of the charts you show are generally 1:1 or 1:1.5 risk reward. That means my batting average should be more than 50% to be profitable. How to reduce the risk and increase 1:3 risk reward? 1:11:16
  11. Do you have any statistics on success rates of breakouts reaching targets vs. failure, etc.? 1:12:14
  12. Is it appropriate to have increased confidence in patterns with another launching pattern within it. For example, increased position size? 1:14:01
  13. Is there a point in the triangle where strength of the pattern diminishes (e.g., past 50% or 75% of the distance to the apex of the triangle? 1:14:30
  14. Just be clear on breakouts... So 3% confirmation point is calculated from the point that price first penetrates the triangle boundary? Am I right? 1:15:55
Recorded live 08.25.2018  Read More

LONG-TERM CHARTS & LAUNCHING PATTERNS

Stock prices are either in a follow through trending phase or in a consolidation phase. During a strong trending period, a stock will proceed from one price level to another with very little interruption. During a consolidation period a stock will move in both directions without producing any meaningful or sustained price change.

During periods of consolidation prices tend to form a recognizable chart pattern which helps us to determine the direction and magnitude of the next substantial trend with some degree of accuracy.

Because price action and chart patterns are a result of human interaction, it is possible to find those repeating chart patterns in different markets, in different time frames such as on daily, weekly and monthly scale and in different time periods.

Read More