GLOBAL EQUITY MARKETS – January 13, 2018
REVIEW
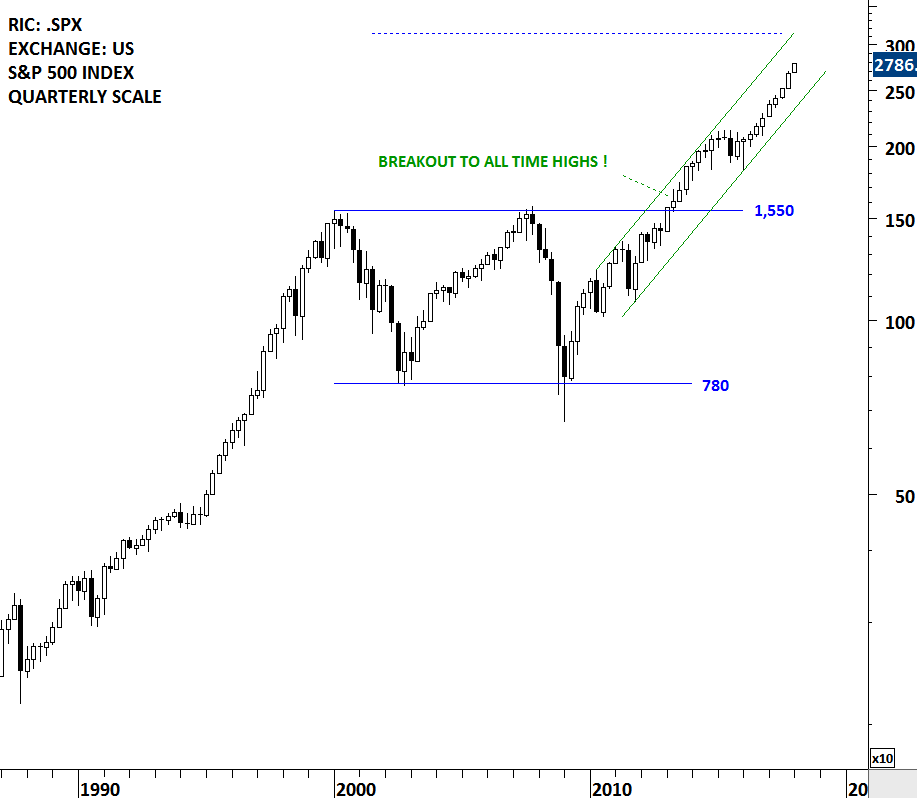
Reviewing long-term charts usually helps us to be focused on the big picture. Due to day to day volatility we might lose sight of the forest for the trees. Every now and then I feature these long-term charts to check the status of the bull market in global equities. U.S. equities have been a leader in the bull market. S&P 500 Index was one of the first widely followed U.S. equity benchmark that completed the decade-long consolidation and broke out to all-time highs in 2013. Since then the index has been in a steady uptrend reaching new high ground. Taking the width of the decade long-consolidation and adding it to the breakout level in percentage terms, gives us a price target in the range of 3,000-3,150.
 Read More


