Posts

S&P 500 INDEX AND U.S. UNEMPLOYMENT RATE (%)

Every week Tech Charts Global Equity Markets report features some of the well-defined, mature classical chart patterns under a lengthy watchlist and the chart pattern breakout signals that took place during that week. Global Equity Markets report covers single stocks from developed, emerging and frontier markets, ETF’s and global equity indices. The report starts with a review section that highlights the important chart developments on global equity benchmarks. This blog post features from the review section the S&P 500 Index and U.S. Unemployment Rate %.

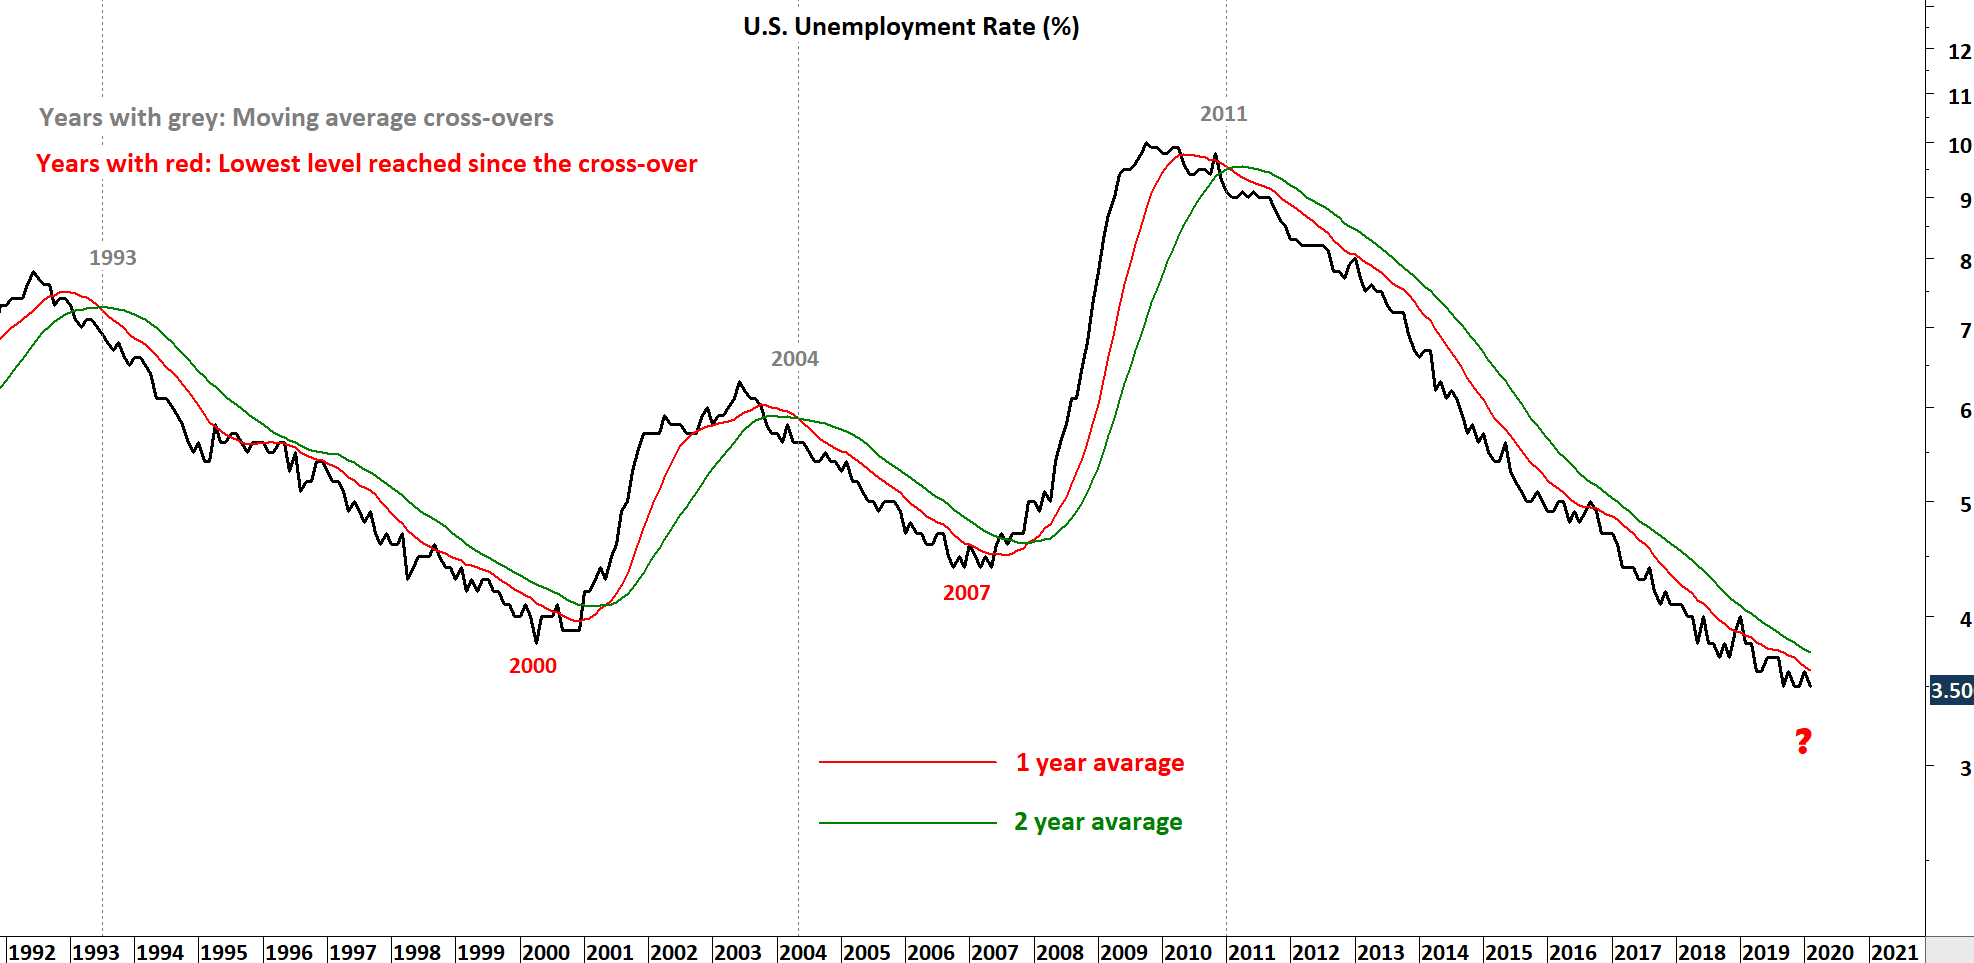
Global economies are going through difficult times. Below I discuss a possibility. In 2011, I wrote a blog post when Global equities were recovering from the 2007-2008 financial melt-down. I analyzed the Unemployment rate with the S&P 500 Index. You can read the blog post here U.S. Unemployment Rate (%) 2011 Blog Post. Since 2011, the unemployment rate remained in a steady downtrend and reached significantly low levels. We are now seeing discussions about Global recession. I refer to my charts to understand the possibility of it taking place in current environment.

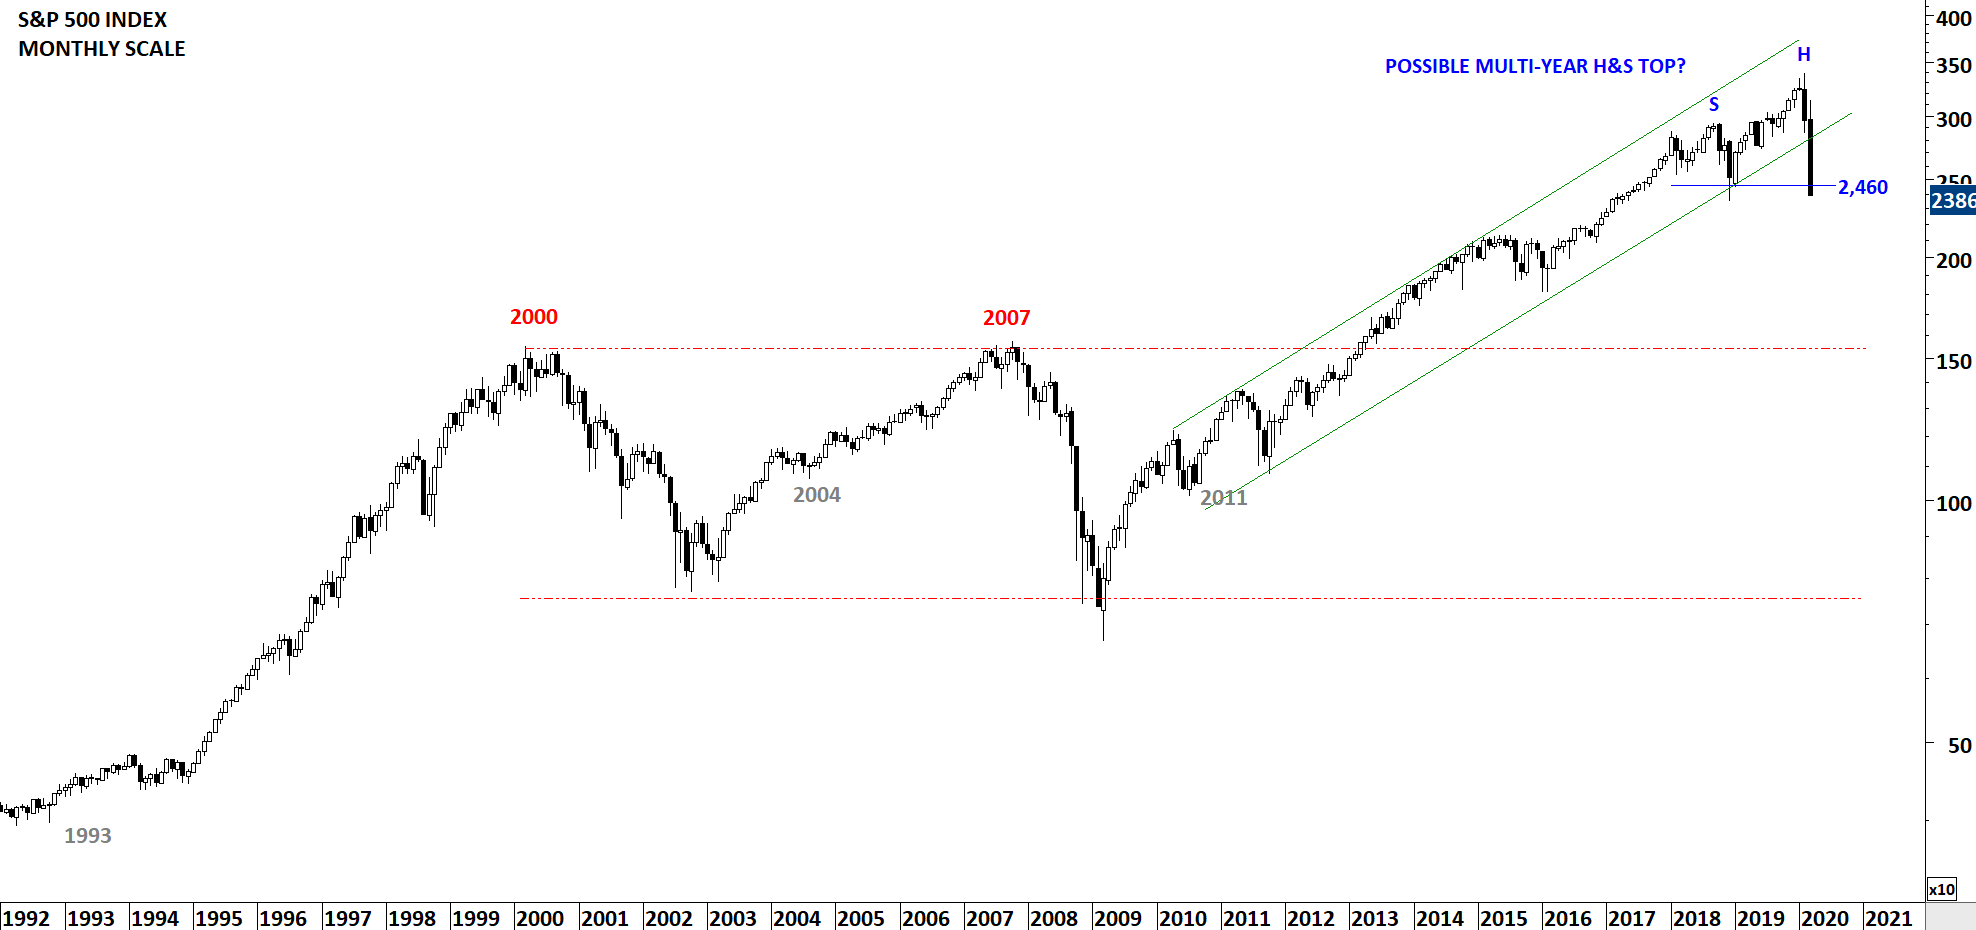
The recent sell-off on S&P 500 Index found support at 2018 minor lows (2,460). I’m weighing the possibility of a multi-month long H&S top. If such scenario taking place we are likely to spend the rest of 2020 by forming the right shoulder of the multi-month long top reversal. Stock market is always regarded as a leading indicator for economic activity. When we put the two charts together, the U.S. unemployment rate and the S&P 500 Index, a top reversal would coincide with a bottom on unemployment rate. Please note that these are monthly scale price charts and it can take several months for reversals to take place. And also please note that this is not a forecast. I view this as a possibility. As I get new evidence, I will update these charts.


Tech Charts Membership

By becoming a Premium Member, you’ll be able to improve your knowledge of the principles of classical charting.

With this knowledge, you can merge them with your investing system. In fact, some investors use my analyses to modify their existing style to invest more efficiently and successfully.

Get Access Now

As a Premium Member of Aksel Kibar’s Tech Charts,

You will receive:

  • Global Equities Report. Delivered weekly.
  • Classical charting principles. Learn patterns and setups.
  • Actionable information. Worldwide indices and stocks of interest.
  • Risk management advice. The important trading points of each chart.
  • Information on breakout opportunities. Identify the ones you want to take action on.
  • Video tutorials. How patterns form and why they succeed or fail.
  • Watch list alerts. As they become available so you can act quickly.
  • Breakout alerts. Usually once a week.
  • Access to everything (now and as it becomes available)
    o Reports
    o Videos and video series
  • Multi-part webinar course. You learn the 8 most common charting principles.
  • Webinars. Actionable and timely advice on breaking out chart patterns.

For your convenience your membership auto renews each year.

Get Access Now

GLOBAL EQUITY MARKETS – January 18, 2020

REVIEW


The benchmark for the Global equity markets performance, the iShares MSCI All Country World Index ETF (ACWI.O) continues to remain strong after completing both rectangle and H&S continuation chart patterns. ACWI ETF is in a steady uptrend. During any pullback, the high of 2018 (77.5) can act as support. It is usually difficult to pick tops and bottoms. The best way to approach strong trending markets is to trail it with trend following indicators such as ATR based trailing stops or different period moving averages. Selection of moving average period will depend on your time frame. Short-term moving averages will trail the price closely, resulting in an early exit signal.

  Read More

GLOBAL EQUITY MARKETS – January 4, 2020

REVIEW


The benchmark for the Global equity markets performance, the iShares MSCI All Country World Index ETF (ACWI.O) reached its initial price target after completing both rectangle and H&S continuation chart patterns. The right shoulder of a possible H&S continuation was identified as a rectangle with the price target of 79.6 levels. So far the price remained stable after reaching price objective. ACWI ETF is in a steady uptrend. During any pullback, the high of 2018 (77.5) can act as support.

Read More

GLOBAL EQUITY MARKETS – December 28, 2019

Dear Tech Charts members,

Another year is almost behind us. 2019 has been a productive year. Your communications and feedback has been helpful in improving the membership service and I'm thankful for that. Without your support I would not be able to put out this product. I hope the ideas, the educational content, webinars and reports have added value in your decision making. Guided and motivated by our members feedback and comments there will be several new additions to Tech Charts membership service in the new Year. I look forward to announcing them as the new Year progresses. I wish all of you a healthy and successful new Year and I would like to thank you for being a Tech Charts member.

Regards,

Aksel Kibar, CMT

REVIEW


The benchmark for the Global equity markets performance, the iShares MSCI All Country World Index ETF (ACWI.O) reached its initial price target after completing both the rectangle and H&S continuation chart patterns. The right shoulder of a possible H&S continuation was identified as a rectangle with the price target of 79.6 levels. This week's price action pushed the ETF towards its rectangle chart pattern price target. Long-term chart pattern price objective stands at 85.5 levels. During any pullback, the high of 2018 (77.5) can act as support. Daily and weekly price charts show a steady uptrend.

Read More

GLOBAL EQUITY MARKETS – December 14, 2019

REVIEW


The benchmark for the Global equity markets performance, the iShares MSCI All Country World Index ETF (ACWI.O) cleared the resistance at 77.5 levels. After a week of short-term volatility and pullback the ETF resumed higher towards its possible rectangle chart pattern price target at 79.6 levels. Both the daily and weekly price charts show a steady uptrend.

Read More

GLOBAL EQUITY MARKETS – December 7, 2019

REVIEW


The benchmark for the Global equity markets performance, the iShares MSCI All Country World Index ETF (ACWI.O) found resistance at 77.5 levels. Last week's bearish shooting star candlestick pattern proved to be a short-term correction signal. Following a quick sell-off (intra-week) the ETF recovered to test its previous high.

Is the short-term correction over? Read More

GLOBAL EQUITY MARKETS – November 23, 2019

REVIEW


The benchmark for the Global equity markets performance, the iShares MSCI All Country World Index ETF (ACWI.O) continued to trade close to the resistance level at 77.5 levels. The ETF found short-term resistance around 77.5 levels. The 5 month-long rectangle price target stands at 79.6 levels. Breakout above the minor resistance can push the ETF towards the price target at 79.6. Both the daily and weekly price charts show a steady uptrend. 74.8 levels will act as support during any pullback.

Read More

GLOBAL EQUITY MARKETS – November 16, 2019

REVIEW


The benchmark for the Global equity markets performance, the iShares MSCI All Country World Index ETF (ACWI.O) remained strong and close to the resistance level at 77.5 levels. The ETF found short-term resistance around 77.5 levels. The 5 month-long rectangle price target stands at 79.6 levels. Breakout above the minor resistance can push the ETF towards the price target at 79.6. Both the daily and weekly price charts show a steady uptrend. 74.8 levels will act as support during any pullback.

Read More

GLOBAL EQUITY MARKETS – November 9, 2019

REVIEW


The benchmark for the Global equity markets performance, the iShares MSCI All Country World Index ETF (ACWI.O) continued higher after breaking out from the 5 month-long rectangle. While the long-term chart pattern can be identified as a H&S continuation and has a much higher price objective the short-term chart pattern is possibly a rectangle and the short-term price target stands at 79.6 levels. This week's price action found resistance at the minor high that stands at 77.5 levels. The ETF might find short-term resistance around 77.5 levels. 74.8 levels will act as support during any pullback.

Read More

GLOBAL EQUITY MARKETS – November 2, 2019

REVIEW


The benchmark for the Global equity markets performance, the iShares MSCI All Country World Index ETF (ACWI.O) confirmed the breakout from the 5 month-long rectangle. While the long-term chart pattern can be identified as a H&S continuation and has a much higher price objective the short-term chart pattern is possibly a rectangle and the short-term price target stands at 79.6 levels. There is another hurdle that the ACWI ETF needs to overcome before reaching all-time highs and that is the minor high that stands at 77.5 levels. The ETF might find short-term resistance around 77.5 levels. 74.8 levels will act as support.

Read More