GLOBAL EQUITY MARKETS – October 26, 2019
REVIEW
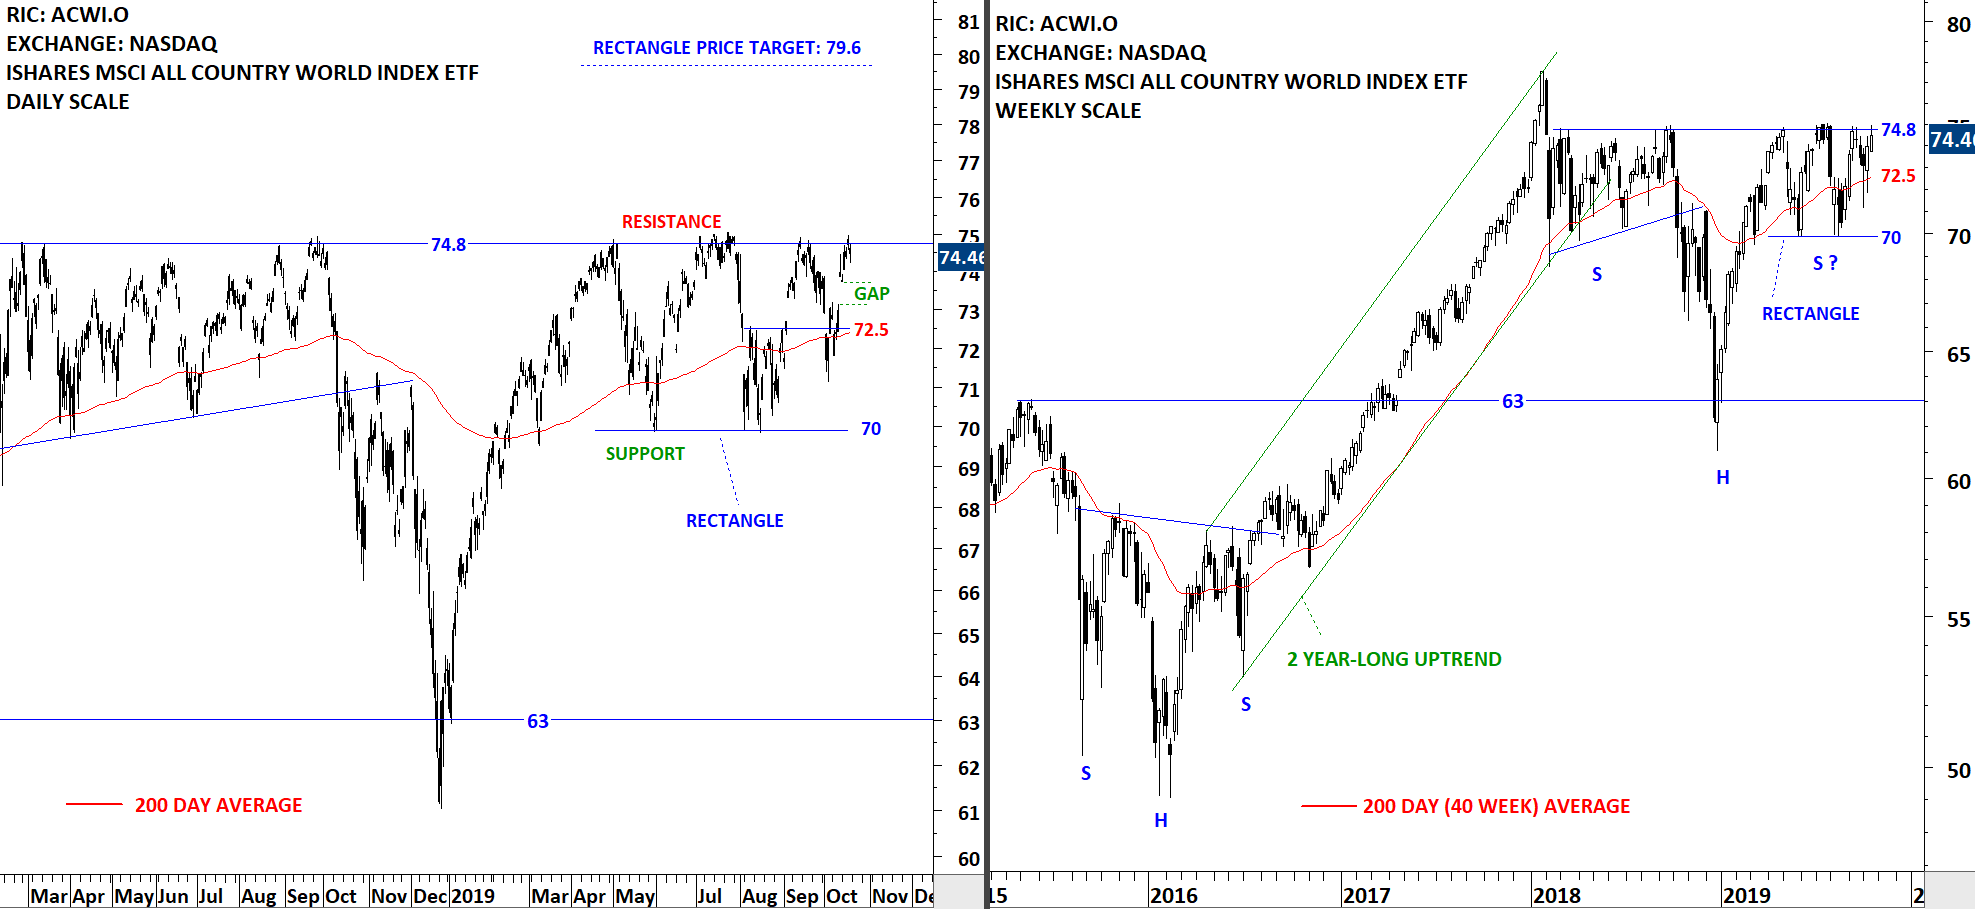
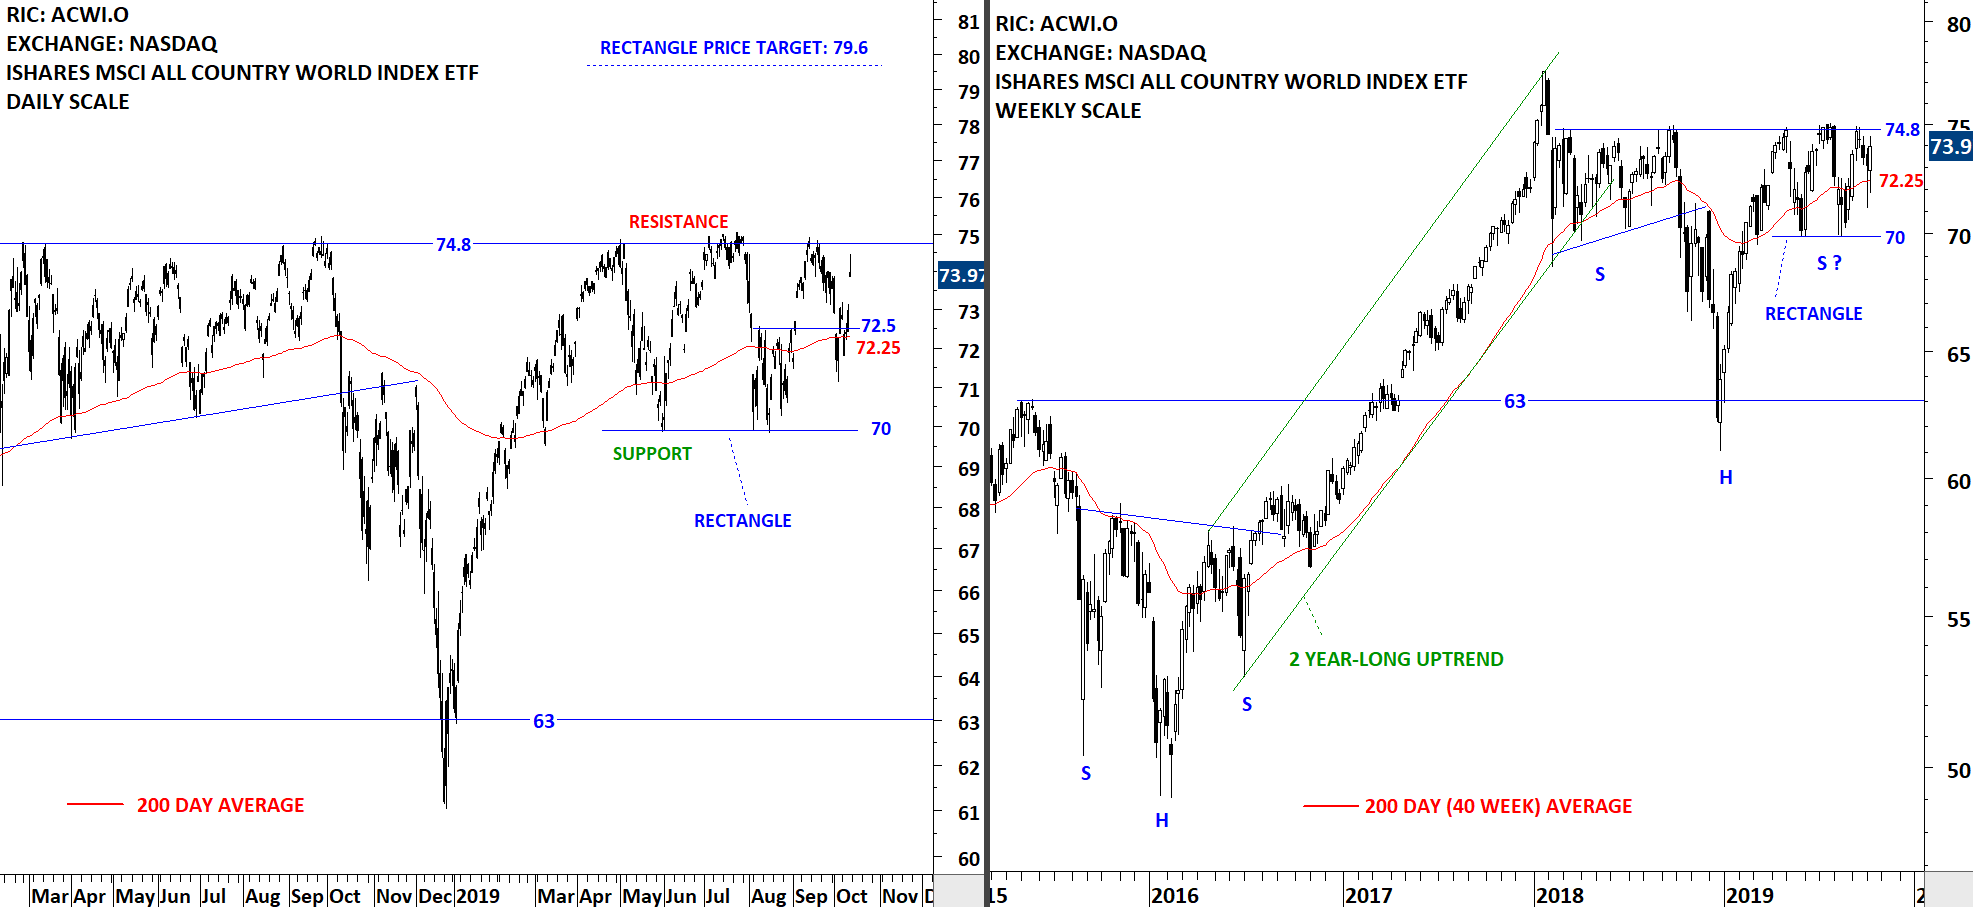
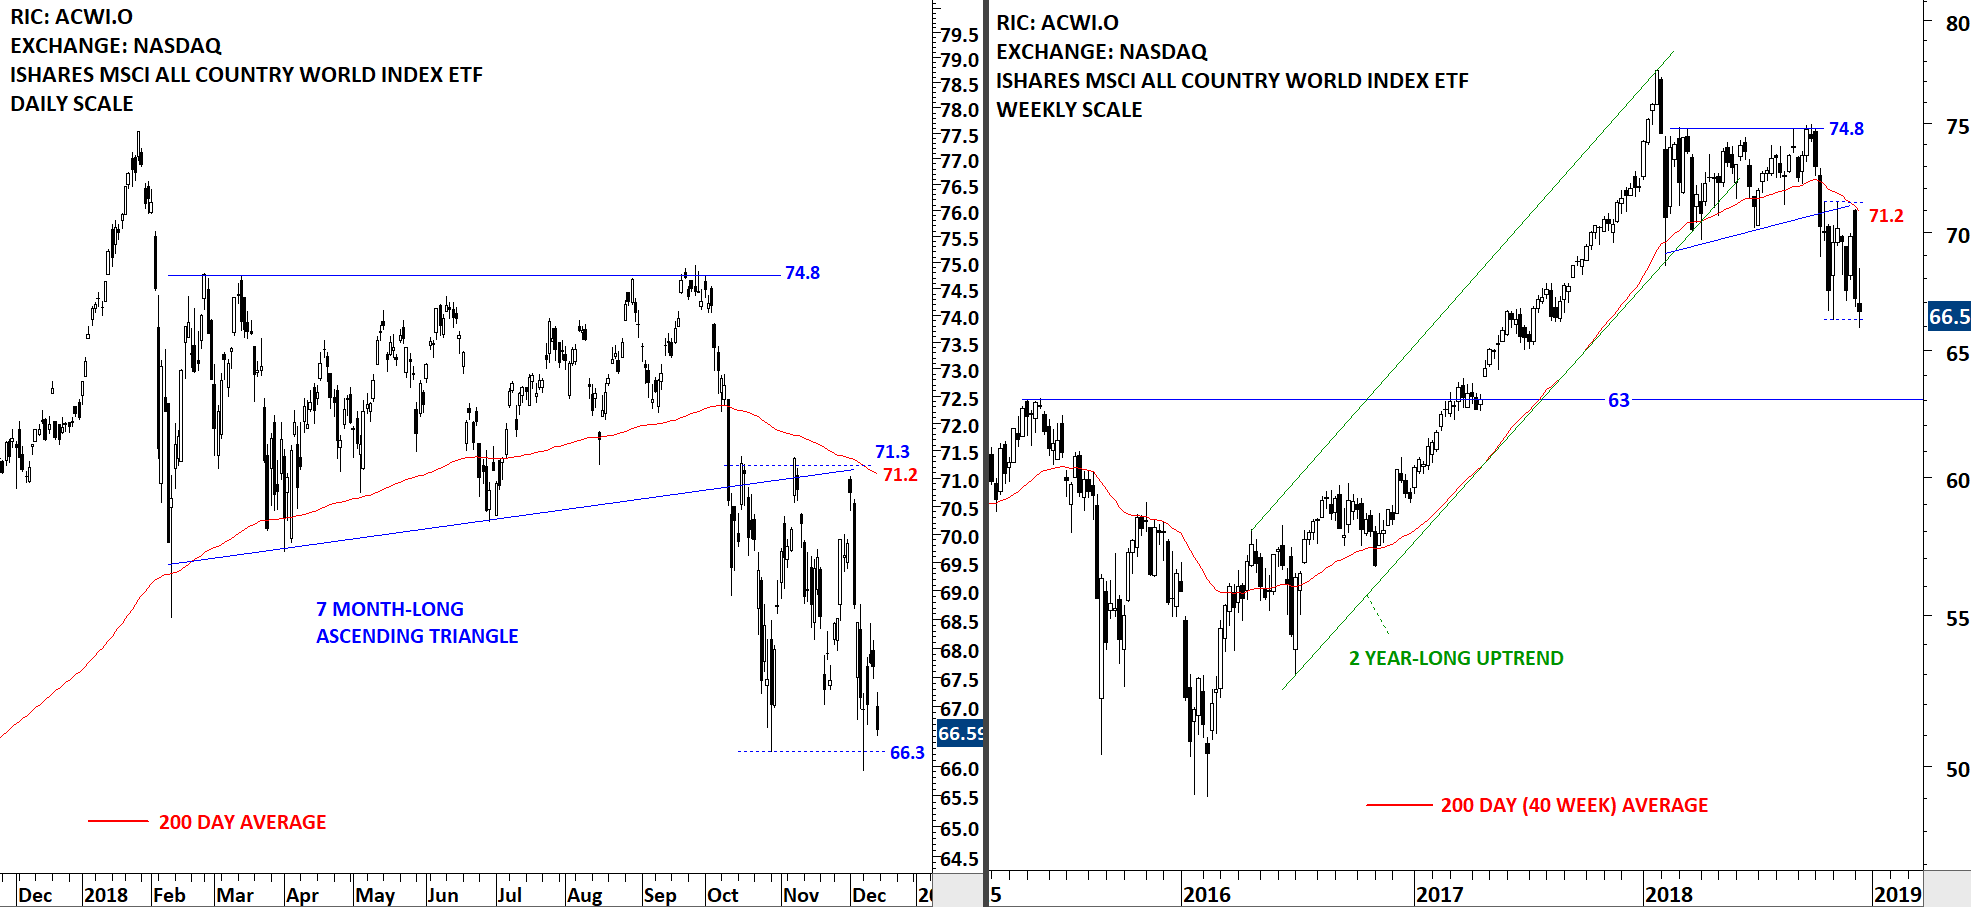
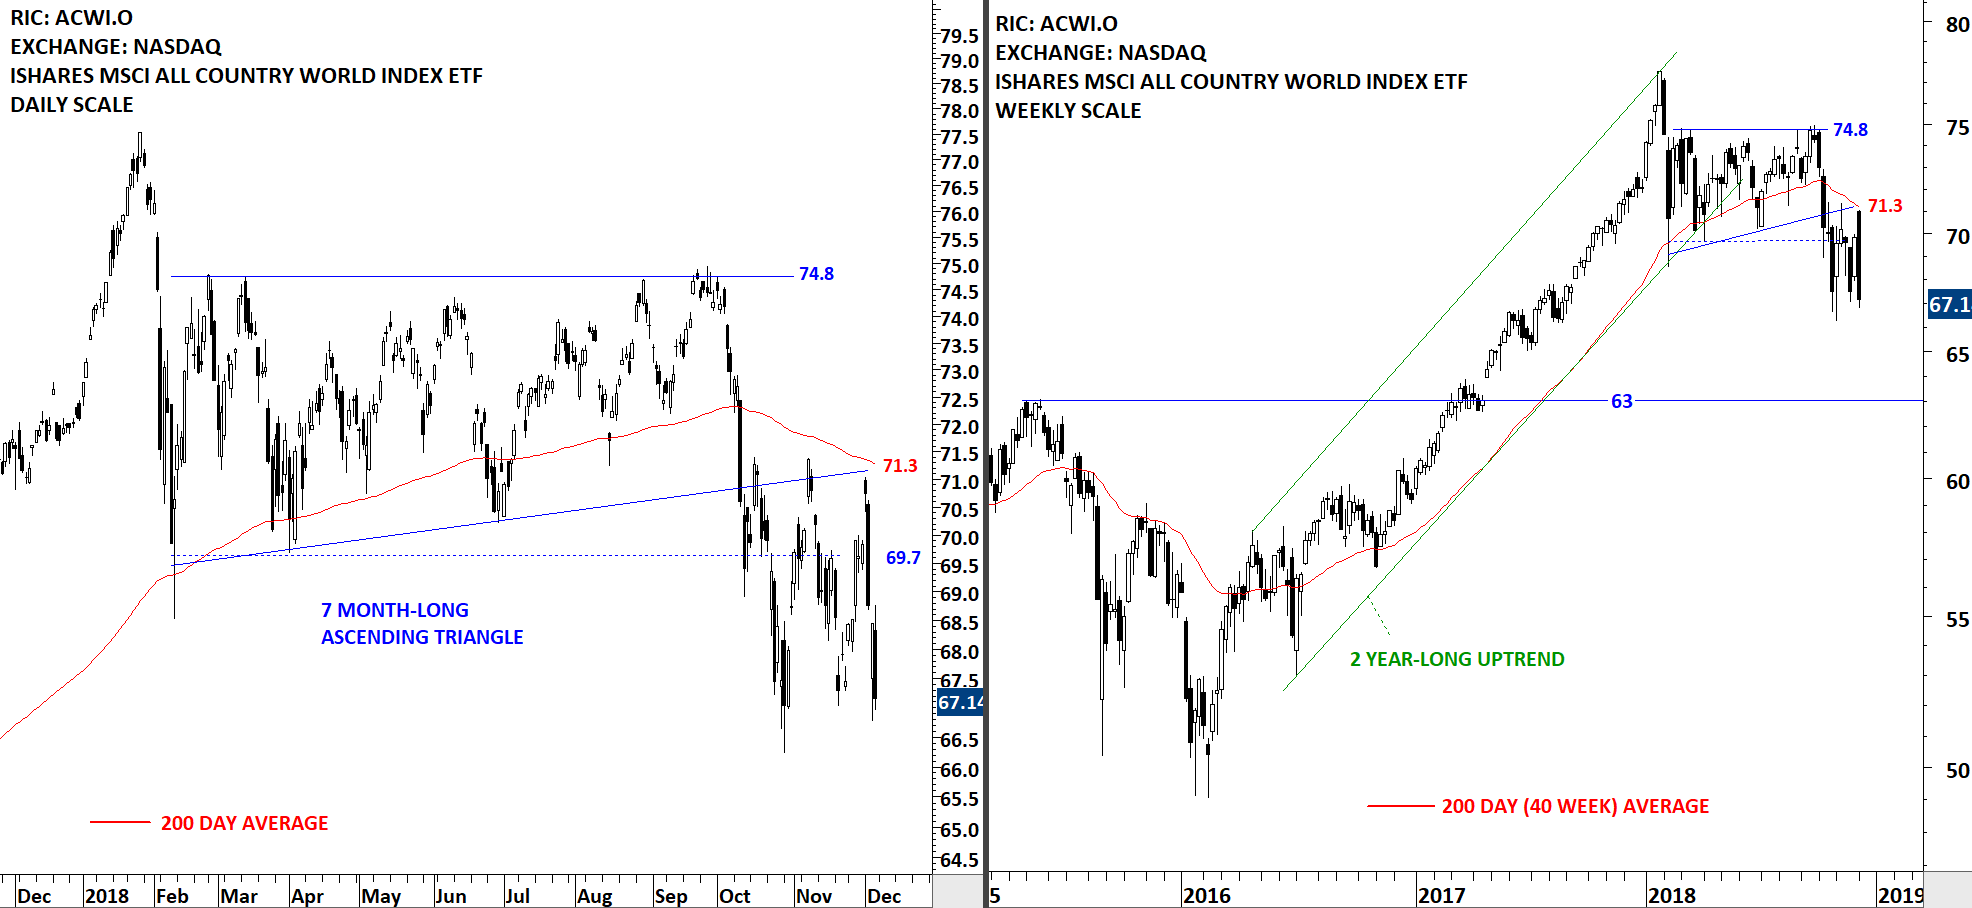
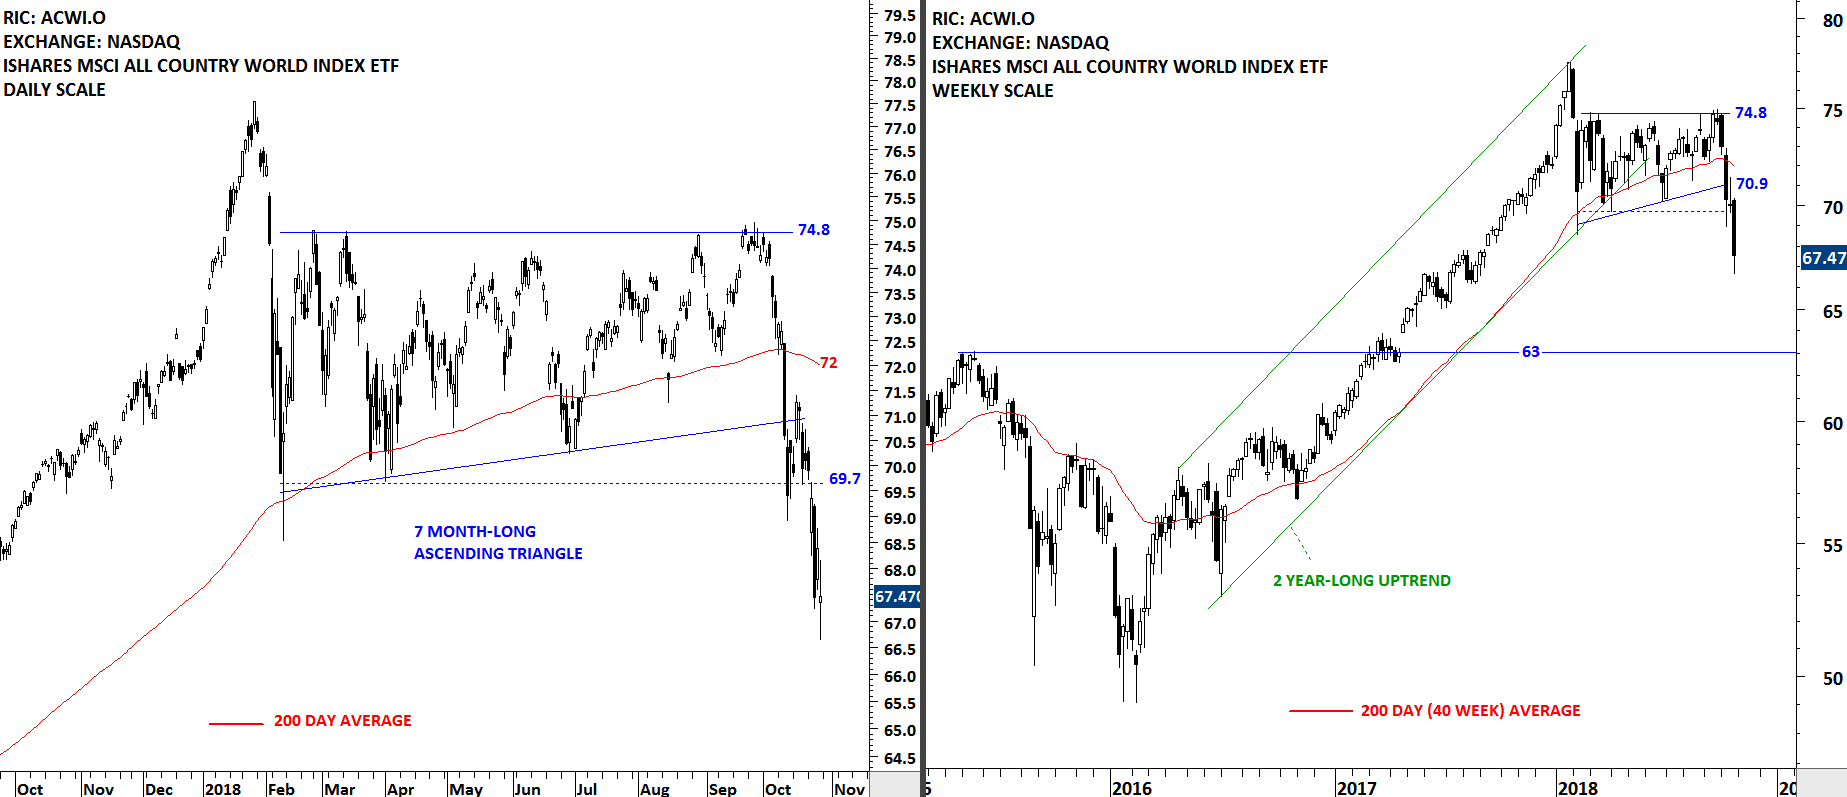
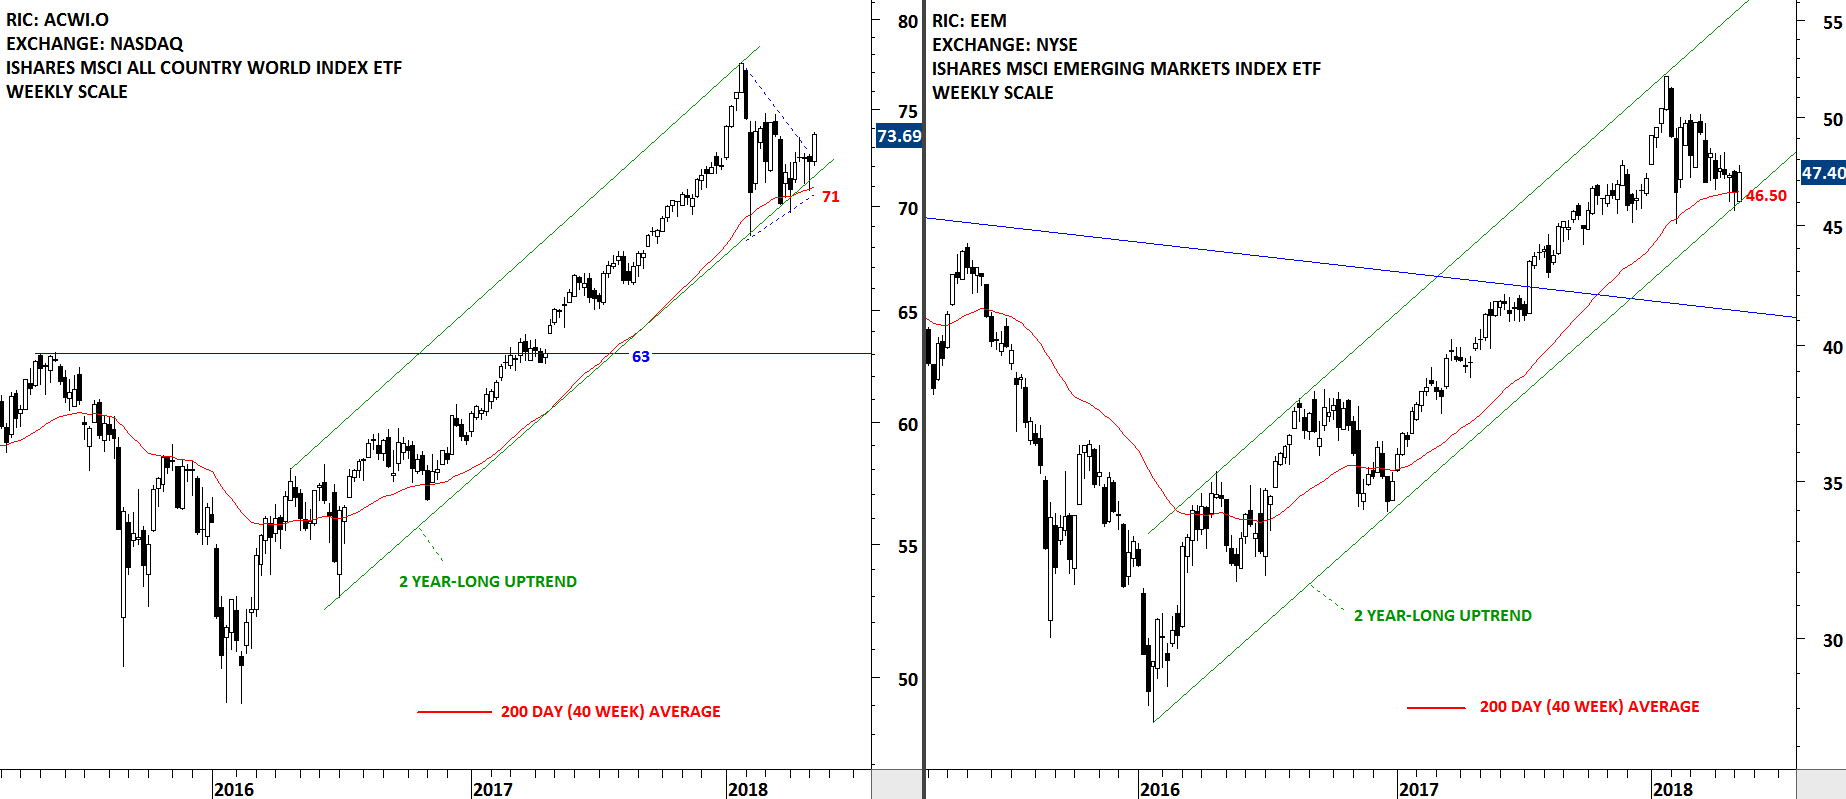
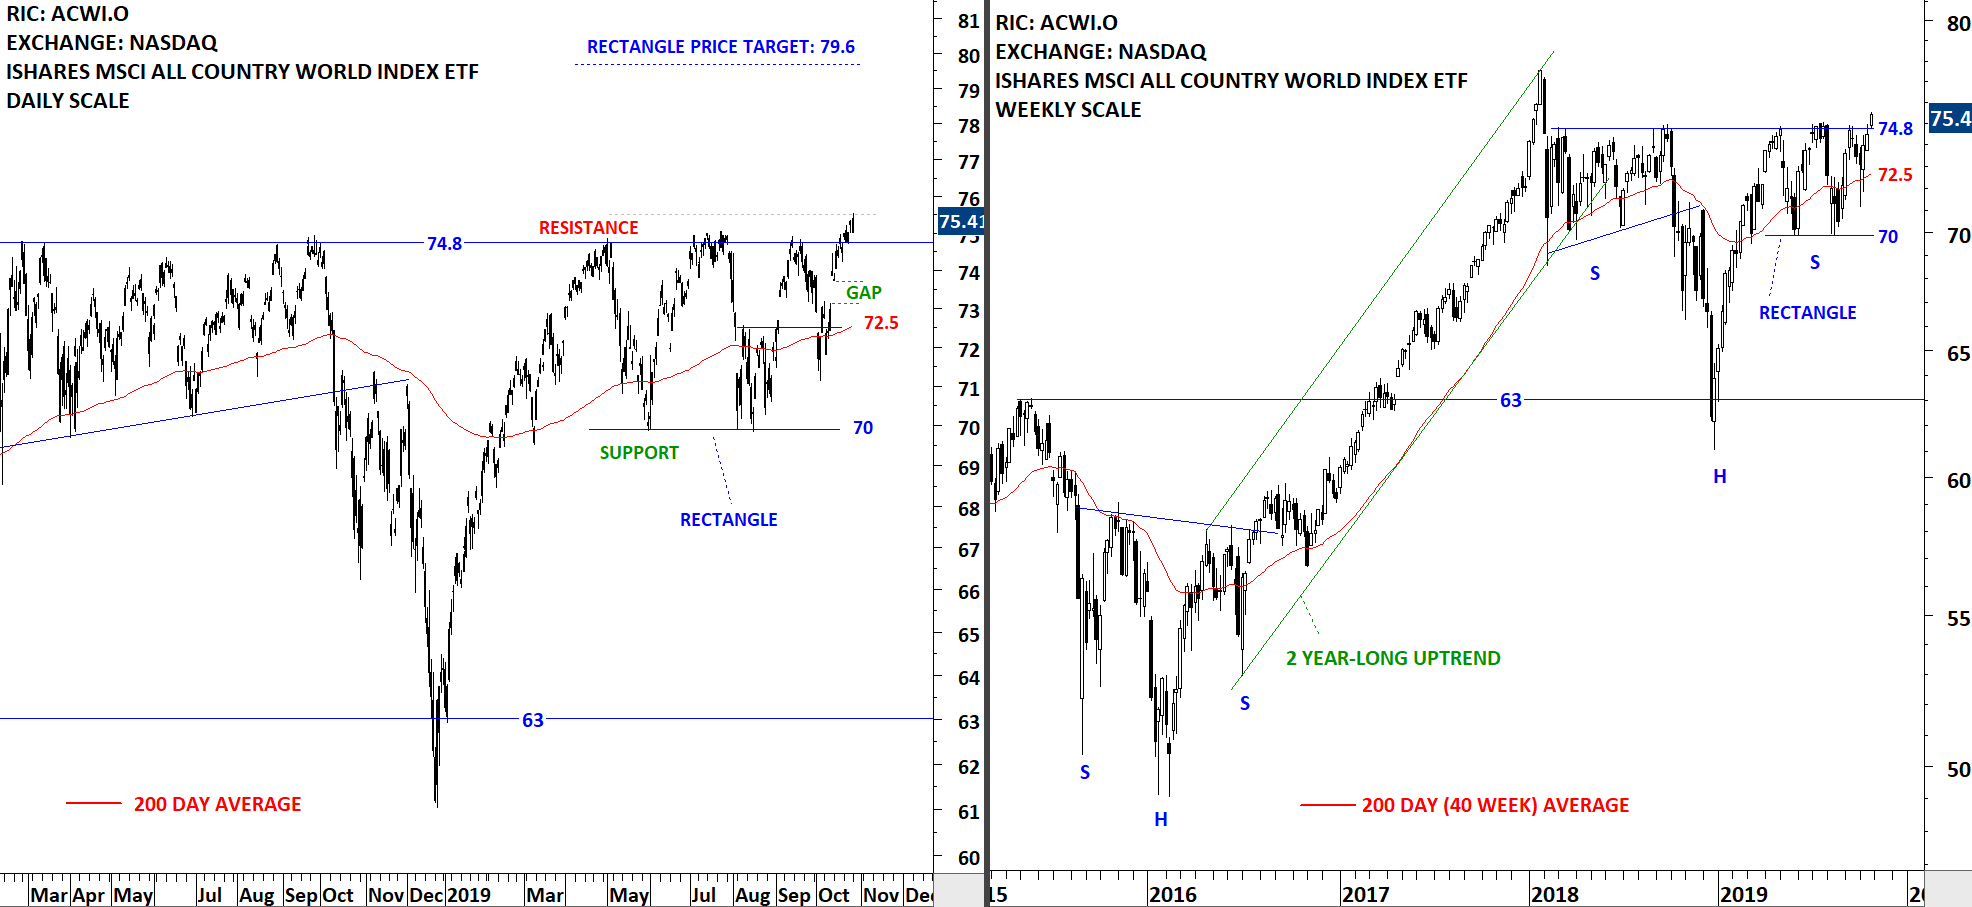
The benchmark for the Global equity markets performance, the iShares MSCI All Country World Index ETF (ACWI.O) breached the resistance at 74.8 levels. While the long-term chart pattern can be identified as a H&S continuation, the short-term chart pattern is possibly a rectangle. With ETFs and indices a breakout confirmation level of 1% can be sufficient. I will take a daily close above 75.5 levels as a breakout confirmation. I monitor this ETF for another day of strength. Possible chart pattern price target for the rectangle stands at 79.6 levels.
 Read More