SILVER and SOYBEANS
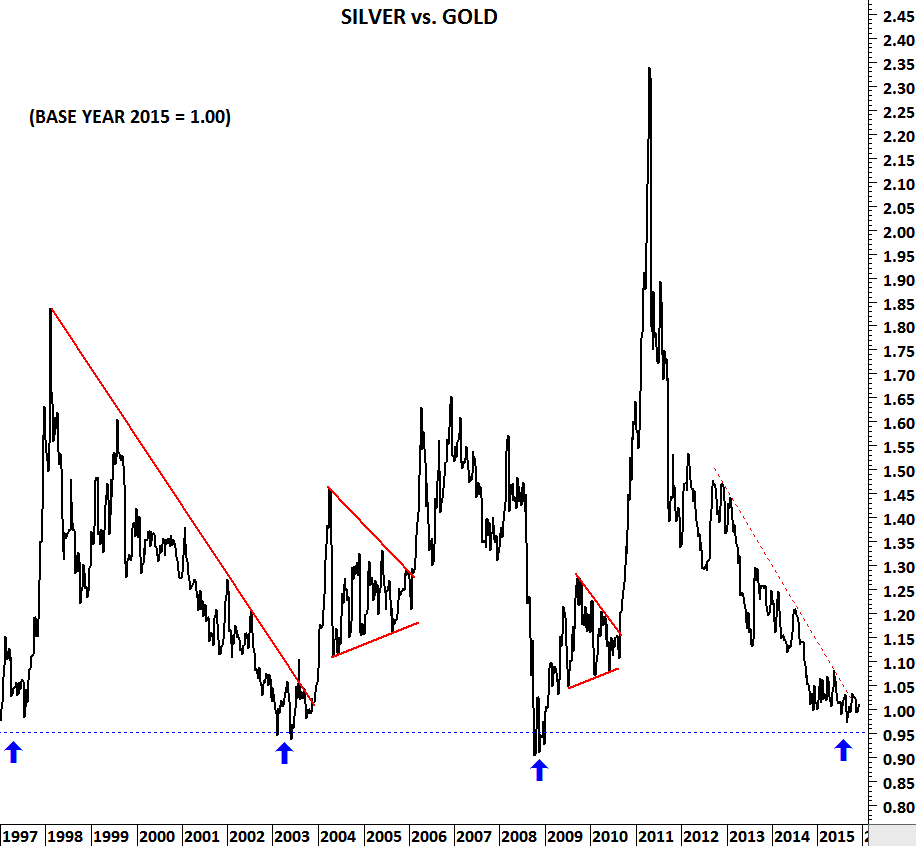
Poor man’s gold might be setting up for a strong performance in the metal complex. SILVER/GOLD ratio is reversing from a historical support area. This level acted as a medium/long-term turning point for the ratio in 1997, 2003 and in 2008. Not only the relative performance of Silver is showing strength but also the price chart of Silver forming a possible base formation. Silver has been outperforming another precious metal that has industrial use; platinum. SILVER/PLATINUM ratio is on the rise with the latest chart development suggestion even more to come. In the metals, silver can be a winner.
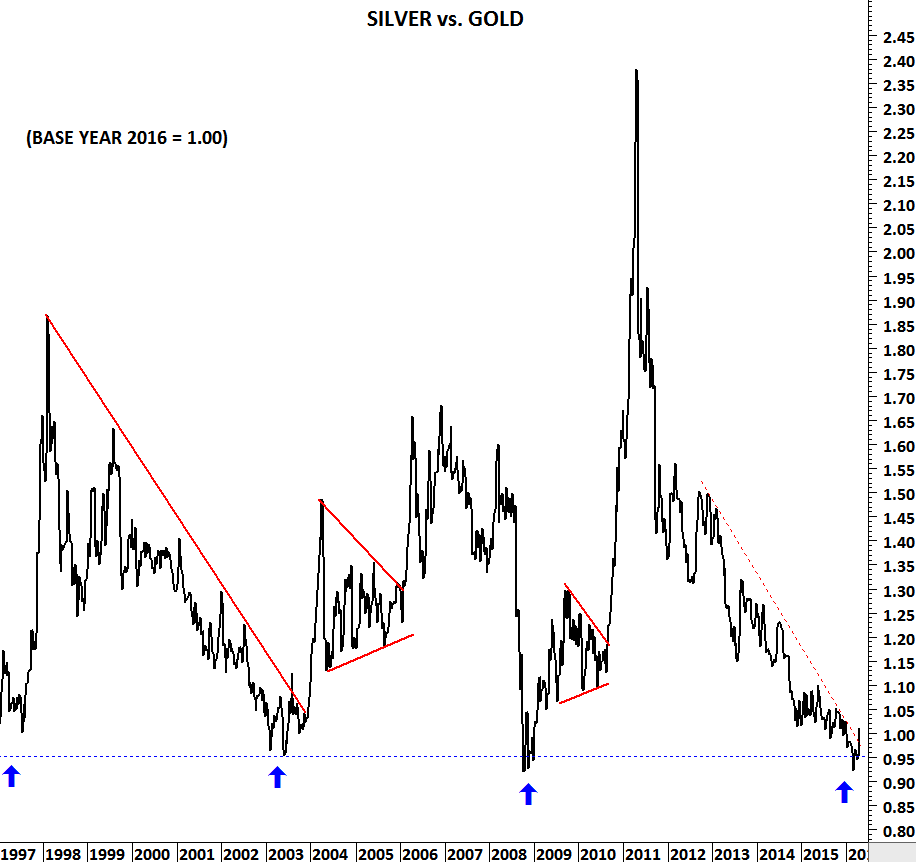
SILVER VS GOLD WEEKLY SCALE RATIO
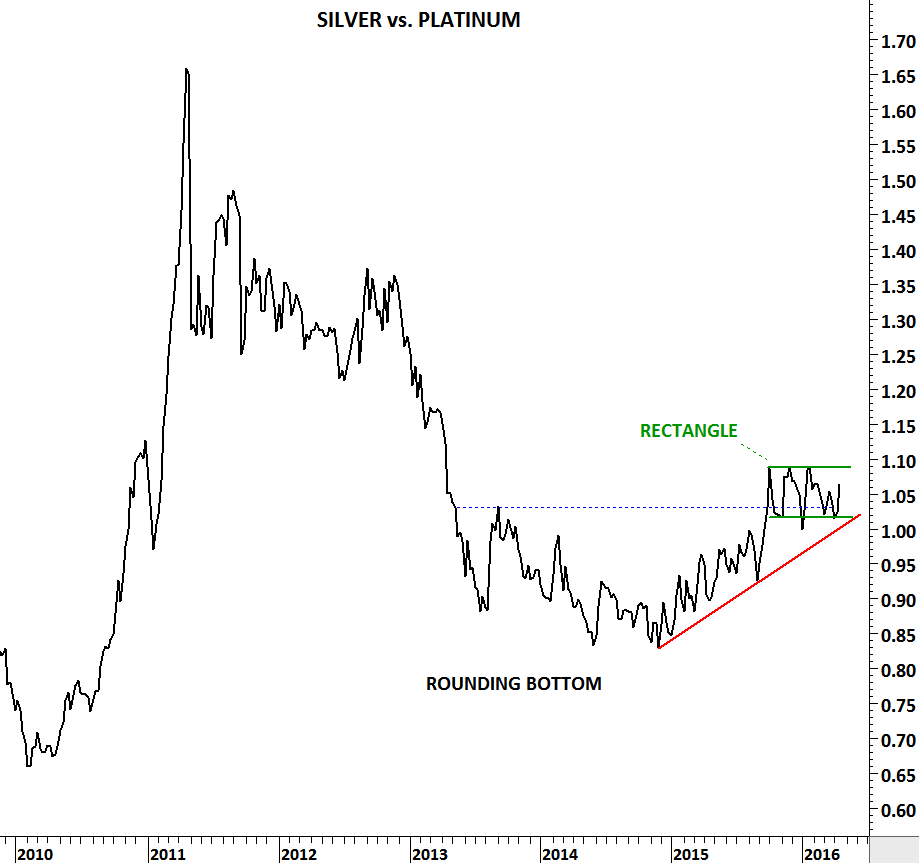
SILVER VS PLATINUM WEEKLY SCALE RATIO
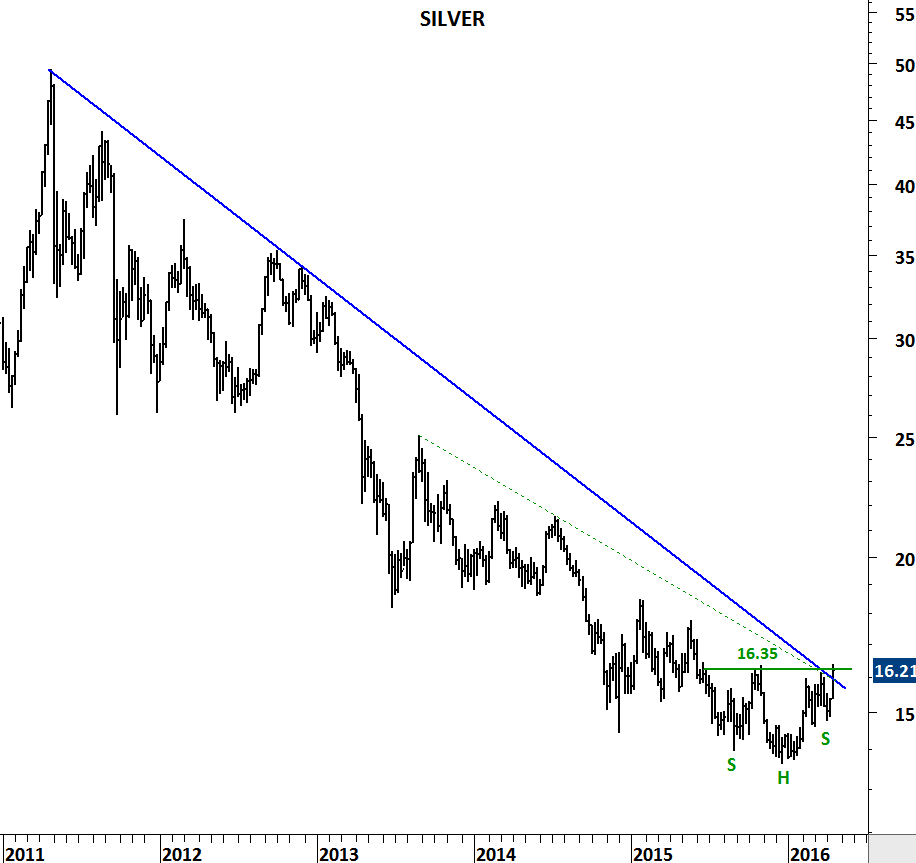
Over the past year, Silver possibly formed a head and shoulder base with a neckline at 16.35 levels. Breakout above 16.35 will clear multi-year downward trend lines and also the year-long horizontal resistance. Weekly price closed at 16.21 levels.
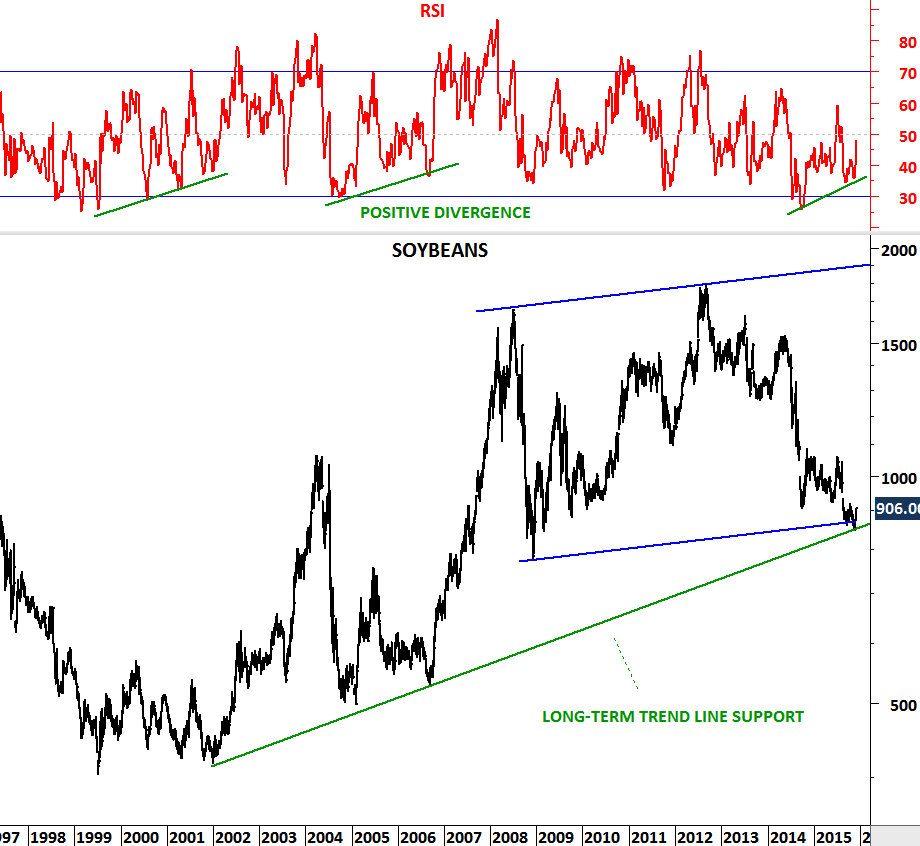
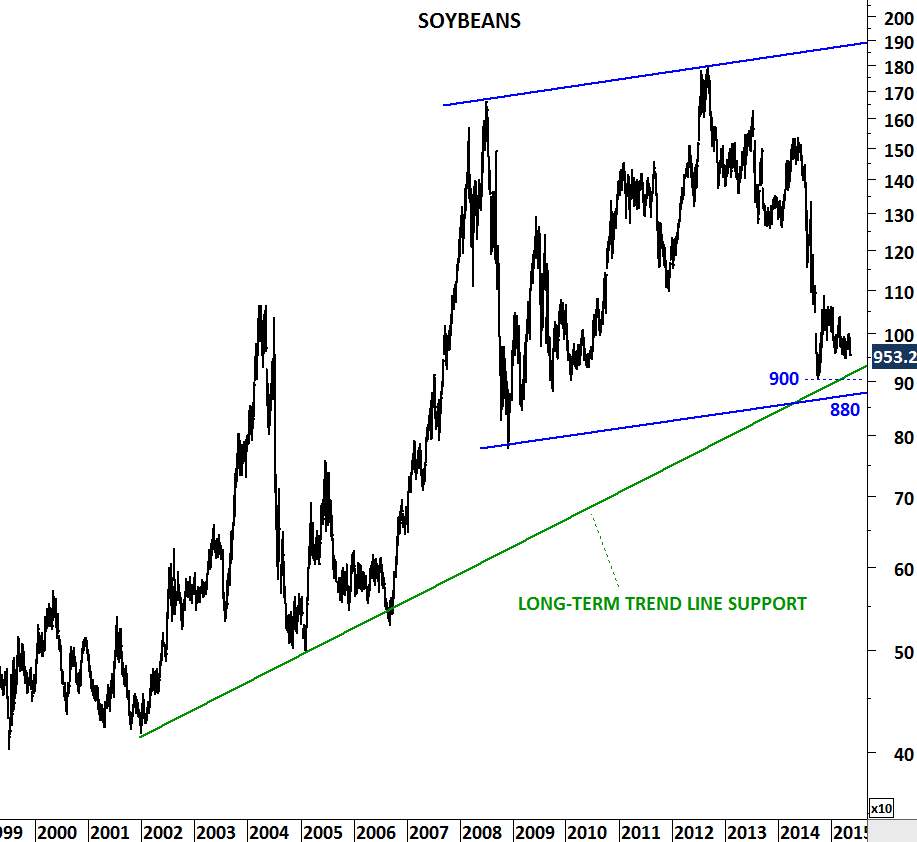
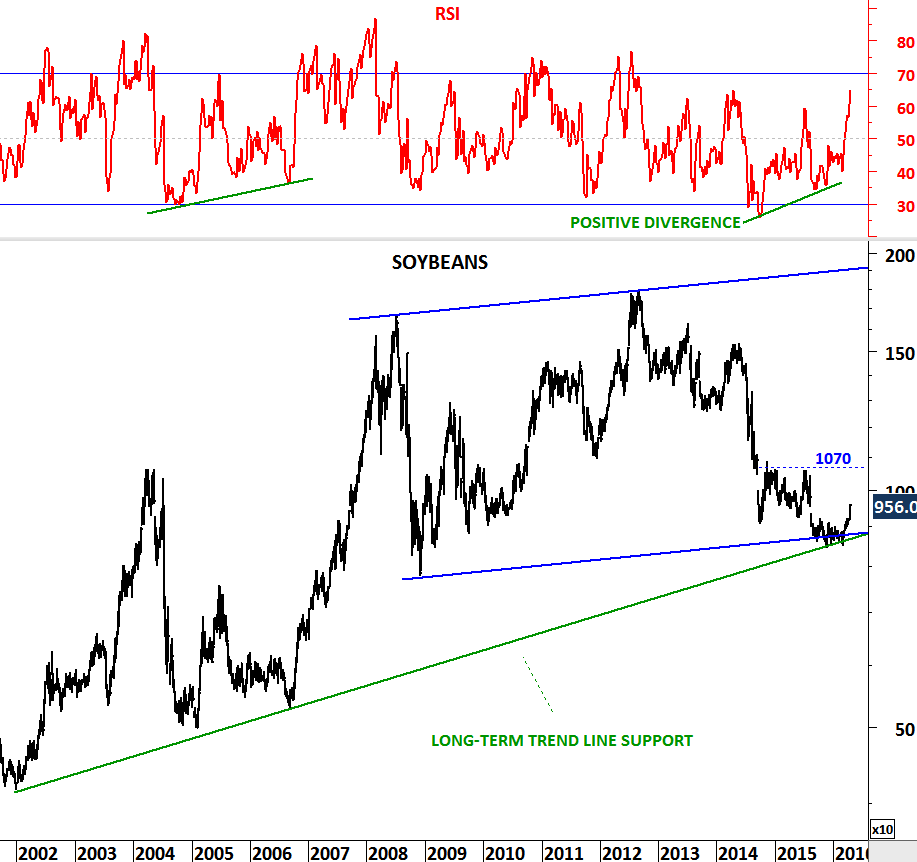
Another long-term opportunity might be developing on Soybeans price chart. Over the past few weeks, Soybeans reversed from an important inflection point. Two long-term trend lines overlapped around 850 levels. Last week’s strong weekly price bar suggests possible strength for the following weeks. Resistance area on the first month continuation chart is around 1070.
WEEKLY SCALE PRICE CHART