GLOBAL EQUITY MARKETS – April 7, 2018
REVIEW
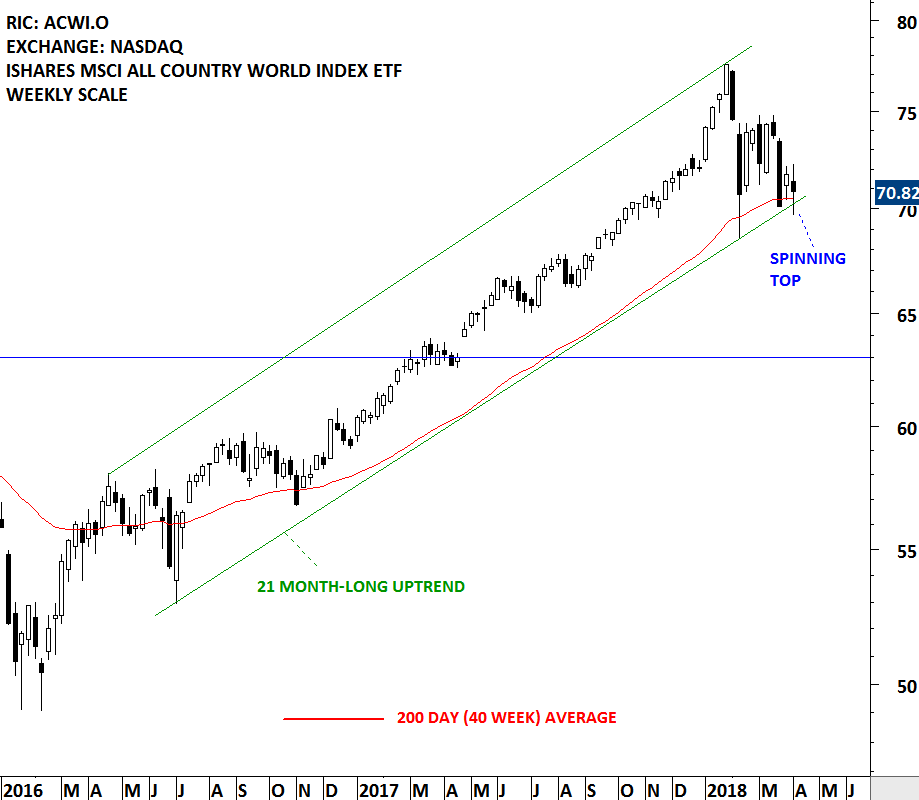
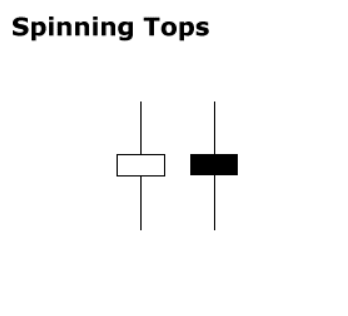 Indecision. Jury is still out. This week's price action is best explained with the help of candlestick patterns definitions. Spinning top is a candlestick with a long upper shadow, long lower shadow, and small real body. One long shadow represents a reversal of sorts; spinning tops represent indecision. The small real body (whether hollow or filled) shows little movement from open to close, and the shadows indicate that both bulls and bears were active during the session. Even though the week opened and closed with little change, prices moved significantly higher and lower in the meantime. Neither buyers nor sellers could gain the upper hand and the result was a standoff. After a long advance or long white candlestick, a spinning top indicates weakness among the bulls and a potential change or interruption in trend. After a long decline (I think this is what we experienced over the past 3 weeks) or long black candlestick, a spinning top indicates weakness among the bears and a potential change or interruption in trend.
 Read More