GLOBAL EQUITY MARKETS – December 28, 2019
Dear Tech Charts members,
Another year is almost behind us. 2019 has been a productive year. Your communications and feedback has been helpful in improving the membership service and I'm thankful for that. Without your support I would not be able to put out this product. I hope the ideas, the educational content, webinars and reports have added value in your decision making. Guided and motivated by our members feedback and comments there will be several new additions to Tech Charts membership service in the new Year. I look forward to announcing them as the new Year progresses. I wish all of you a healthy and successful new Year and I would like to thank you for being a Tech Charts member.
Regards,
Aksel Kibar, CMT
REVIEW
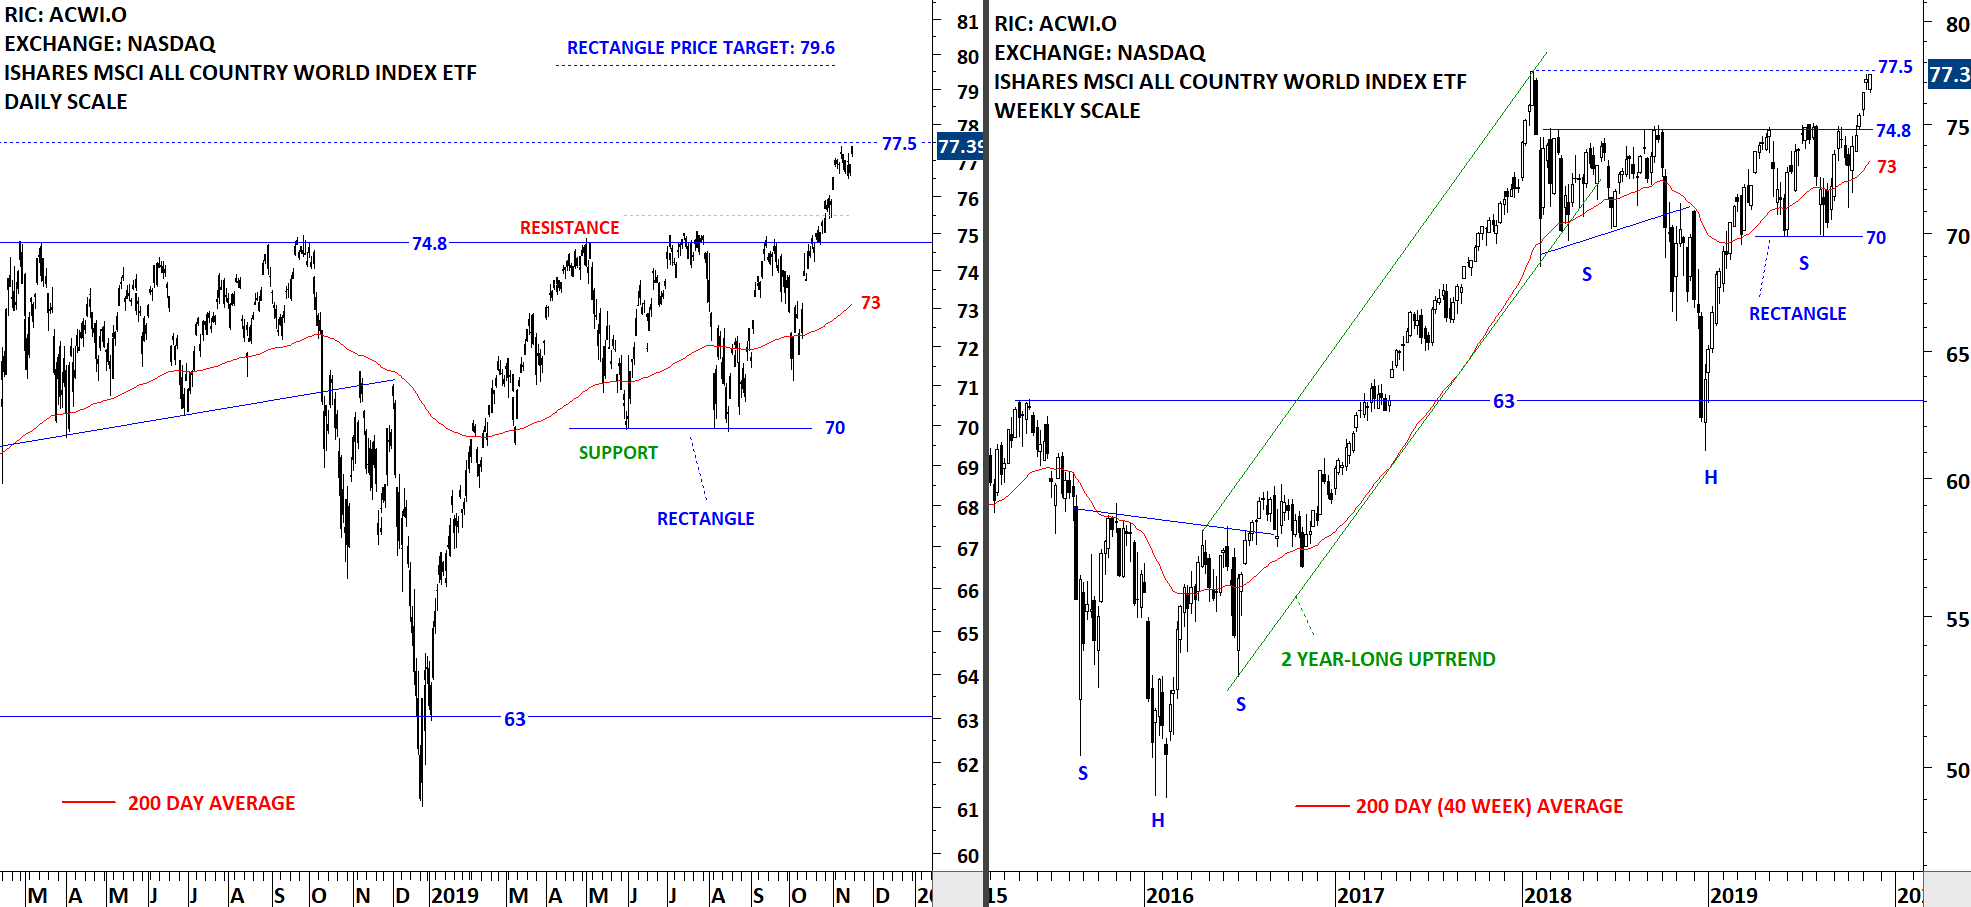
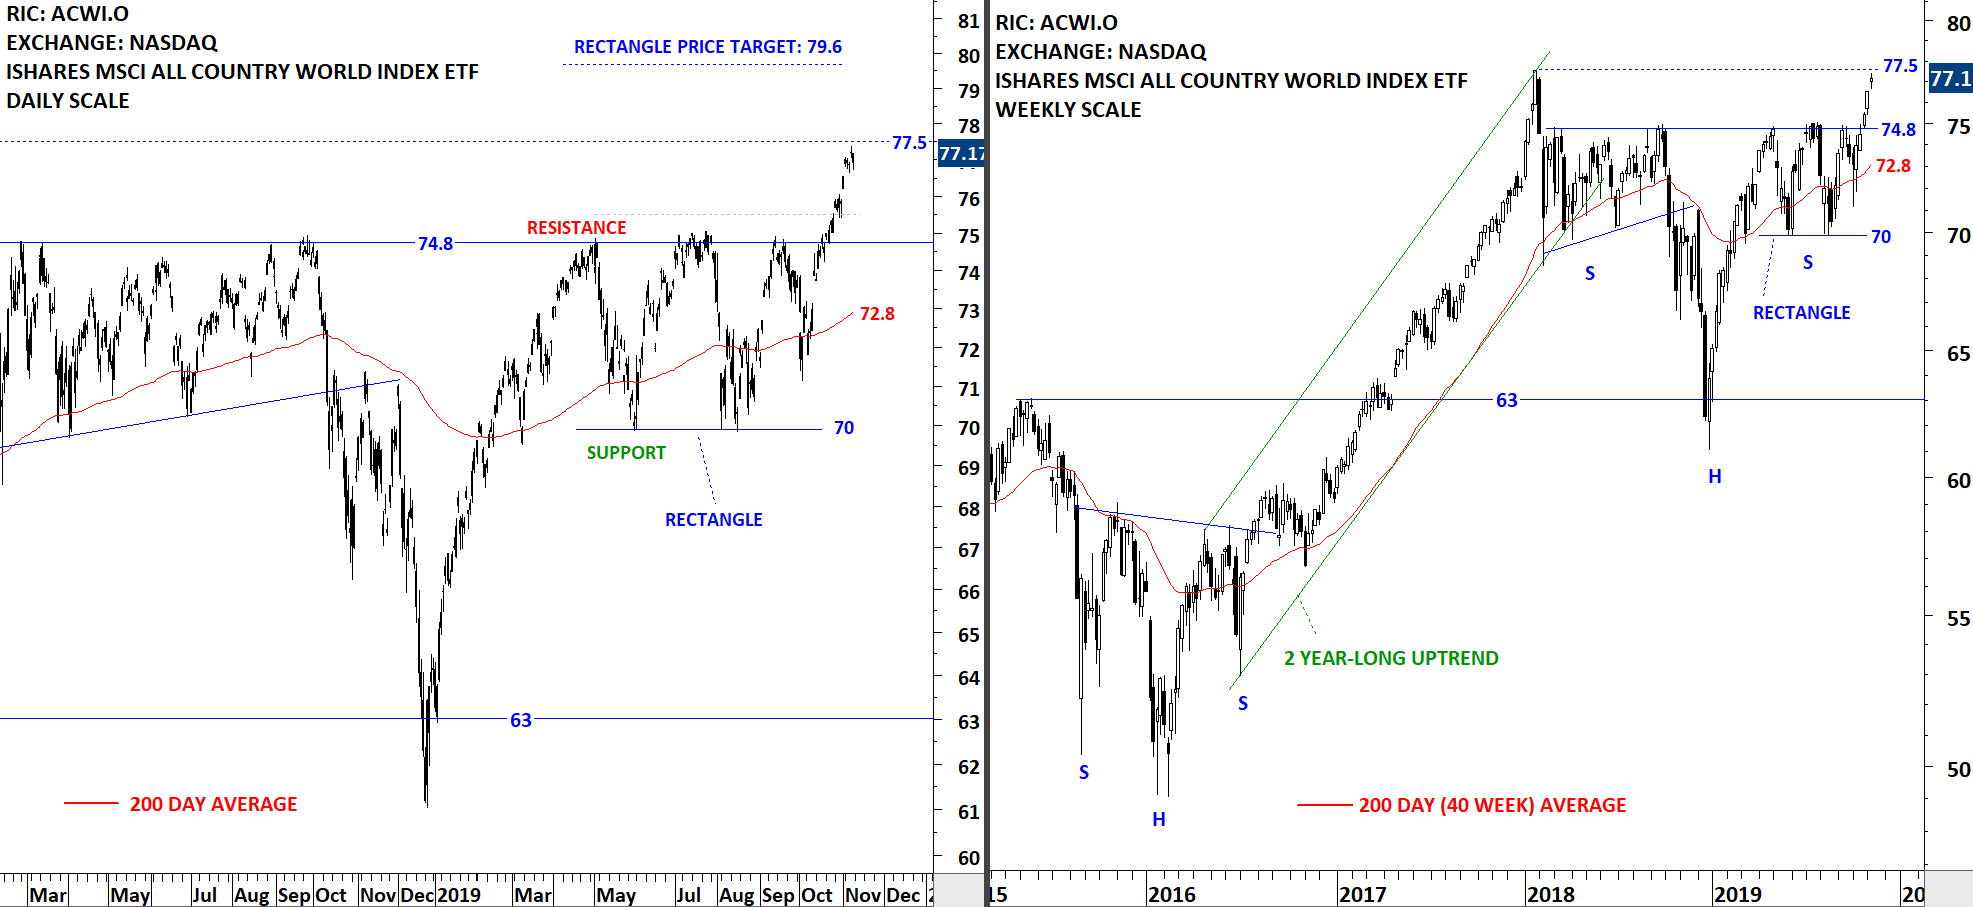
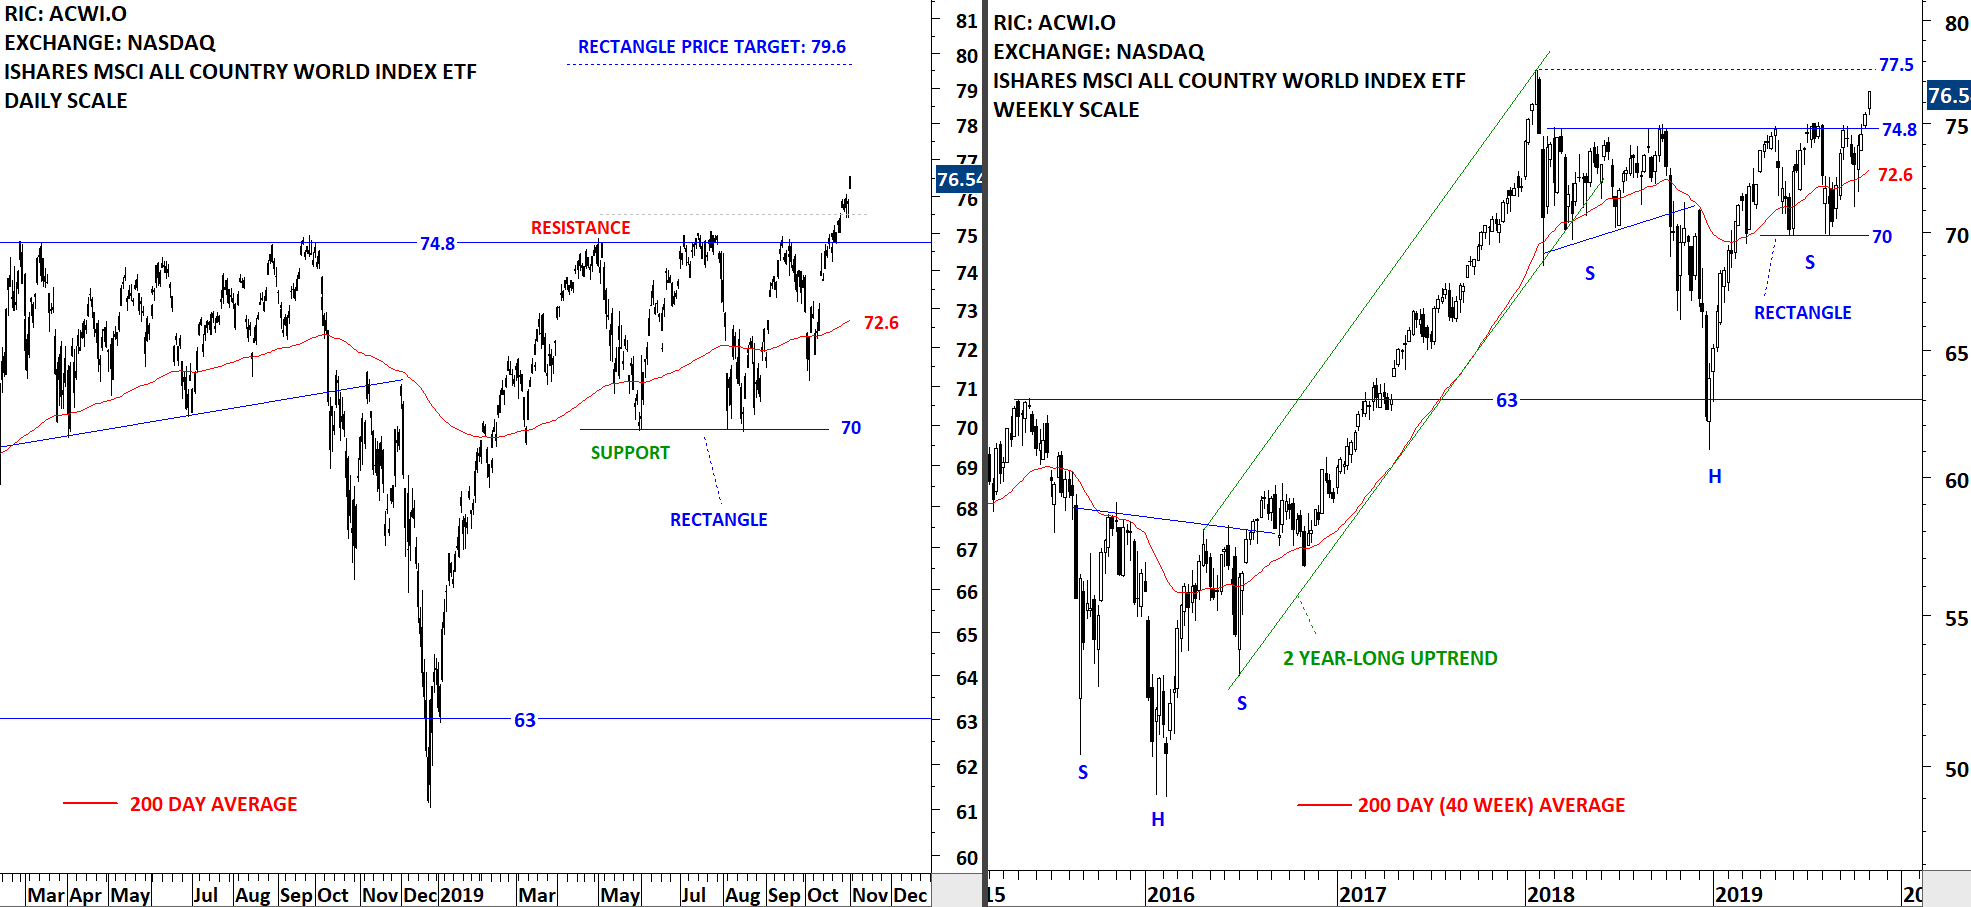
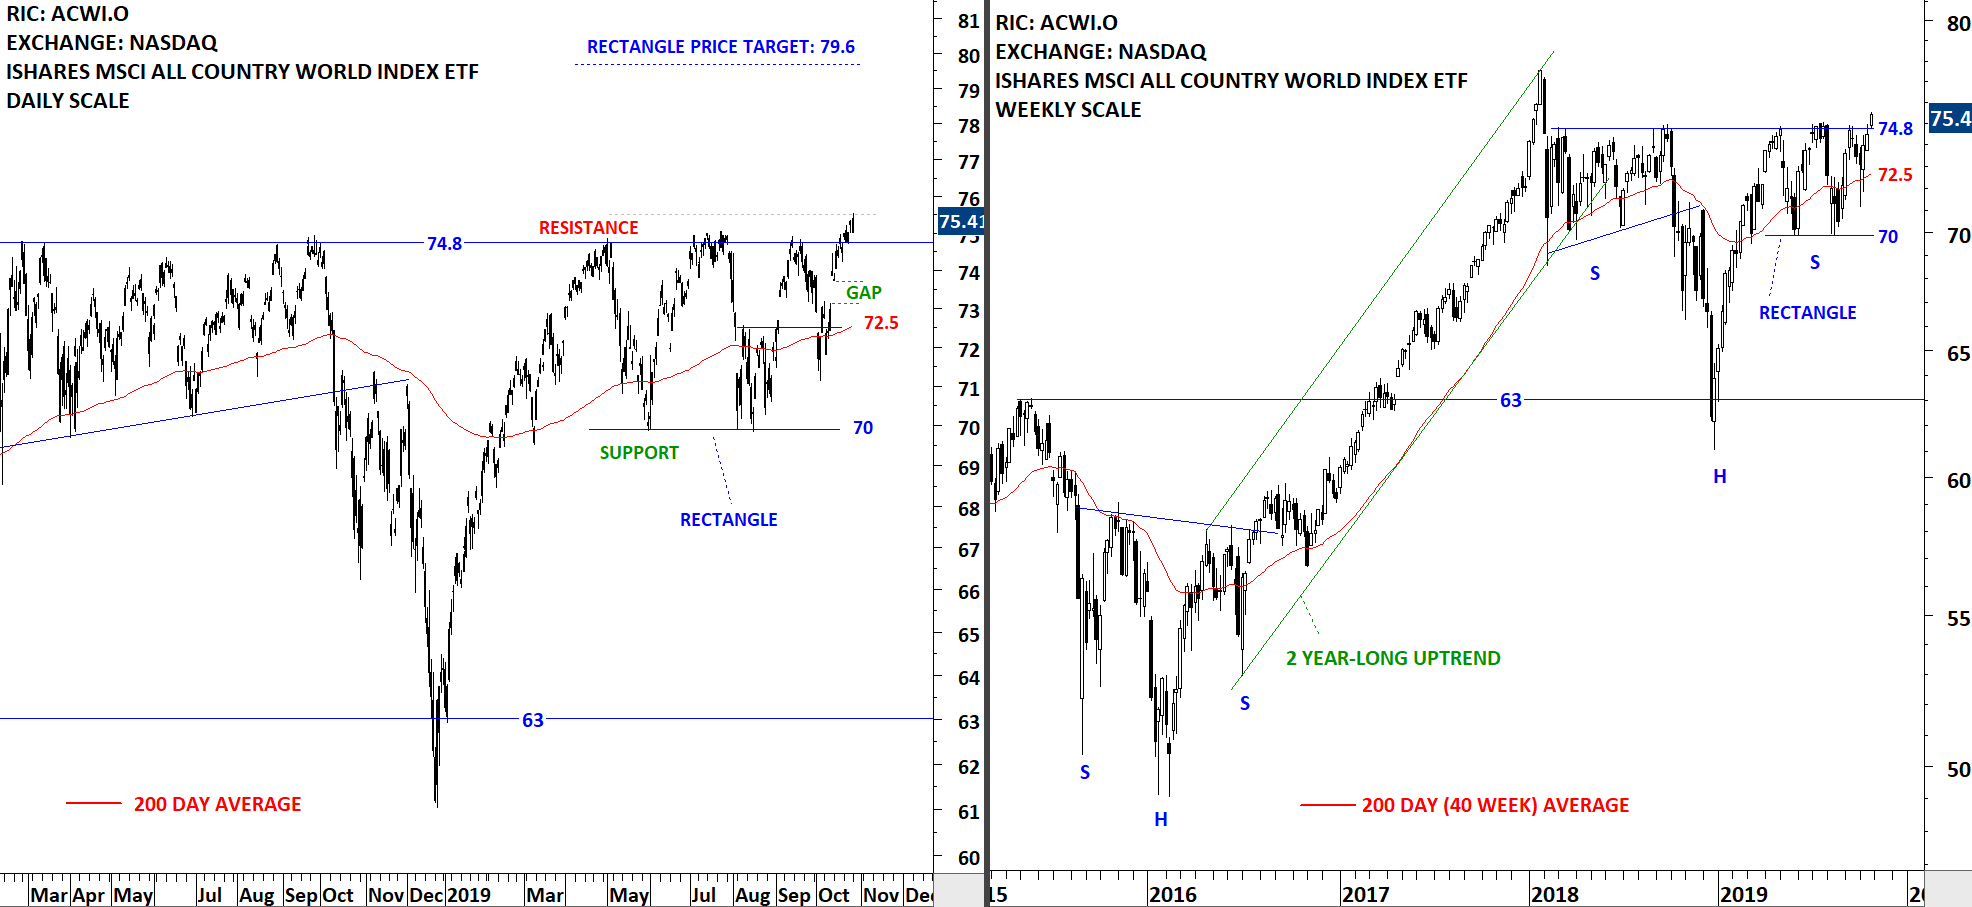
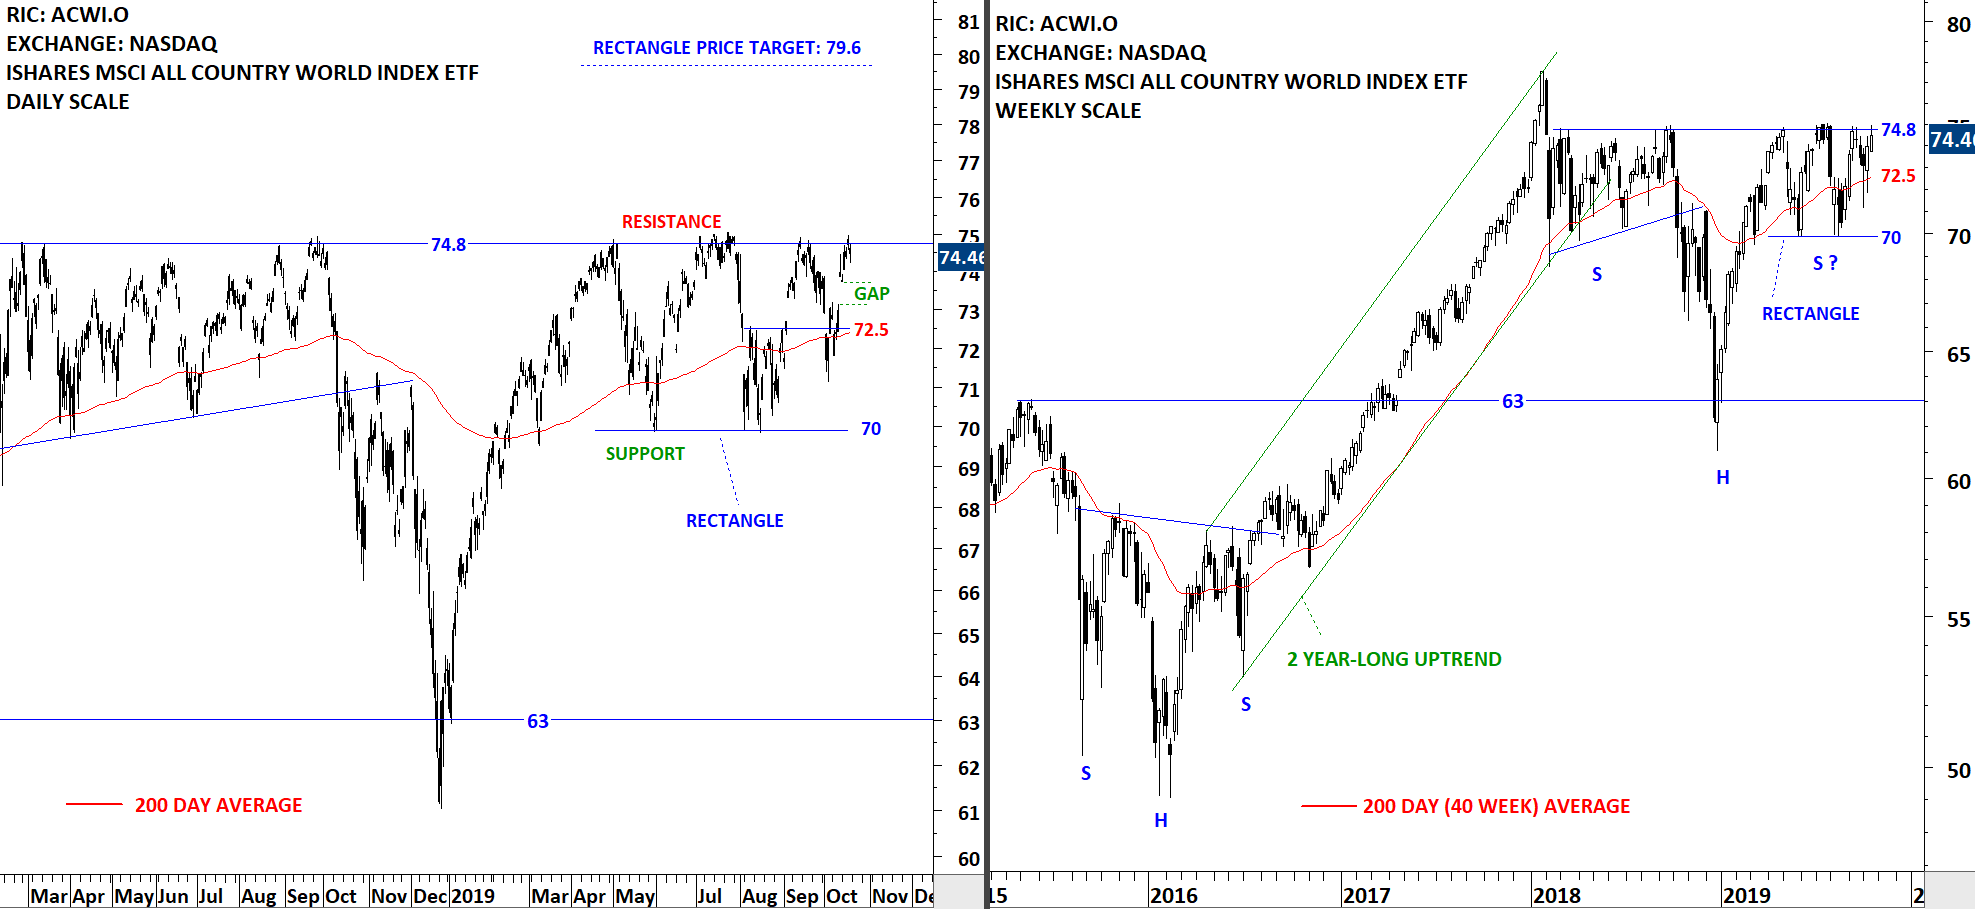
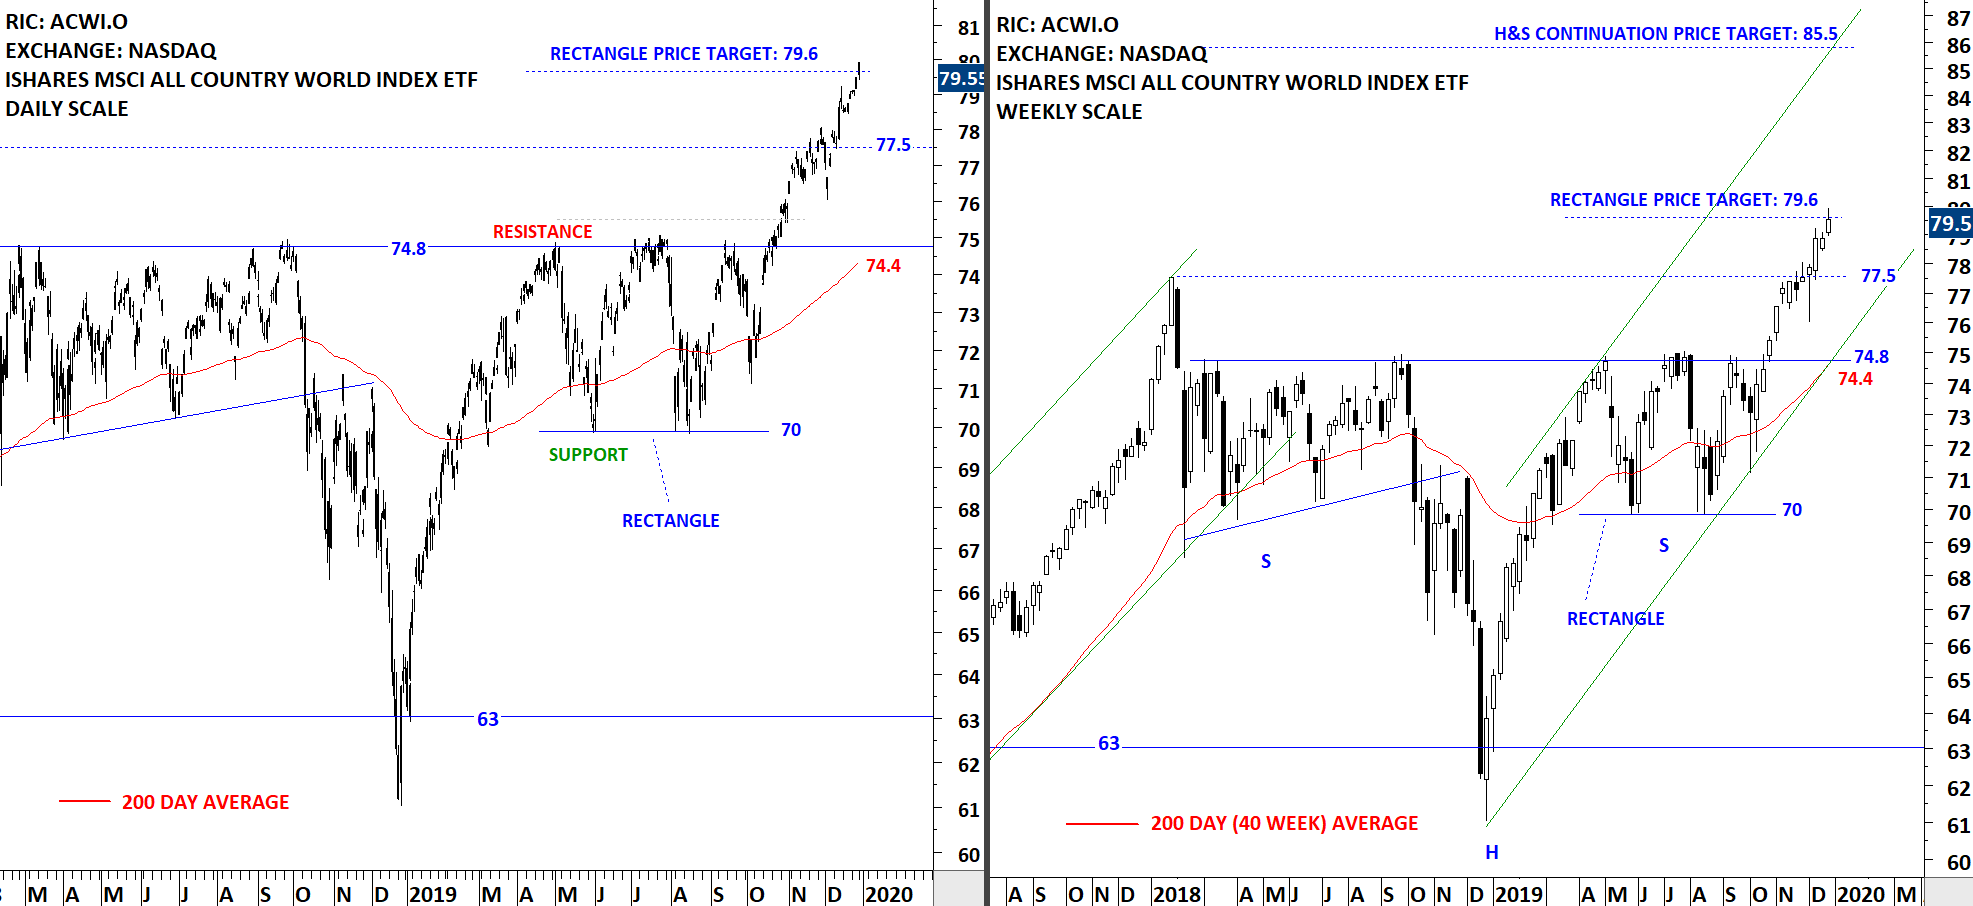
The benchmark for the Global equity markets performance, the iShares MSCI All Country World Index ETF (ACWI.O) reached its initial price target after completing both the rectangle and H&S continuation chart patterns. The right shoulder of a possible H&S continuation was identified as a rectangle with the price target of 79.6 levels. This week's price action pushed the ETF towards its rectangle chart pattern price target. Long-term chart pattern price objective stands at 85.5 levels. During any pullback, the high of 2018 (77.5) can act as support. Daily and weekly price charts show a steady uptrend.
 Read More