Posts

GLOBAL EQUITY MARKETS – October 13, 2018

REVIEW


Since the beginning of 2018, the performance between Emerging Markets and Developed Markets diverged. Emerging Markets have underperformed the Developed Markets by around 15%. Two charts below show the relative performance ratio between EEM and ACWI and also the MSCI indices, MSCI Emerging Markets Index vs. MSCI World Markets Index. You can see the fluctuations on the ratio over the years.

2016-2017 was a period of EM outperformance. In the beginning of 2018, the ratio reversed sharply and the past 10 months resulted in a massive underperformance for the Emerging Markets. We might be at an inflection point as the ratio is now testing 2016 lows. Emerging Markets might start outperforming the Developed Markets once again. (The ratio is calculated by dividing two time series EEM & ACWI and indexing it to 1 on the 1st January 2018)

Read More

A REVIEW ON ASIAN EQUITY BENCHMARKS

Every week Tech Charts Global Equity Markets report features some of the well-defined, mature classical chart patterns under a lengthy watchlist and the chart pattern breakout signals that took place during that week. Global Equity Markets report covers single stocks from developed, emerging and frontier markets, ETF’s and global equity indices. The report starts with a review section that highlights the important chart developments on global equity benchmarks. This blog post features part of the review section highlighting chart pattern developments on Asian equity benchmarks.

REVIEW


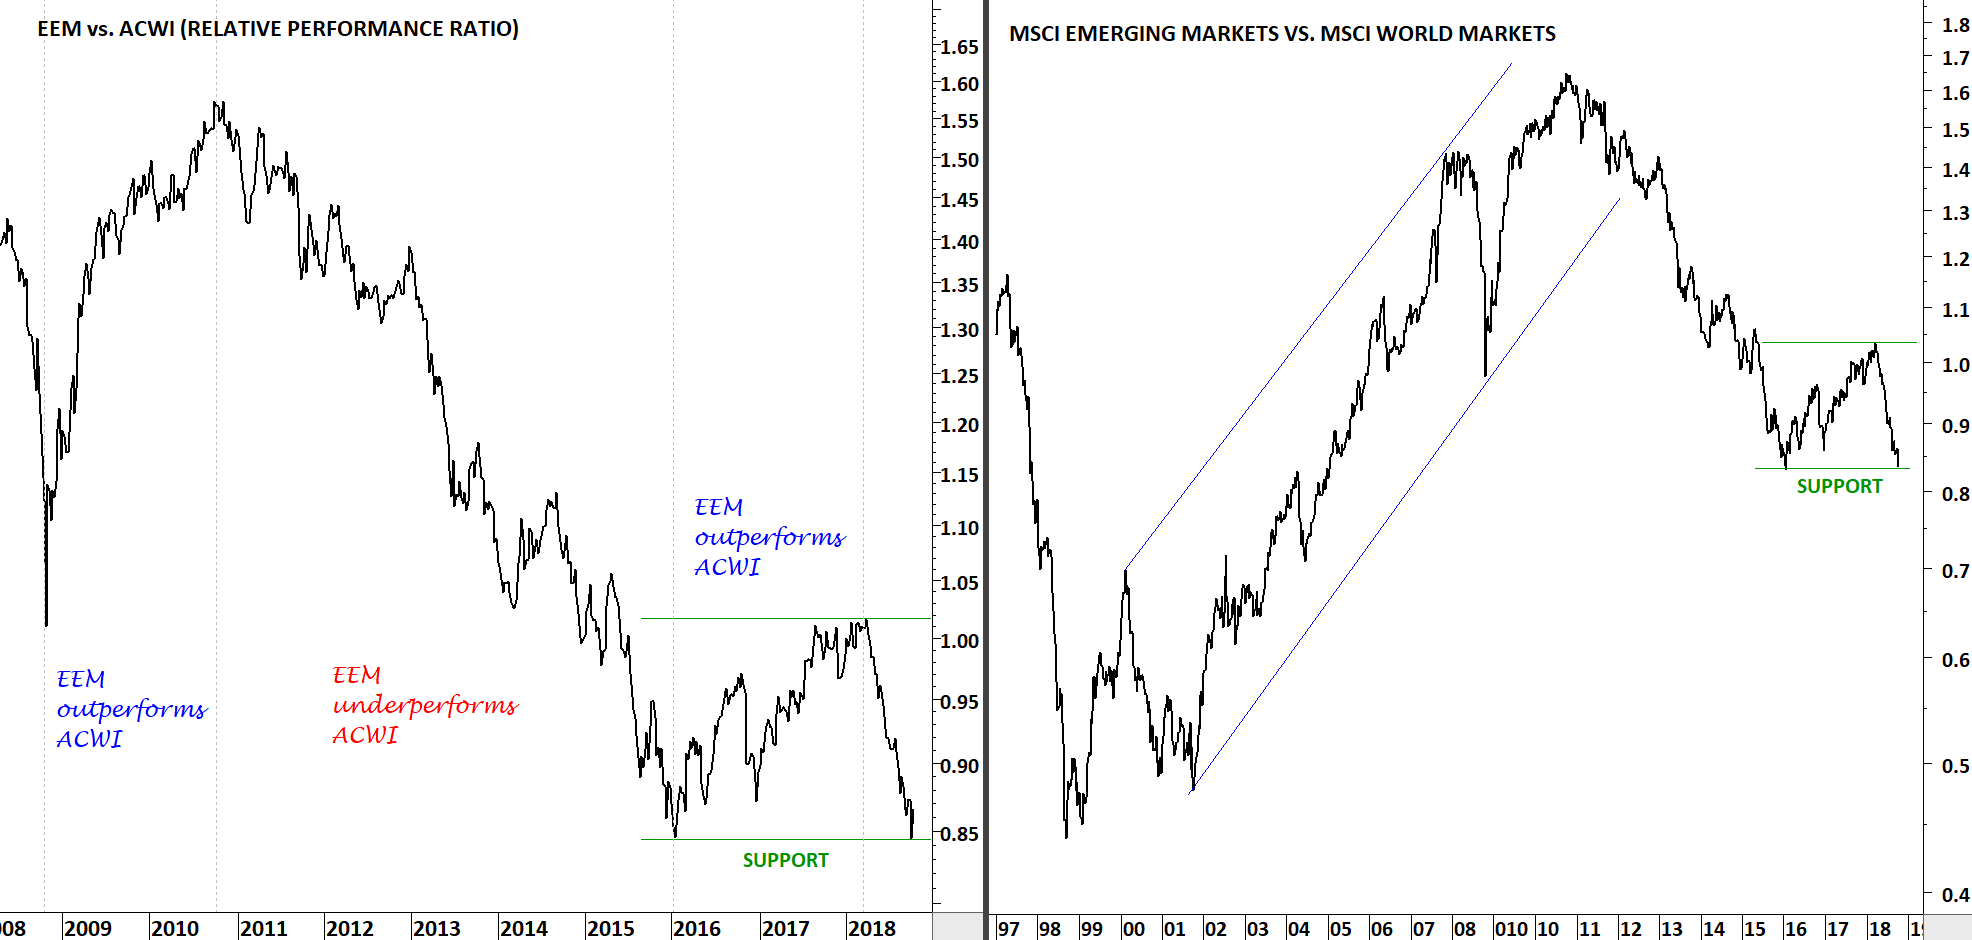
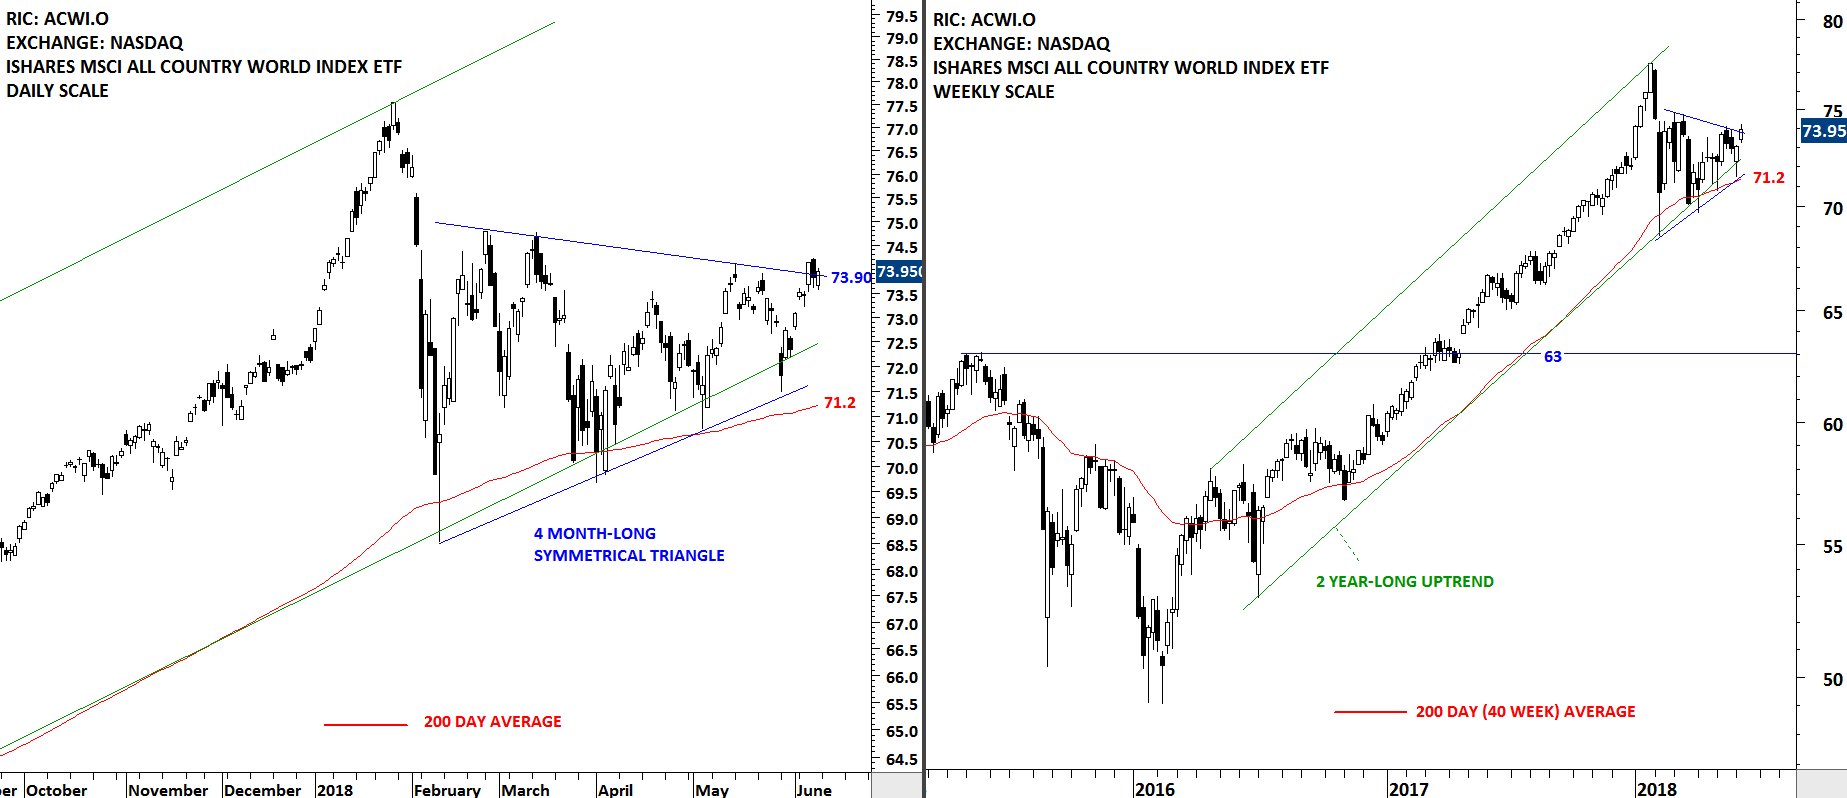
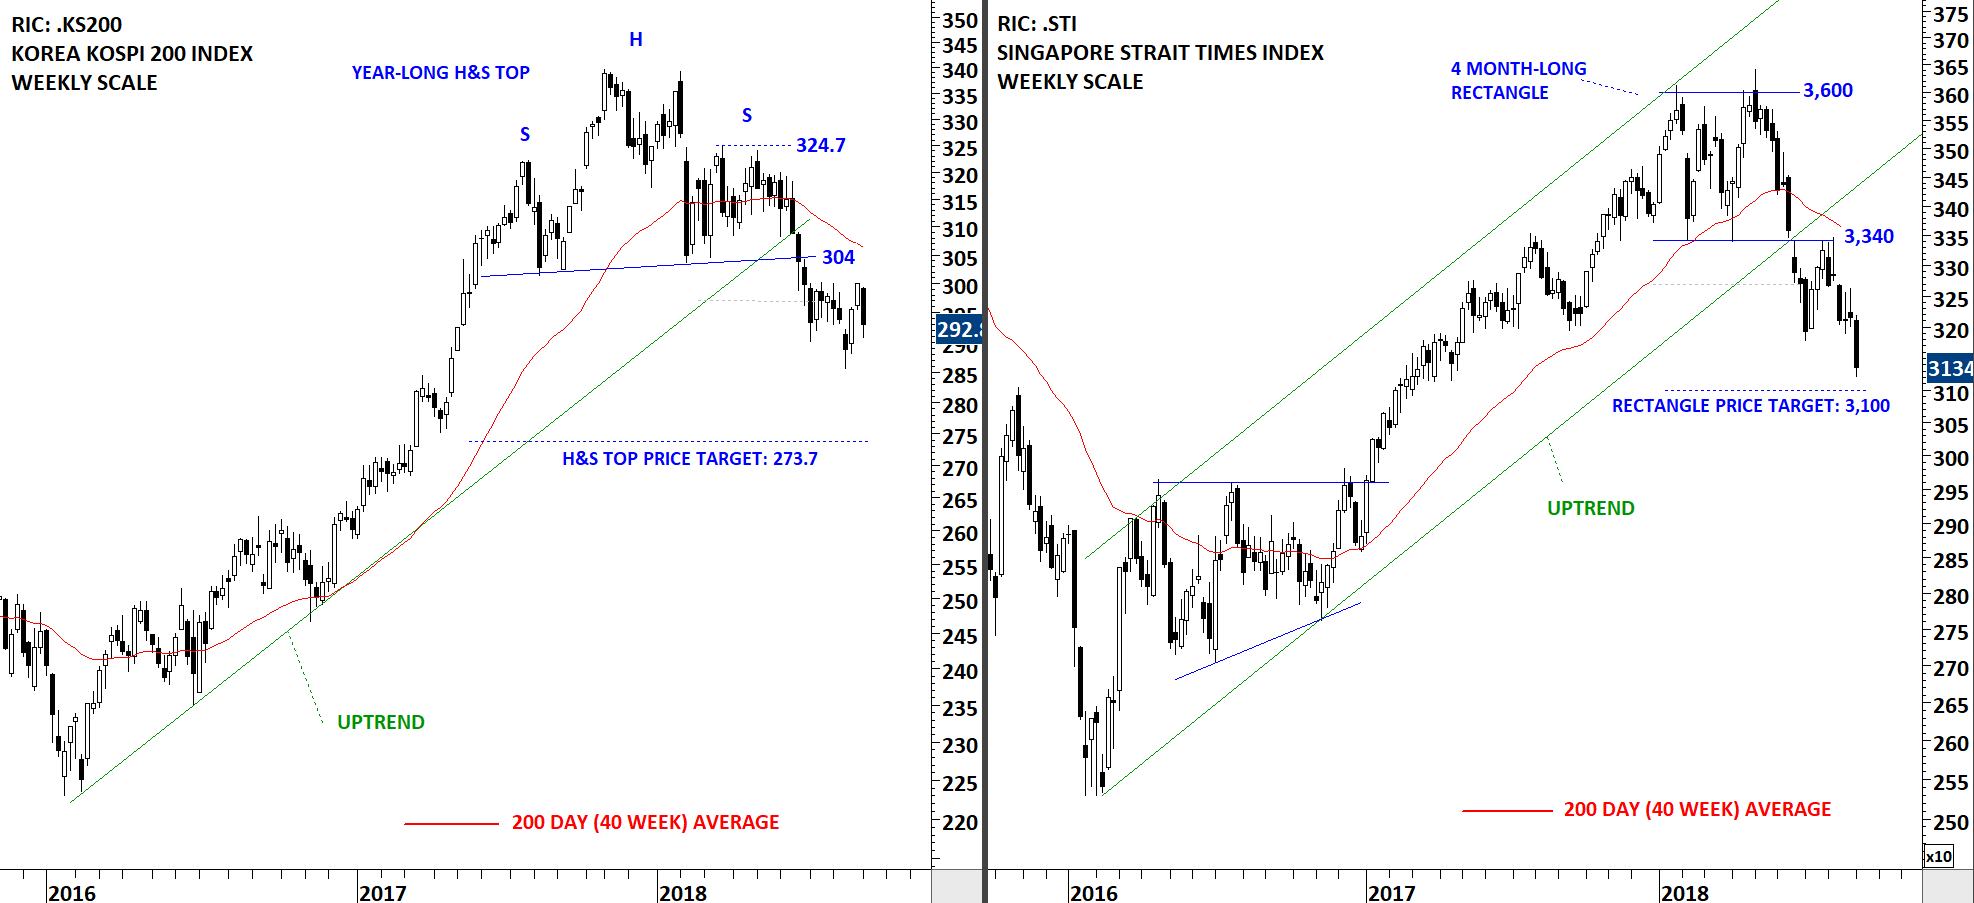
Over the past few months two major breakdowns were featured on Asia equity markets. Both Korea Kospi 200 Index and Singapore Strait Times Index completed top formations and breached their long-term averages. Breakdowns also breached their multi-year upward trend line supports. Singapore Strait Times Index is now very close to its chart pattern price target at 3,100 levels. However, the index is in a steady downtrend and there is no evidence of a short-term bottom formation.

Korea Kospi 200 Index completed a year-long H&S top chart pattern after breaching the neckline at 304 levels. The index remains below its long-term average and in a steady downtrend. The year-long H&S top has an unmet price target at 273.7 levels.

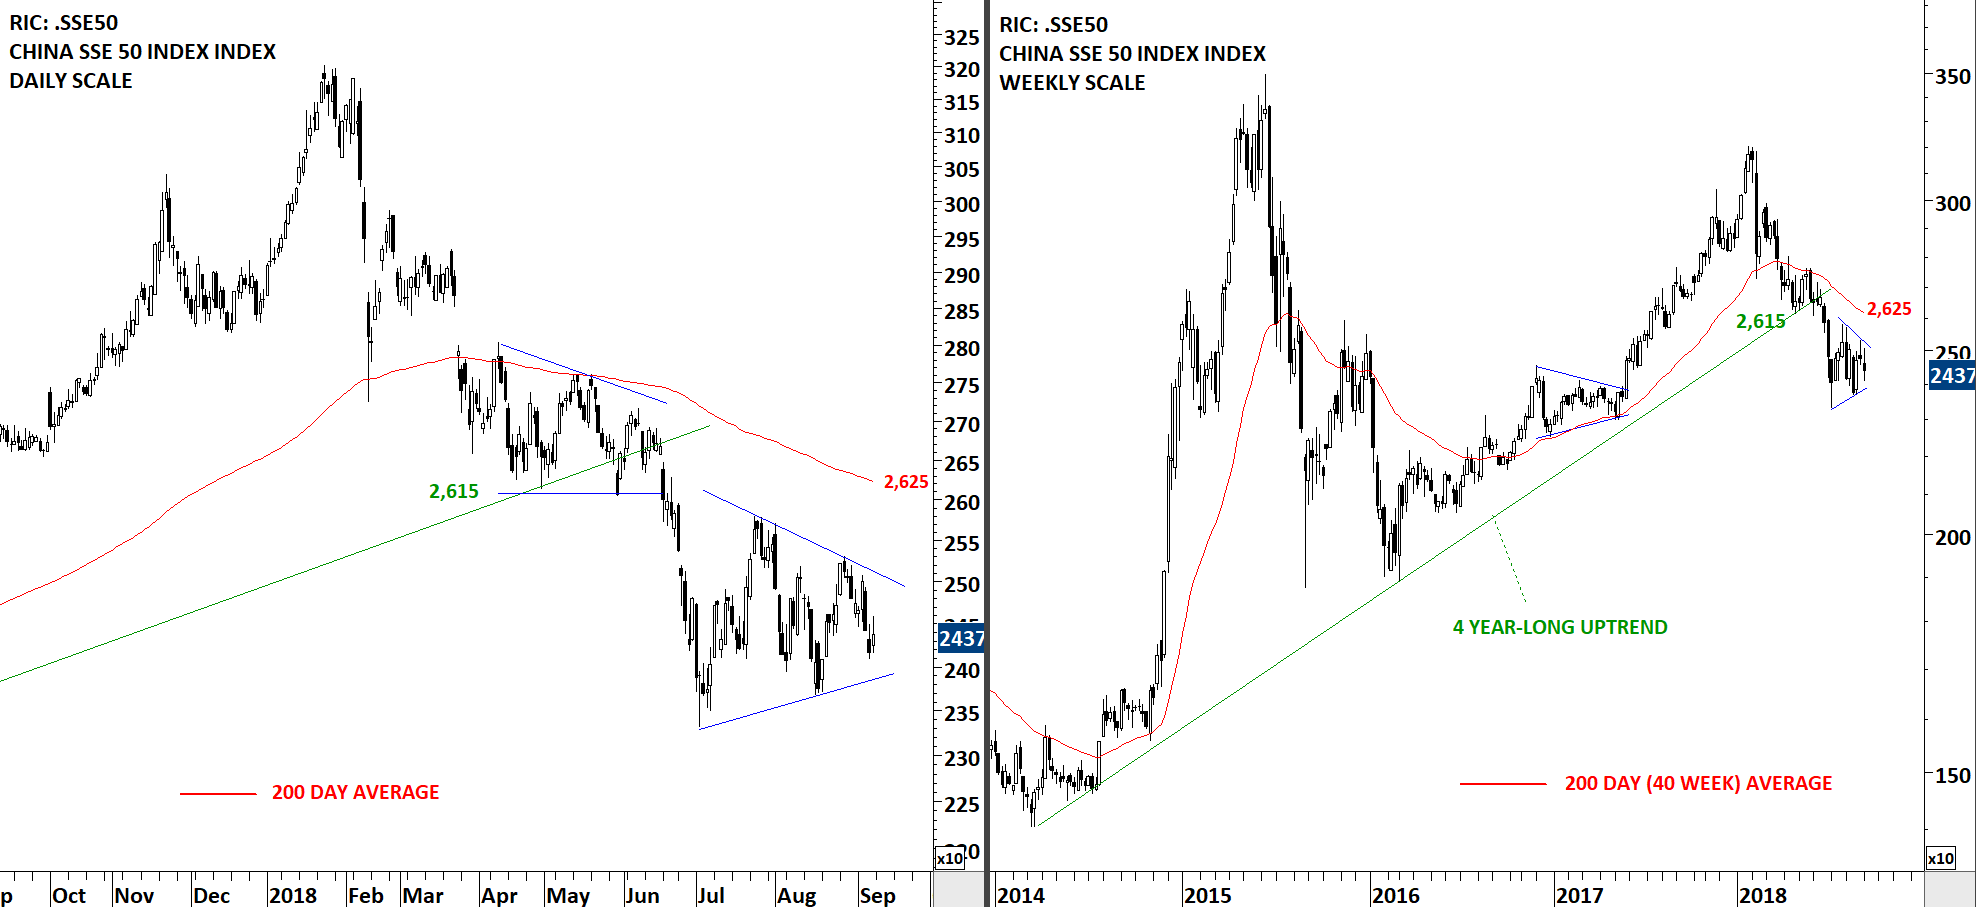
China SSE 50 Index first breached its long-term average and then broke down its 4 year-long upward trend line at 2,615 levels. Last two month’s consolidation is possibly forming a symmetrical triangle that can act as a bearish continuation chart pattern. Strong resistance area remains between 2,615 and 2,625 levels. Chinese equities are in a steady downtrend.

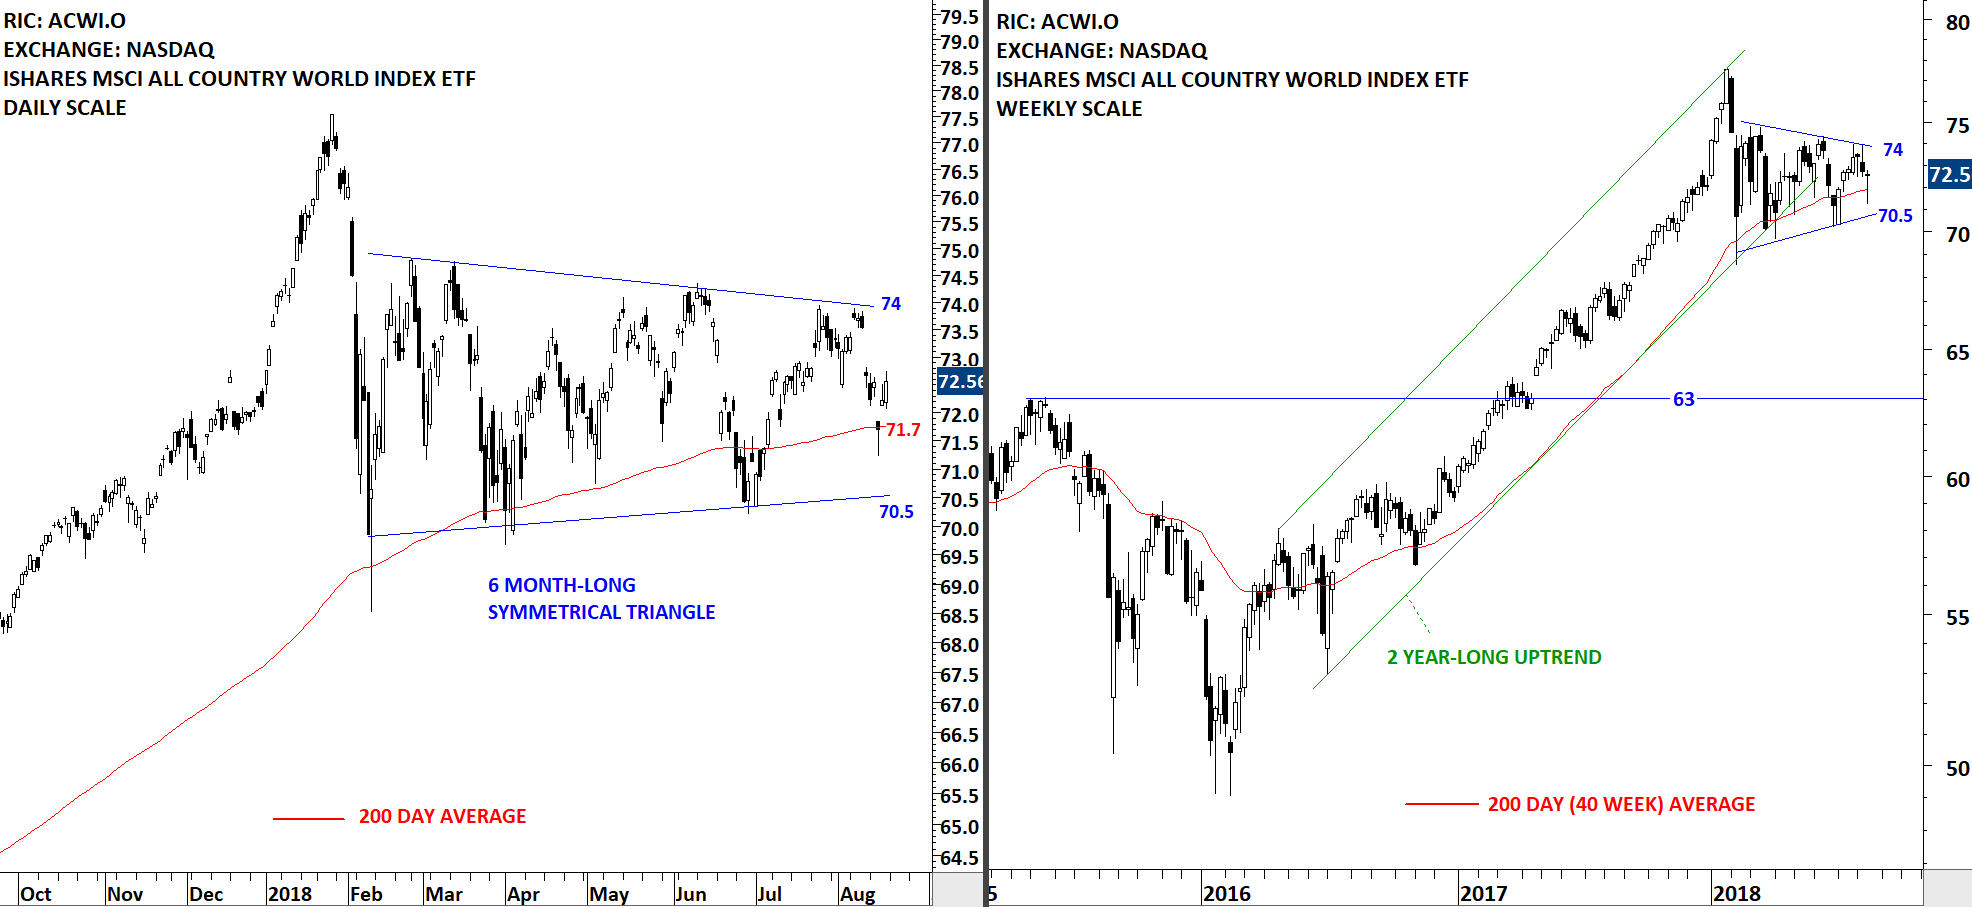
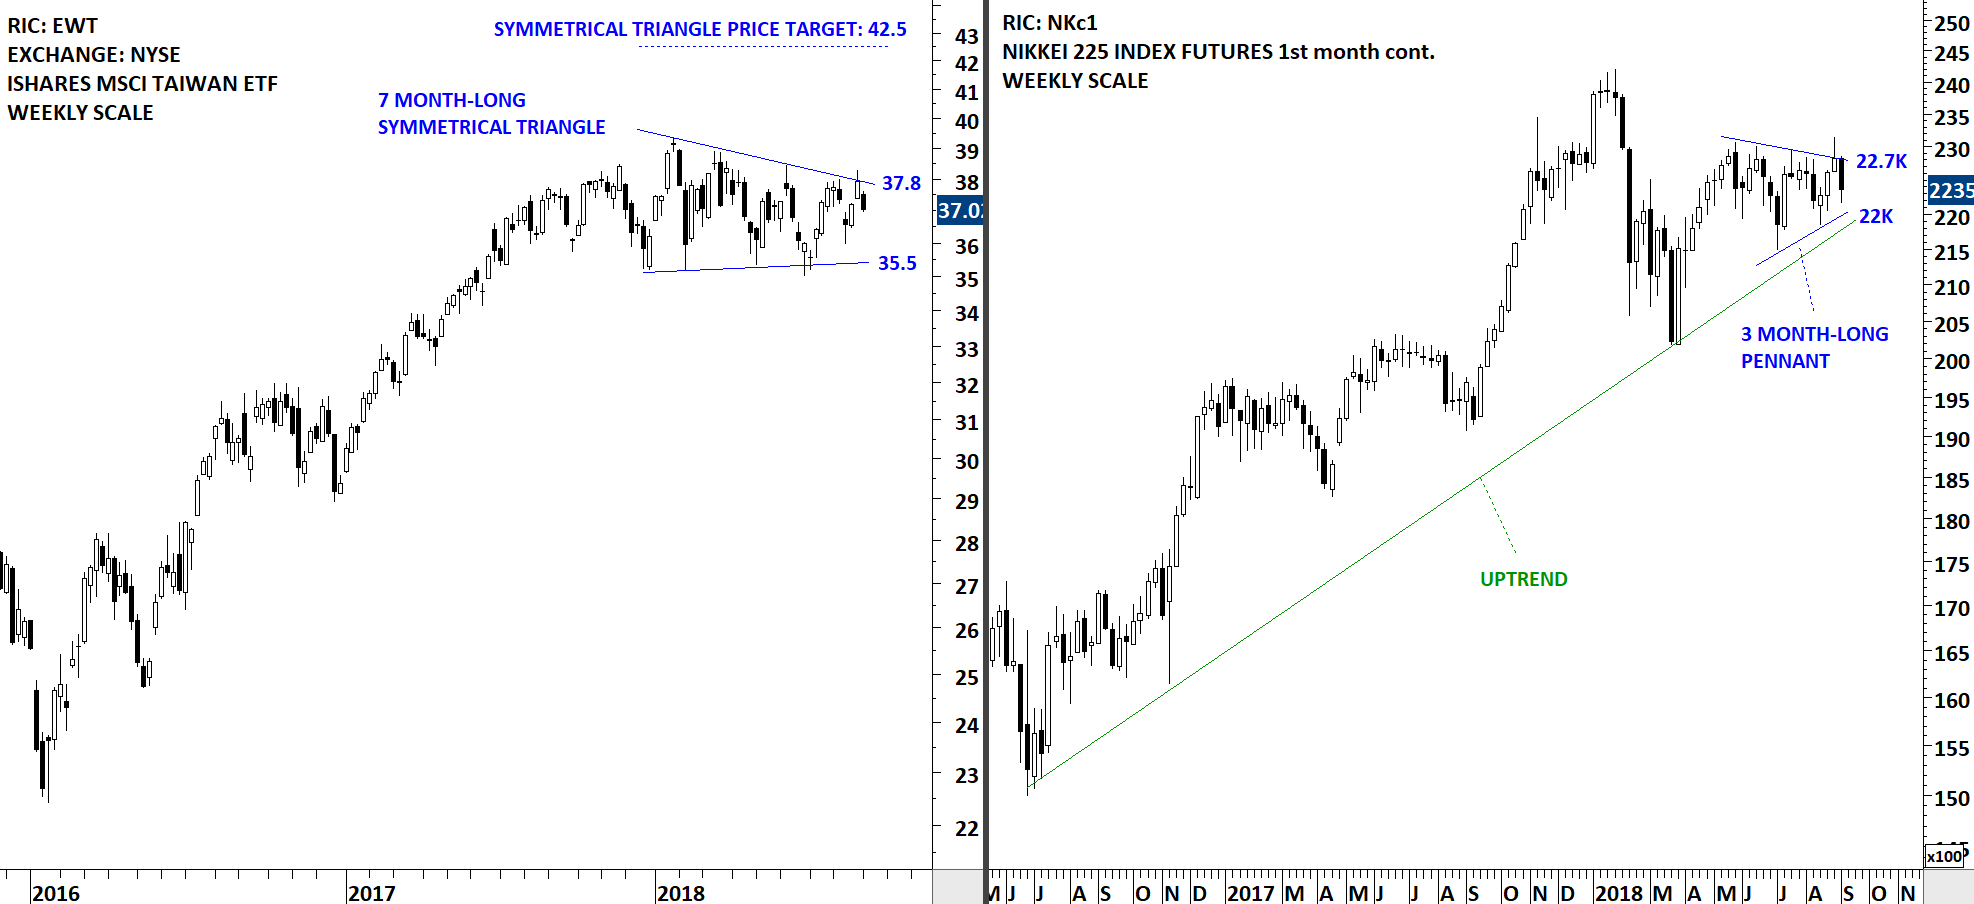
Two Asian equity benchmarks are holding well despite the weakness in regional equities. Japan’s Nikkei 225 Index and Taiwan ETF (EWT) listed on the New York Stock Exchange, are going through tight consolidations. Charts below feature the 1st month continuation futures price chart for Nikkei 225 Index and the iShares MSCI Taiwan ETF (EWT). Breakout higher from these tight consolidations can be positive for both Japan and Taiwan equities.

Tech Charts Membership

By becoming a Premium Member, you’ll be able to improve your knowledge of the principles of classical charting.

With this knowledge, you can merge them with your investing system. In fact, some investors use my analyses to modify their existing style to invest more efficiently and successfully.

Get Access Now

As a Premium Member of Aksel Kibar’s Tech Charts,

You will receive:

  • Global Equities Report. Delivered weekly.
  • Classical charting principles. Learn patterns and setups.
  • Actionable information. Worldwide indices and stocks of interest.
  • Risk management advice. The important trading points of each chart.
  • Information on breakout opportunities. Identify the ones you want to take action on.
  • Video tutorials. How patterns form and why they succeed or fail.
  • Watch list alerts. As they become available so you can act quickly.
  • Breakout alerts. Usually once a week.
  • Access to everything (now and as it becomes available)
    o Reports
    o Videos and video series
  • Multi-part webinar course. You learn the 8 most common charting principles.
  • Webinars. Actionable and timely advice on breaking out chart patterns.

For your convenience your membership auto renews each year.

Get Access Now

GLOBAL EQUITY MARKETS – August 18, 2018

REVIEW


Global Equity Markets continue to remain in a range. The iShares MSCI All Country World Index ETF (ACWI.O) is possibly forming a 6 month-long symmetrical triangle with the upper boundary acting as resistance at 74 and the lower boundary as support at 70.5 levels. Breakout from this lengthy consolidation range will result in a directional move.

Read More

GLOBAL EQUITY MARKETS – July 28, 2018

REVIEW


The iShares MSCI All Country World Index ETF (ACWI.O) found resistance at the upper boundary of its 5 month-long consolidation. Last 5 month's price action can be identified as a possible symmetrical triangle with the upper boundary acting as resistance at 74 levels and the lower boundary as support at 70.4 levels. I track ACWI ETF to measure Global equity markets performance. Price continues to remain range-bound.

Read More

GLOBAL EQUITY MARKETS – July 14, 2018

REVIEW


Until a chart pattern is mature and ready to resolve in one direction we have to make minor adjustments to the chart pattern boundaries. (Learn more: Morphology) Dealing with chart patterns and breakouts in real-time is difficult compared to labeling chart patterns on price charts in hindsight. Corrective periods are more tricky compared to trend periods because market corrections are periods of indecision between buyers and sellers whereas trend periods show consensus. The iShares MSCI All Country World Index ETF (ACWI.O) is going through a corrective period. The 5 month-long choppy sideways movement is possibly forming a symmetrical triangle between the boundaries of 70.4 and 74. This week's price action pushed the ETF above its long-term average. For the long-term uptrend to resume, price should remain above the 200 day-average.

Read More

GLOBAL EQUITY MARKETS – June 30, 2018

REVIEW


If anybody tells you, "I know what the markets will do in the following weeks" he or she might be guessing. I will try to be as objective as possible with some of the major equity benchmarks and convey the message of my chart analysis. After the Jan-Feb 2018 sell-off on the ACWI ETF, price remained range-bound. The consolidation formed a possible 4 month-long symmetrical triangle (can act a bearish continuation). Both the lower boundary of the consolidation and the 200-day (40 week) moving average formed support around the same level. After each test over the past 4 months, the ETF rebounded from the 200-day moving average.

Read More

GLOBAL EQUITY MARKETS – June 23, 2018

REVIEW


Once again the iShares MSCI All Country World Index ETF (ACWI.O) reverted back to its 200-day (40-week) moving average. The long-term average at 71.40 levels is also the lower boundary of the 4 month-long symmetrical triangle chart pattern. Breakout from the last 4 month's consolidation will be important for Global equity markets performance. A breakdown below the lower boundary of the 4 month-long symmetrical triangle will push the ACWI ETF below its long-term average, possibly reversing the last 2 year's uptrend. Following charts review the Emerging and Frontier Market ETFs that are already trading below their long-term averages. The boundaries of consolidation for the iShares MSCI All Country World Index ETF remains between 74.3 and 71.4 levels.

Read More

GLOBAL EQUITY MARKETS – June 16, 2018

REVIEW


The iShares MSCI All Country World Index ETF (ACWI.O) continues to challenge the upper boundary of its 4 month-long sideways consolidation. The index remains range-bound. Last 2 year's trend is upwards. Price is trading above the long-term moving average. Both the lower boundary of the 2 year-long trend channel and the 200-day (40 week) moving average are forming support at 71.35 levels. The upper boundary of the the 4 month-long consolidation is acting as resistance at 73.90 levels.

Read More

GLOBAL EQUITY MARKETS – June 9, 2018

REVIEW


Benchmark for Global equity markets performance, the iShares MSCI All Country World Index ETF (ACWI.O) is challenging the upper boundary of its 4 month-long symmetrical triangle at 73.90 levels. Tight consolidation is taking place above the long-term average which is acting as support at 71.2 levels. Both the long-term average and the lower boundary of the 2 year-long uptrend are forming support around the same levels. ACWI ETF is in a steady uptrend. Decisive breakout above 73.90 can resume the multi-year long uptrend. Failure to move higher can result in another test of the long-term average at 71.2 levels.

Read More

GLOBAL EQUITY MARKETS – June 2, 2018

REVIEW


Benchmark for Global equity markets performance, the iShares MSCI All Country World Index ETF (ACWI.O) continues to consolidate in a tight range. Last 4 month's consolidation can be identified as a possible symmetrical triangle. Symmetrical triangle is a neutral chart pattern. Price can breakout in any direction. Strong resistance stands at 73.90 levels. Support, formed by both the lower boundary of the symmetrical triangle and the 200-day (40-week) moving average stands at 71 levels. Last 4 month's consolidation is taking place inside the 2 year-long uptrend channel. Long-term trend is upwards. Read More