CENTRAL EUROPE, RUSSIA & TURKEY
CENTRAL EUROPE, RUSSIA & TURKEY (CEE)
CEE is a closed-end fund listed in the NYSE. The fund seeks long-term capital appreciation through investment primarily in equity or equity linked securities of issuers domiciled in Central Europe, Russia and Turkey. A new chart pattern breakout signal is triggered with a strong weekly close on CEE. Price chart of CEE completed a year-long H&S bottom by clearing the strong horizontal resistance at 19.55 levels. From a charting perspective there are several positive interpretations of the latest price action. While the larger scale chart pattern can be identified as a H&S bottom, the right shoulder of the base formation took the form of a bullish ascending triangle. Both chart patterns were completed this week with a decisive breakout above the horizontal boundaries. Ascending triangle price target stands at 21.75 levels. Year-long H&S bottom price target stands at 24.35 levels. A long trade is entered at the close of the week with stop-loss at 19.1. The CEE fund is managed by Deutsche Bank and latest publicly available holdings and the composition of the fund is shown on their website. For more information you can visit Deutsche Asset Management page.
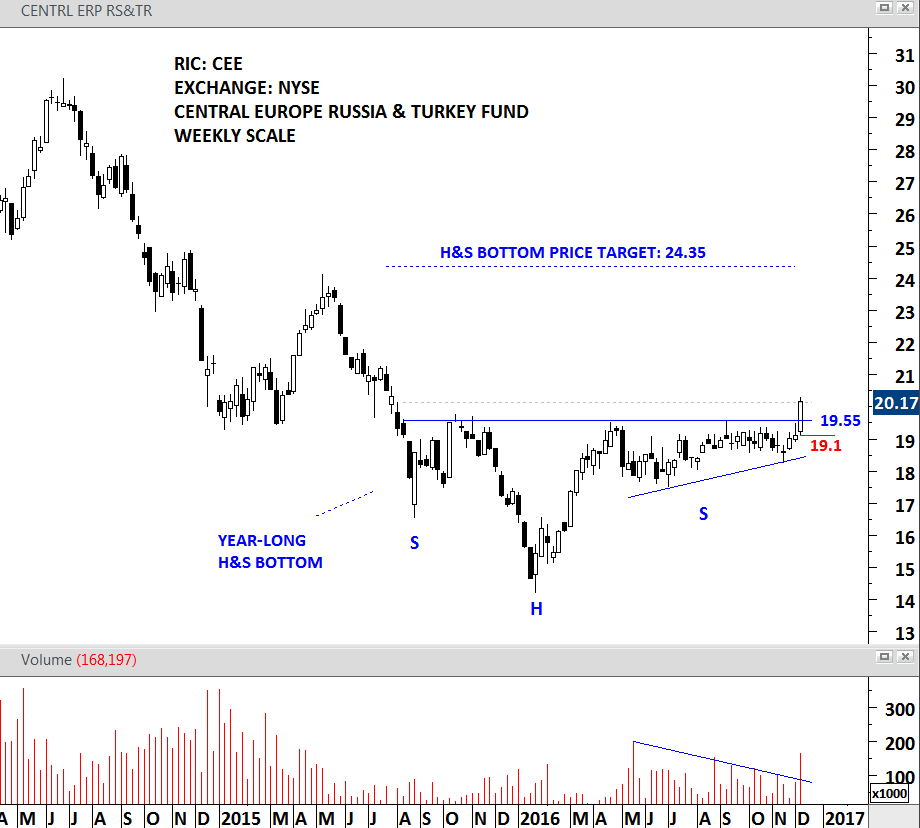
CEE – WEEKLY SCALE
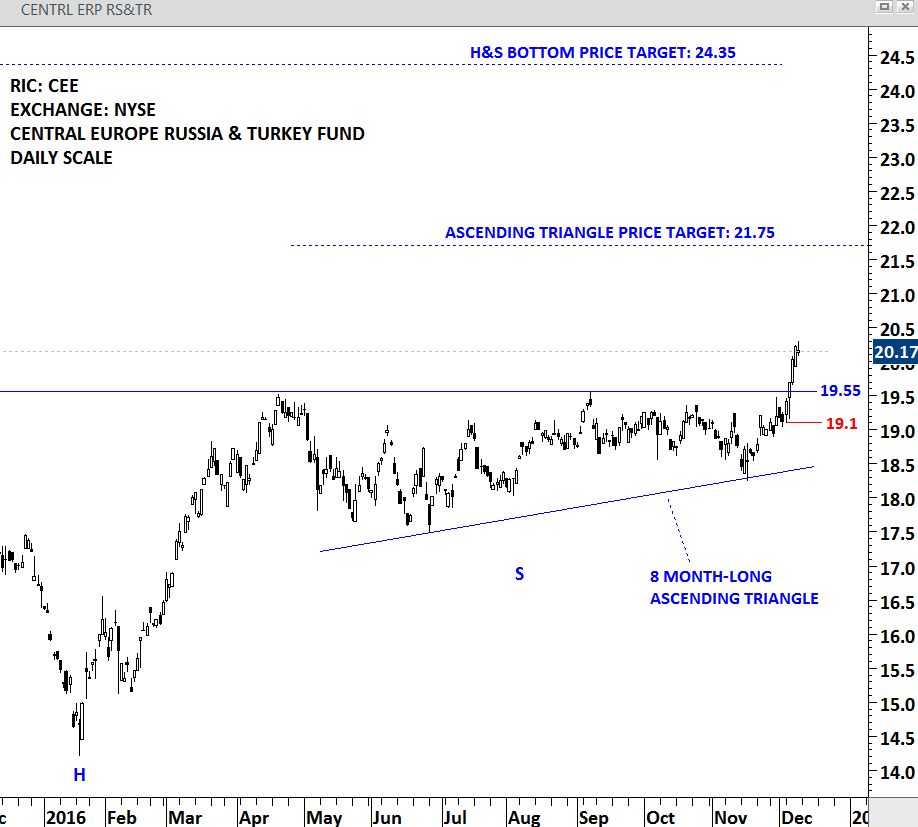
CEE – DAILY SCALE