GLOBAL EQUITY MARKETS – March 30, 2019
REVIEW
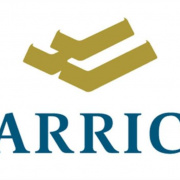
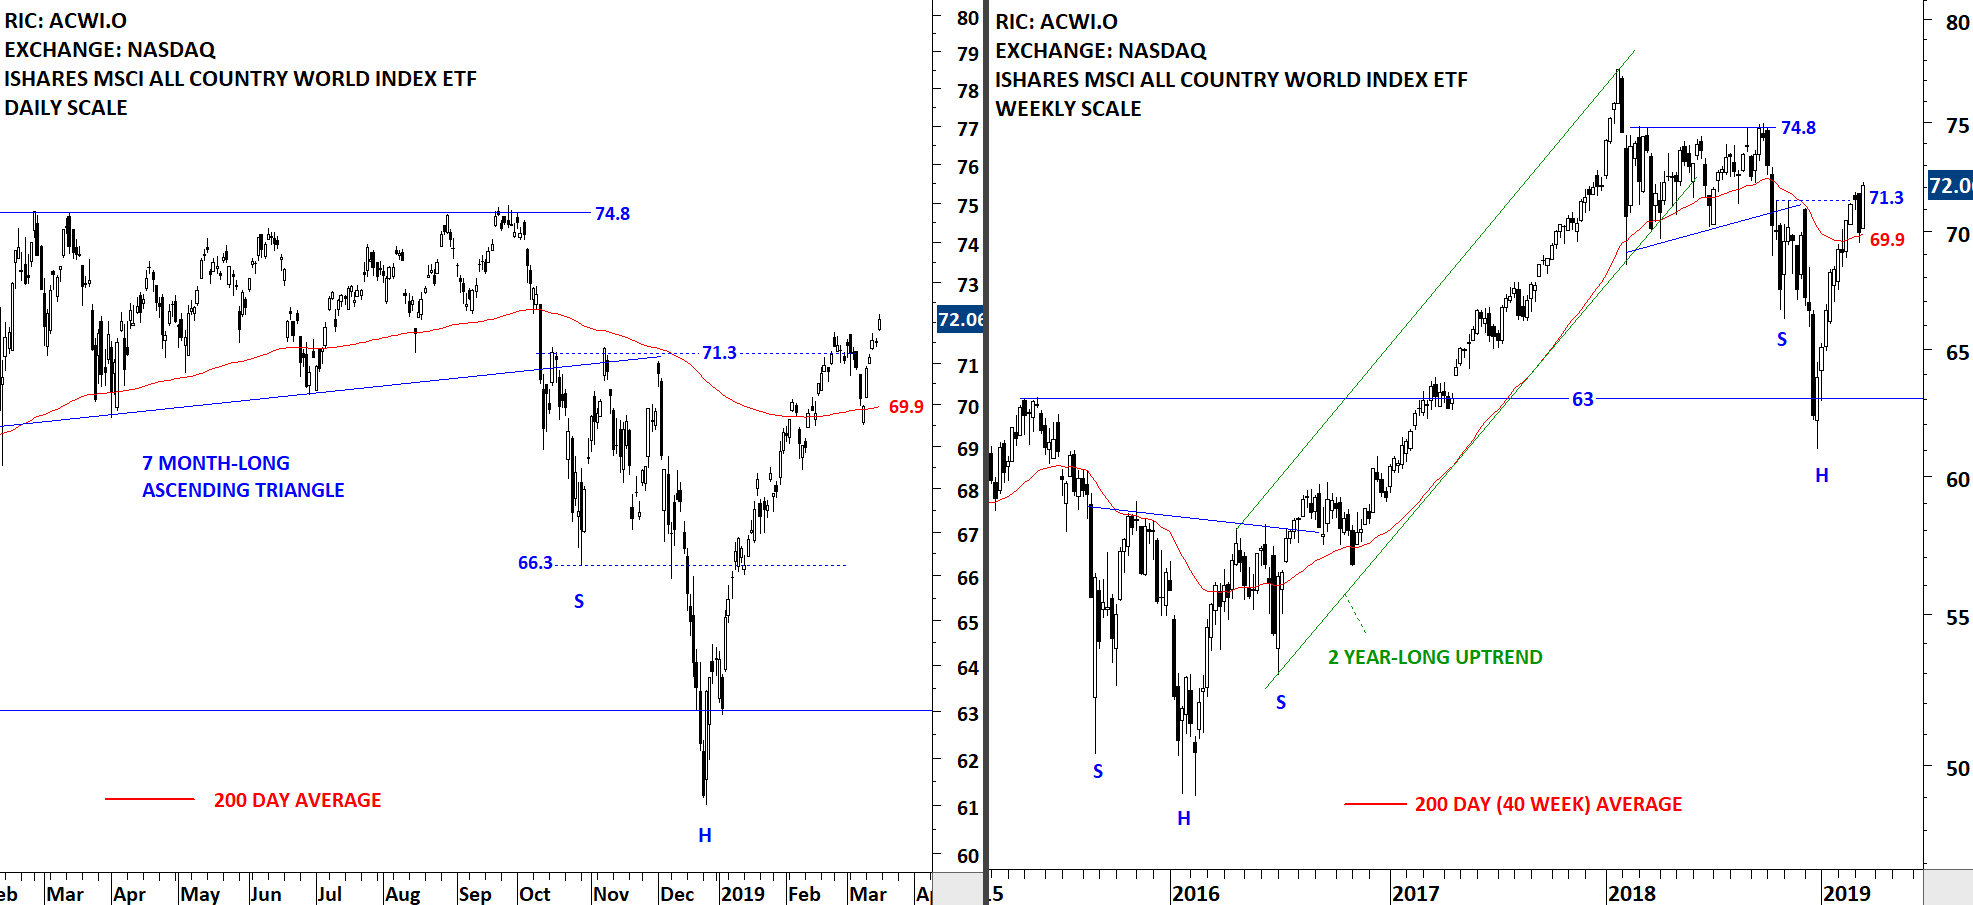
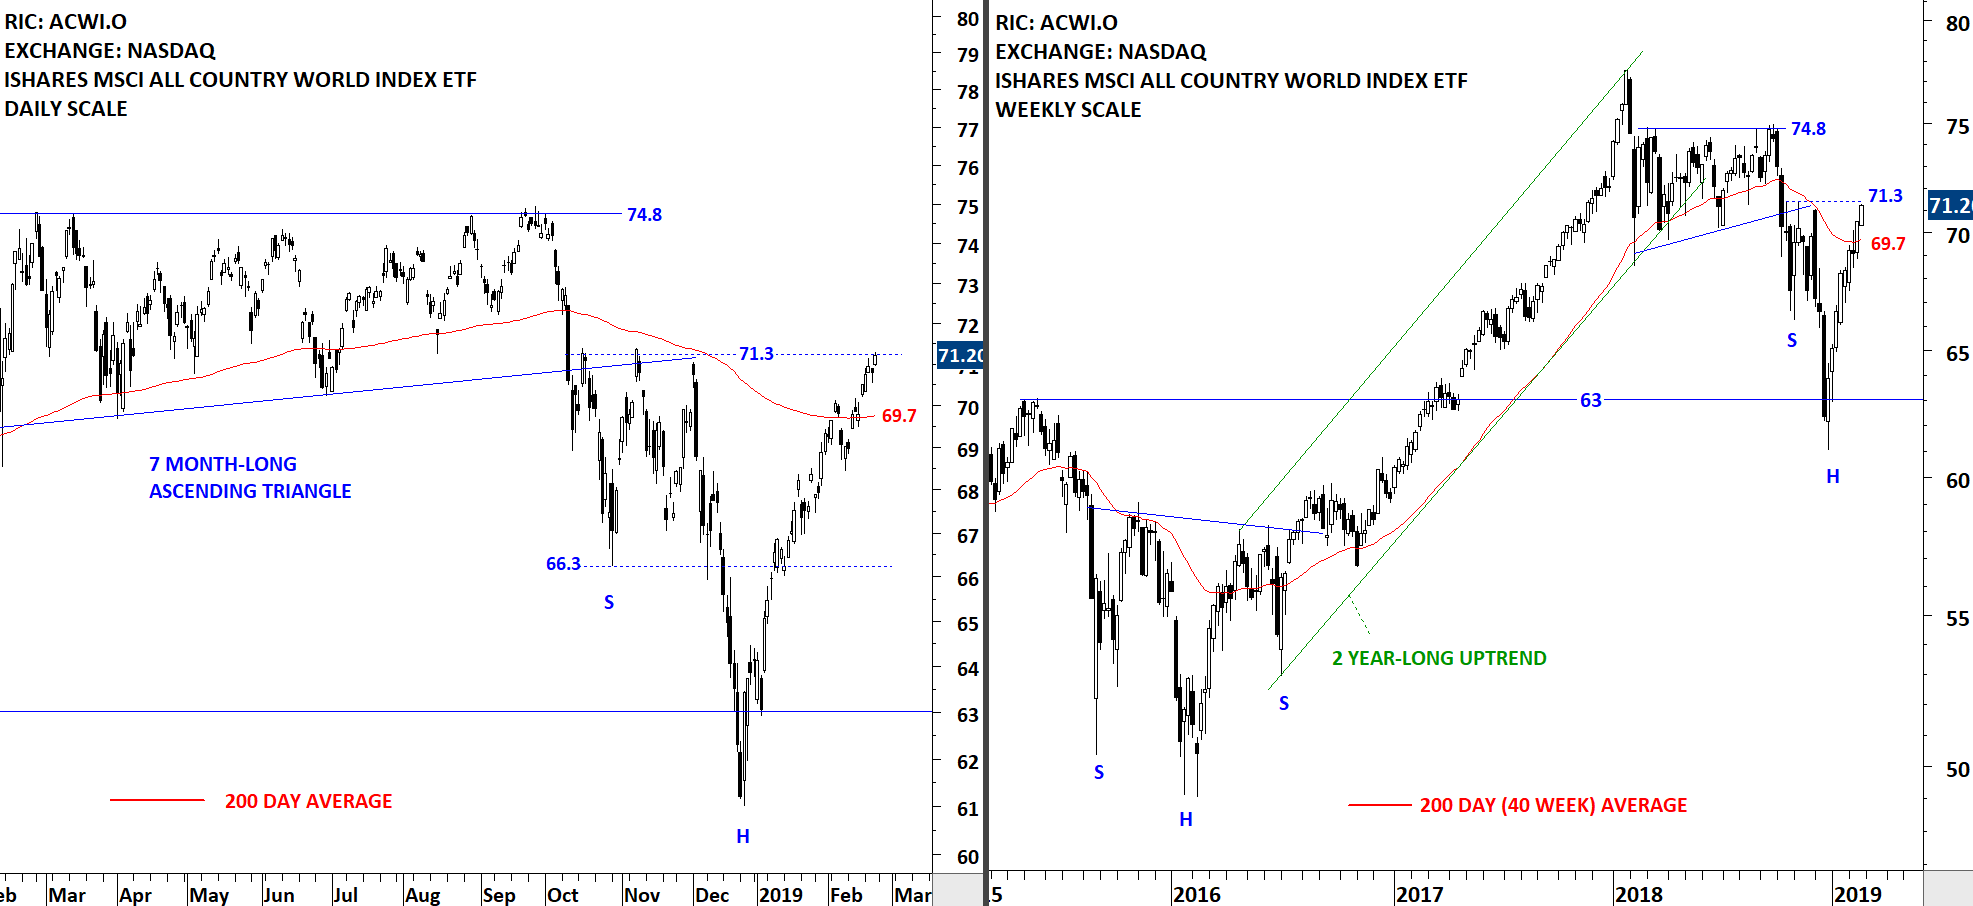
The benchmark for the Global equity markets performance, the iShares MSCI All Country World Index ETF (ACWI.O) is trying to find direction above its long-term average. We can see choppy price action around the 200-day average. More important is how the index will consolidate around the average. If it forms an orderly, recognizable short-term consolidation (in the form of a flag, pennant, rectangle, symmetrical triangle) I will conclude that the index is preparing for a new leg up. 200-day moving average is forming support at 70.15 levels.
 Read More