Posts

GLOBAL EQUITY MARKETS – August 26, 2017

REVIEW


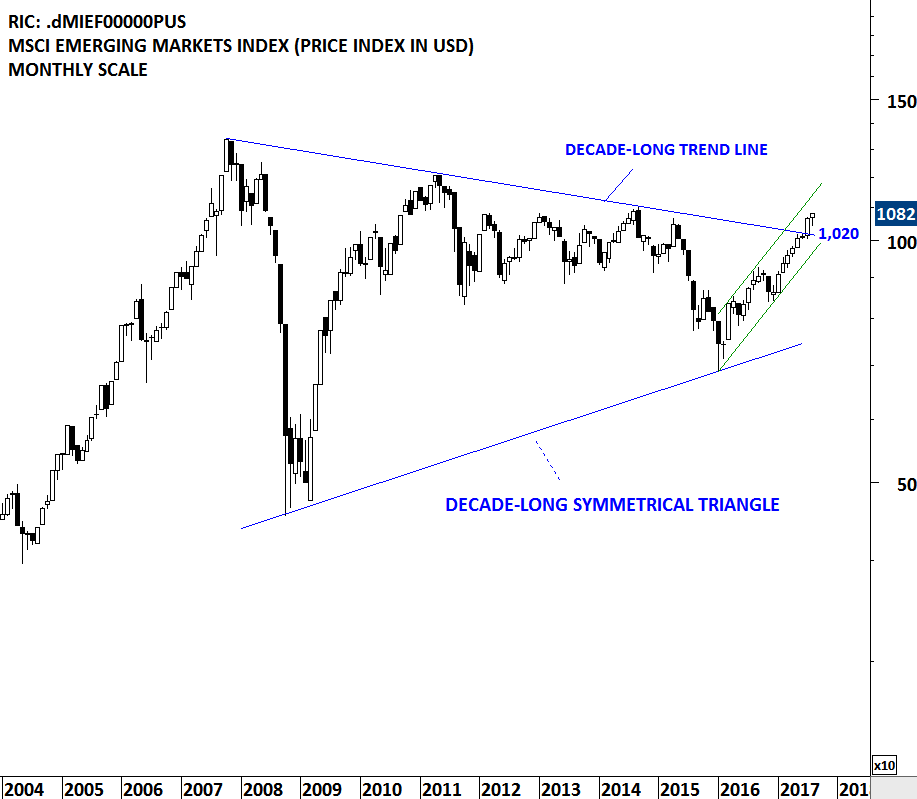
Strong weekly performance of the Chinese SSE Composite Index is worth mentioning in this weeks update. Strength in the Chinese equities helped MSCI Emerging Markets Index to remain resilient during the last few week's of global equity market weakness. MSCI Emerging Markets index that cleared decade-long trend resistance in July, held on to its earlier gains during the month of  August.

Read More

WHEAT, SOYBEANS & METALS

SILVER VS GOLD

Silver is likely to outperform Gold prices in the coming months. Long-term chart of SILVER/GOLD suggests the ratio is at a major turning point. Multi-decade support reversed the ratio three times over the past two decades and this could be the fourth time. Reversal from the strong support in the past resulted in an approximately 1.5x-1.6x outperformance with the exception of 2.3x during 2009-2011 period.

SOYBEANS

Grains and beans complex is at a major turning point. Soybean price is trying to reverse from a multi-year trend support. Two long-term trend lines acted as support around 850 levels. Momentum indicator RSI formed positive divergence. This could prove to be a major low for Soybeans.

WHEAT

Similar price action can be seen on Wheat price. Last three year’s downtrend found support around 455 levels. Strong support can prove to be a turning point for the agricultural commodity.

GOLD

Unless gold prices recover above 1,130 levels in the following weeks, probability of a sell-off towards 1,000 levels will increase. In mid-July gold price broke below the support range between 1,130-1,150. Since then the rebound has been weak and price failed to recover even above 1,110 levels. Lower boundaries are considered to be negative extremes and upper boundaries; positive extremes in terms of sentiment. If price is breaking below the lower boundary, that signals extreme weakness for the analyzed instrument. Downtrend remains intact for gold. Strong resistance stands at 1,130 levels.

GOLD

COPPER vs. GOLD

Over the past two decades Copper underperformed Gold during turbulent times in the financial markets. Ratio between Copper and Gold declined sharply during 2000-2003 and 2007-2009 periods. Latest breakdown from the consolidation range can result in further underperformance for Copper. This is a powerful long-term chart with a strong message.

COPPER vs GOLD

GOLD

Year-long consolidation in Gold prices  should end soon. A strong trend period should follow once the symmetrical triangle is resolved in one direction. Volatility has decreased on weekly scale and this increased the likelihood of high volatility period in the following weeks/months. Boundaries of the consolidation stand at 1,270 and 1,360 levels. Breakout above 1,360-1,400 area will push gold price higher towards 1,525 levels. Breakdown below 1,250-1,270 support area will result in another downtrend towards 1,150 levels.

GOLD

GOLD

Above are some of the updates I shared with TechCharts followers on GOLD. Since the beginning of 2013, it is the first time GOLD has breached its long-term moving average. Strong momentum should push prices towards 1,440 levels in the following weeks. 200-day moving average at 1,330 levels will become the “new” support.

GOLD

Gold, Silver, USD and Unemployment

Here are some of the charts that I shared on twitter today. U.S. weekly jobless claims chart is extremely important as I shared several updates on this topic. Year 2013 can prove to be a major low for weekly jobless claims figure.

Both Gold and Silver are now close to major support levels.

U.S. dollar index rebounded from a 2 year-long trend support.

and some other updates on EUR/TRY, USD/TRY and NIKKEI…