Posts

GLOBAL EQUITY MARKETS – May 19, 2018

REVIEW


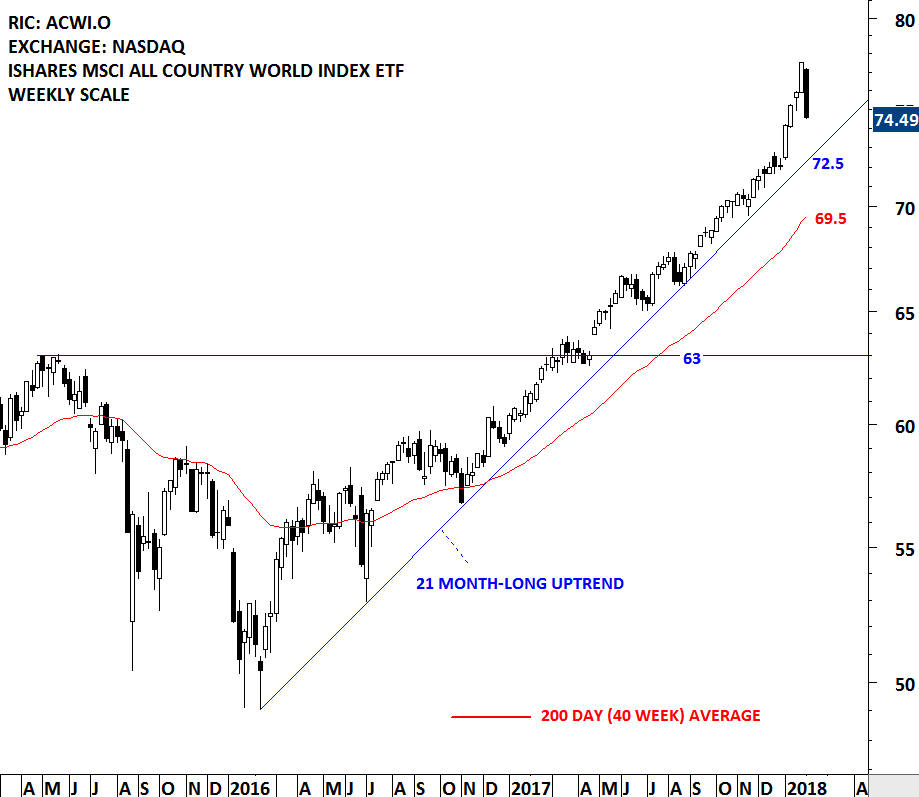
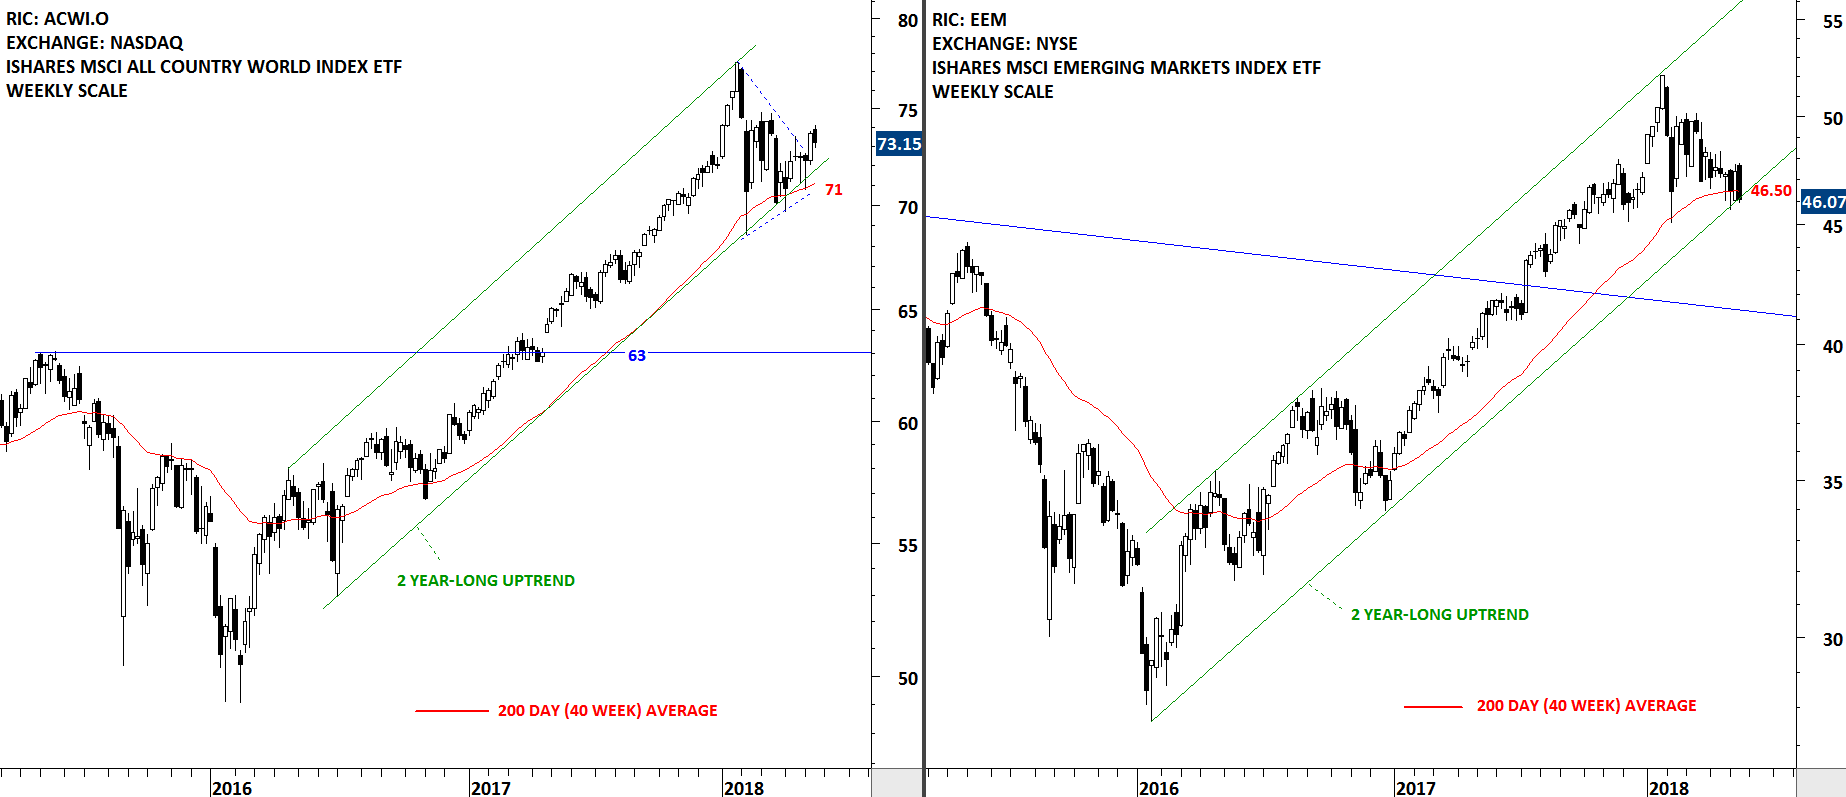
We are seeing a decoupling in terms of performance in the Global Equity Markets. Developed markets continue to remain strong whereas Emerging markets start to weaken. The charts below show both the iShares MSCI All Country World Index ETF and the iShares MSCI Emerging Markets Index ETF in a steady uptrend. However, over the past few weeks, the iShares MSCI All Country World Index ETF managed to rebound from its long-term average but the iShares MSCI Emerging Markets Index ETF struggled around the strong support area. Failure to recover from strong support area can result in a breakdown and larger scale correction for the Emerging Markets. The iShares MSCI Emerging Markets Index ETF is testing the 200-day (40 week) moving average.

Read More

U.S. REGIONAL BANKS

Every week Tech Charts Global Equity Markets report features some of the well-defined, mature classical chart patterns under a lengthy watchlist and the chart pattern breakout signals that took place during that week. Global Equity Markets report covers single stocks from developed and emerging markets, ETF’s and global equity indices. The report starts with a review section that highlights the important chart developments on global equity benchmarks. This blog post features two equities from U.S. banking sector that formed rectangle chart patterns that can act as bullish continuation. Both charts were discussed in the latest weekly Global Equity Markets report.

Read More

GLOBAL EQUITY MARKETS – April 21, 2018

I really enjoyed our conversation with Caroline Stephen, the host of Talking Trading. We discussed Technical Analysis, Classical Charting and my charting and trading experience in the Middle East & North Africa markets.

You can listen the interview by clicking this link (http://talkingtrading.com.au/frontier-markets/). I hope you will find it interesting and valuable.

REVIEW


During trending markets, there is "consensus". During corrective markets there is "indecision". Current market environment is corrective in nature (choppy price action) and as a result there is indecision between the buyers and the sellers. The iShares MSCI All Country World Index ETF formed a "doji" candlestick pattern. A similar candlestick pattern can be seen on the Nasdaq 100 Index.

Read More

INTERIM UPDATE – March 7, 2018

Reminder on Live Webinar

Due to very positive feedback we got for the last webinar on rectangle chart patterns, we are continuing the webinar series with another reliable horizontal chart pattern; the ascending triangle. Live Webinar and Q&A with Aksel - Thursday, March 8, 11am mountain. You can register here (Register for the Live Webinar)

Over the past few weeks Global Equity Markets report featured some great chart setups in U.S. Regional Banks & Financials. Some of those chart patterns are resolved on the upside and some are about to complete. As we see more strength in the sector I thought it is a good time to review some of those recent chart pattern developments. Read More

GLOBAL EQUITY MARKETS – February 3, 2018

REVIEW


2018 started with strong weekly gains. The steady uptrend on the iShares MSCI All Country World Index ETF took a steep shape in January due to back to back long weekly candlesticks. This week's sharp reversal gave back last two week's gains. From a classical charting perspective we don't have enough evidence to call the latest reversal a "market top". Multi month-long uptrend is still intact. We are currently experiencing a reversion back to the averages or to the long-term trend line supports. Global equities can retrace further and major equity benchmarks can still remain in their long-term uptrends. We will need more evidence in the following weeks.

Read More