Posts

GLOBAL EQUITY MARKETS – November 17, 2018

REVIEW


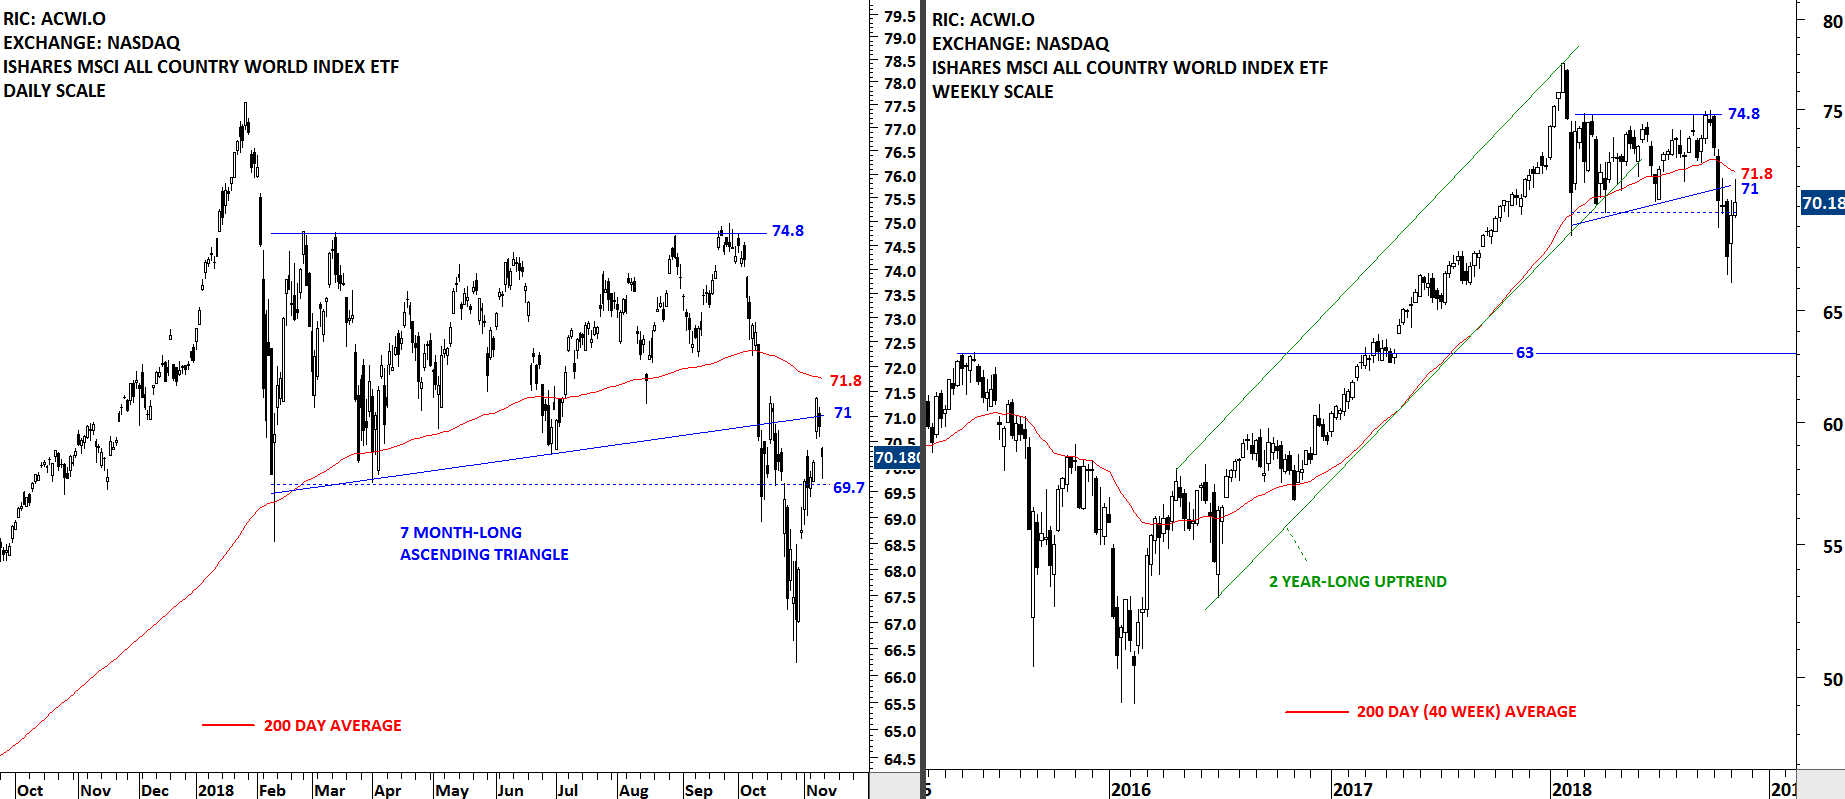
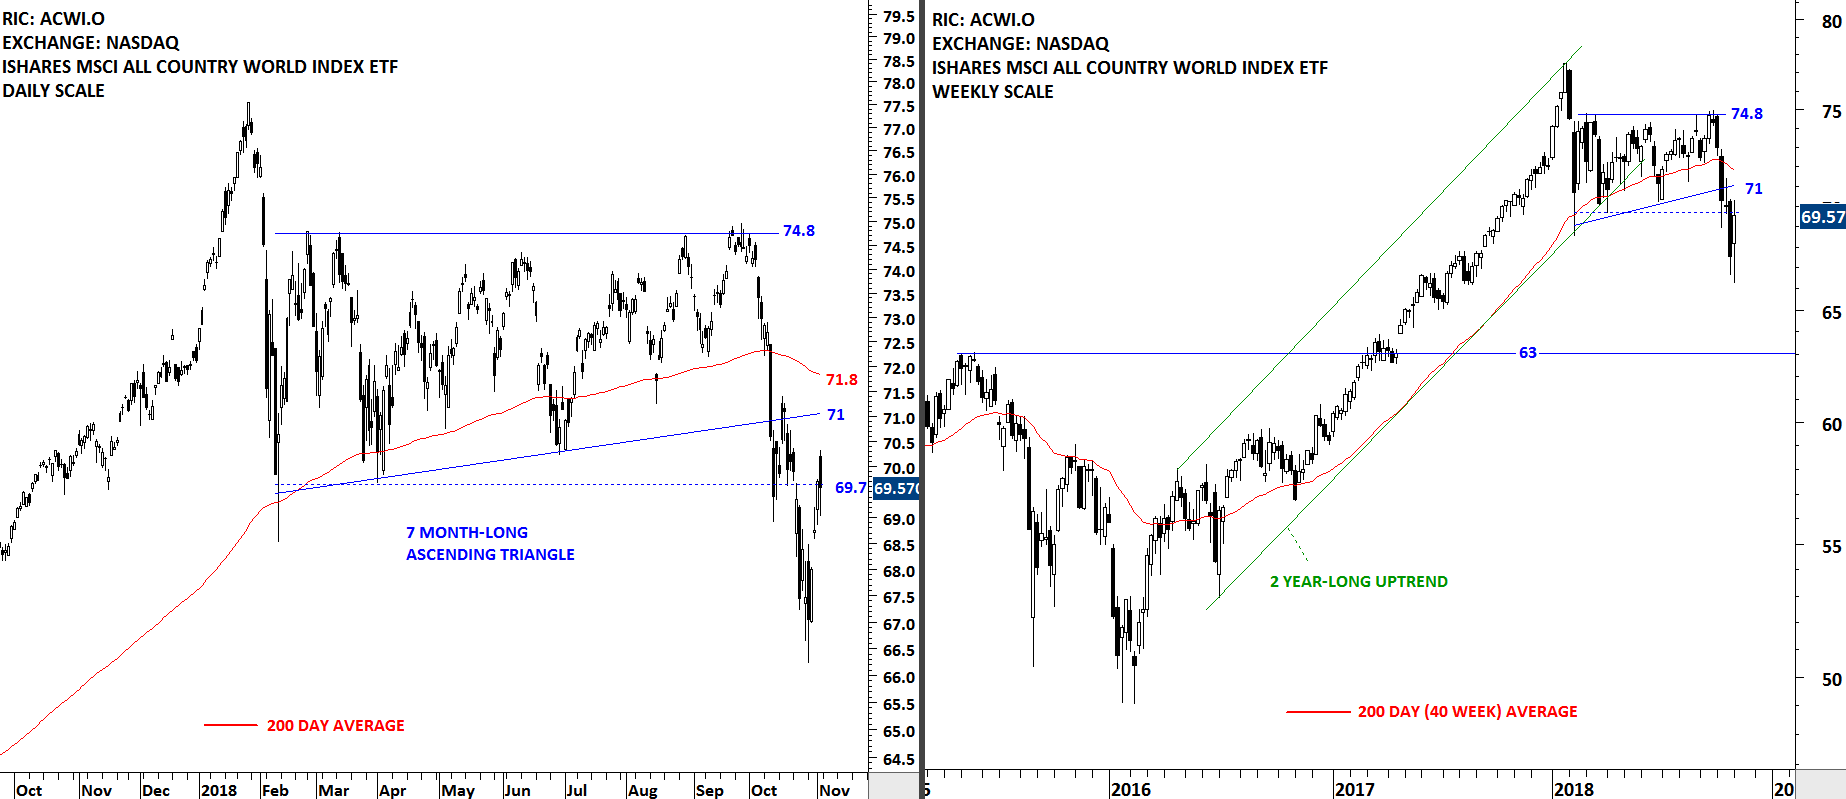
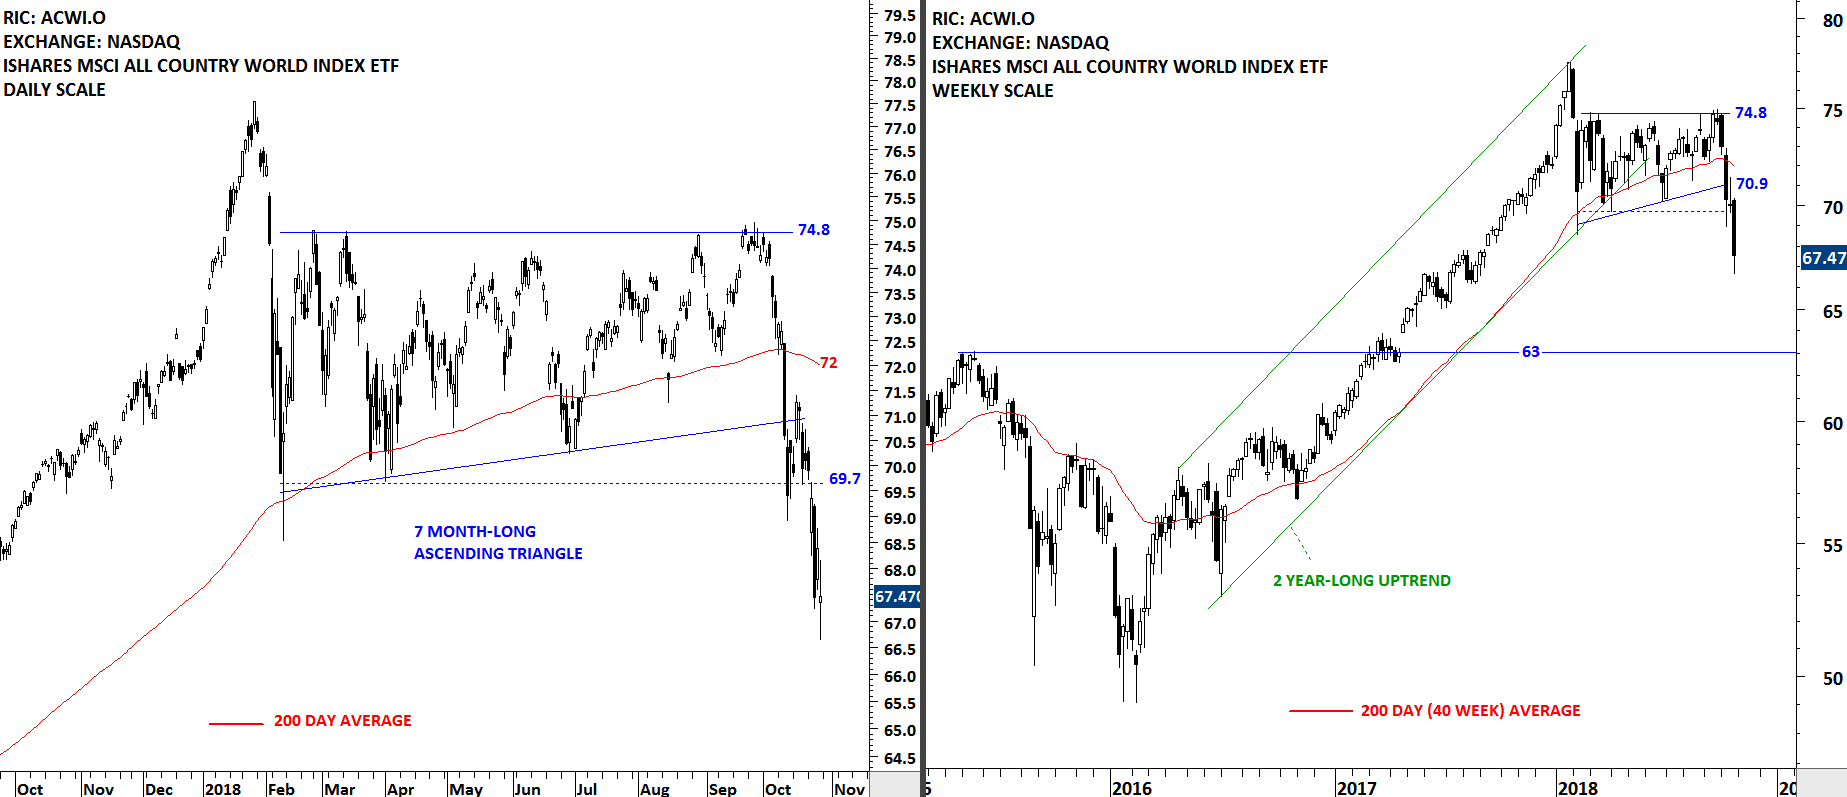
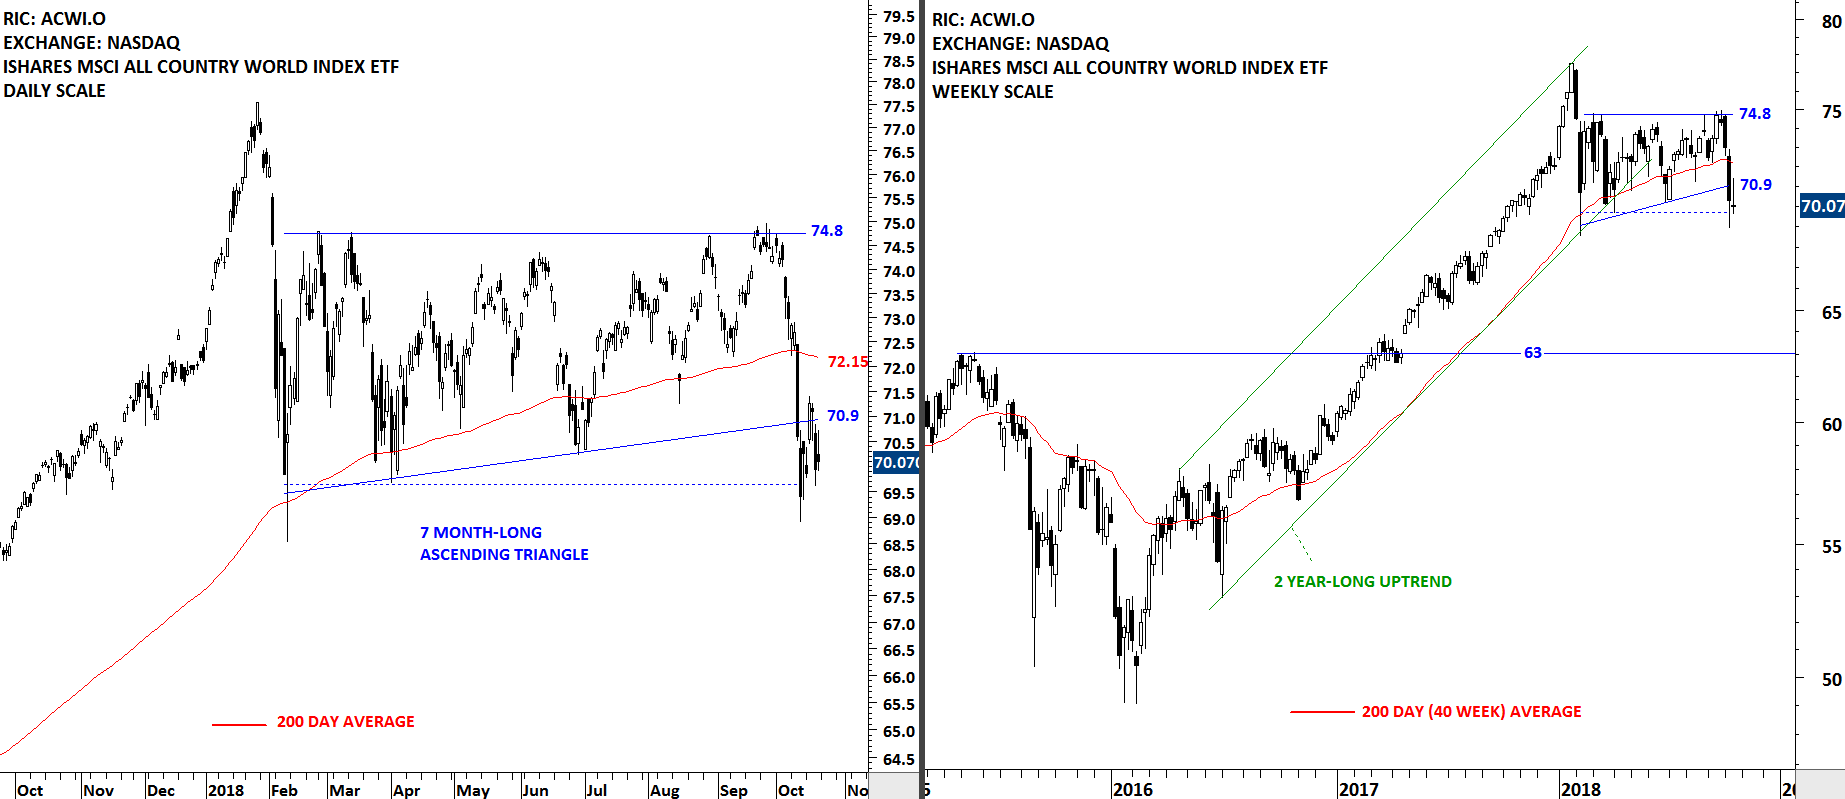
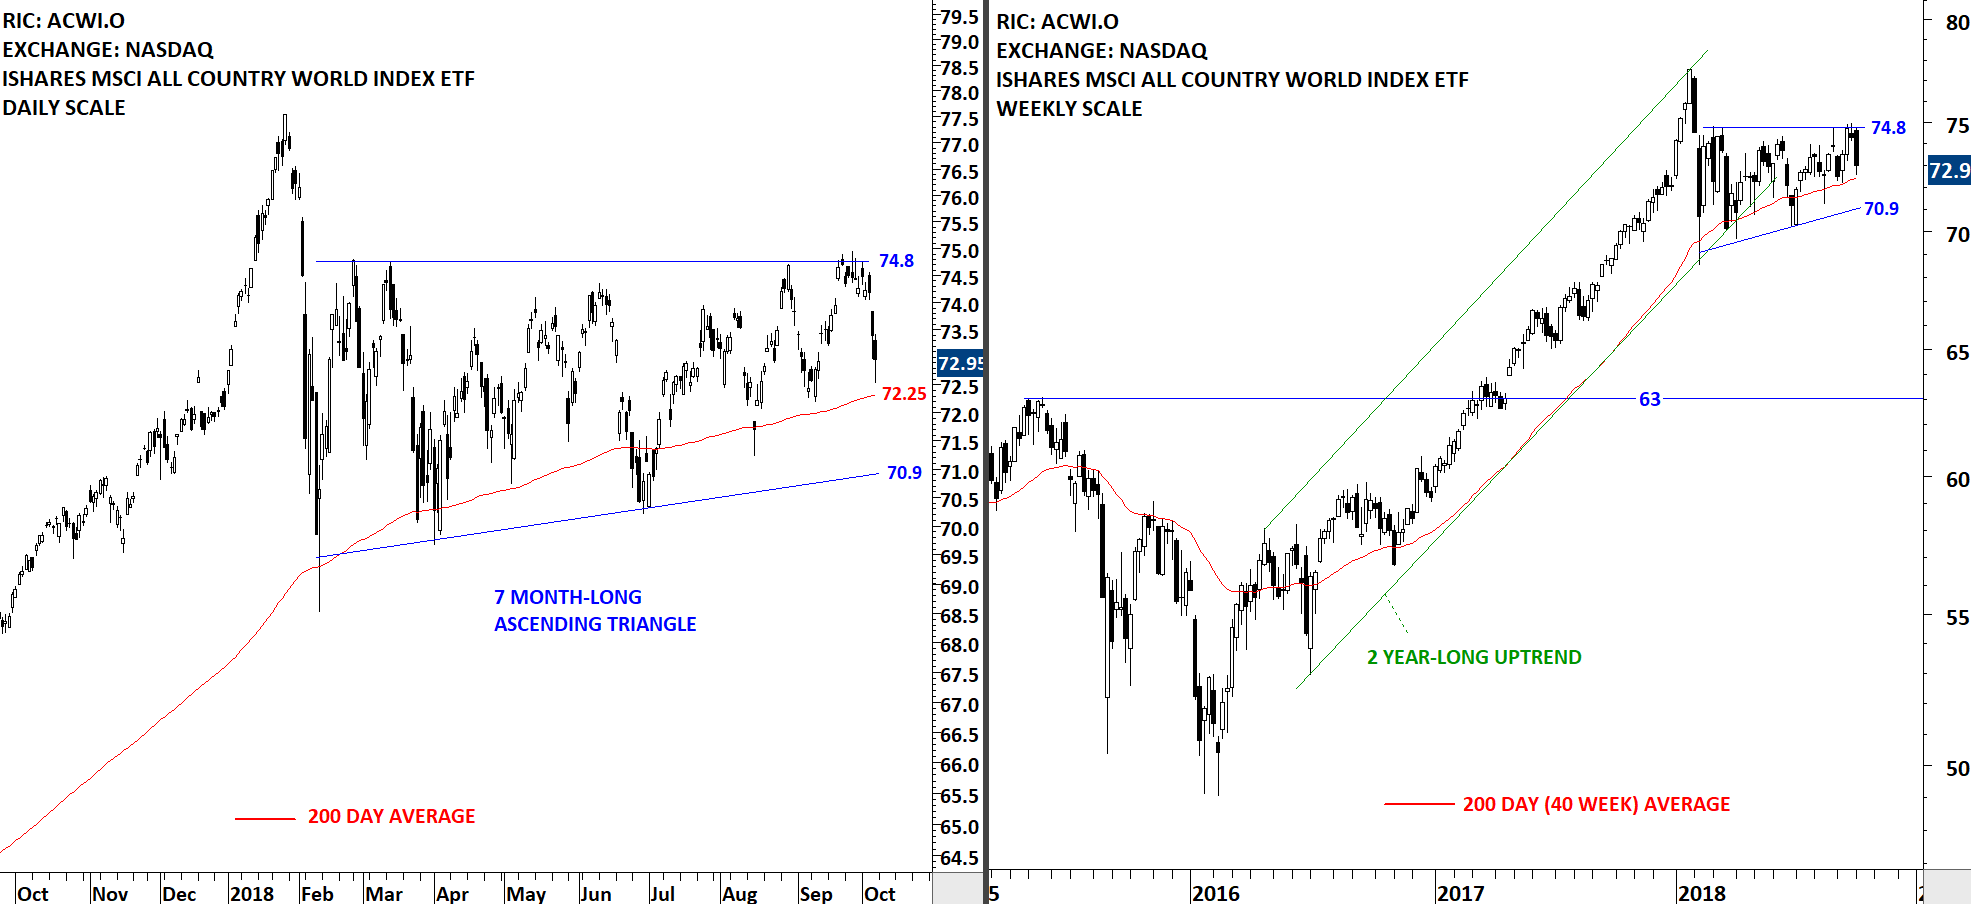
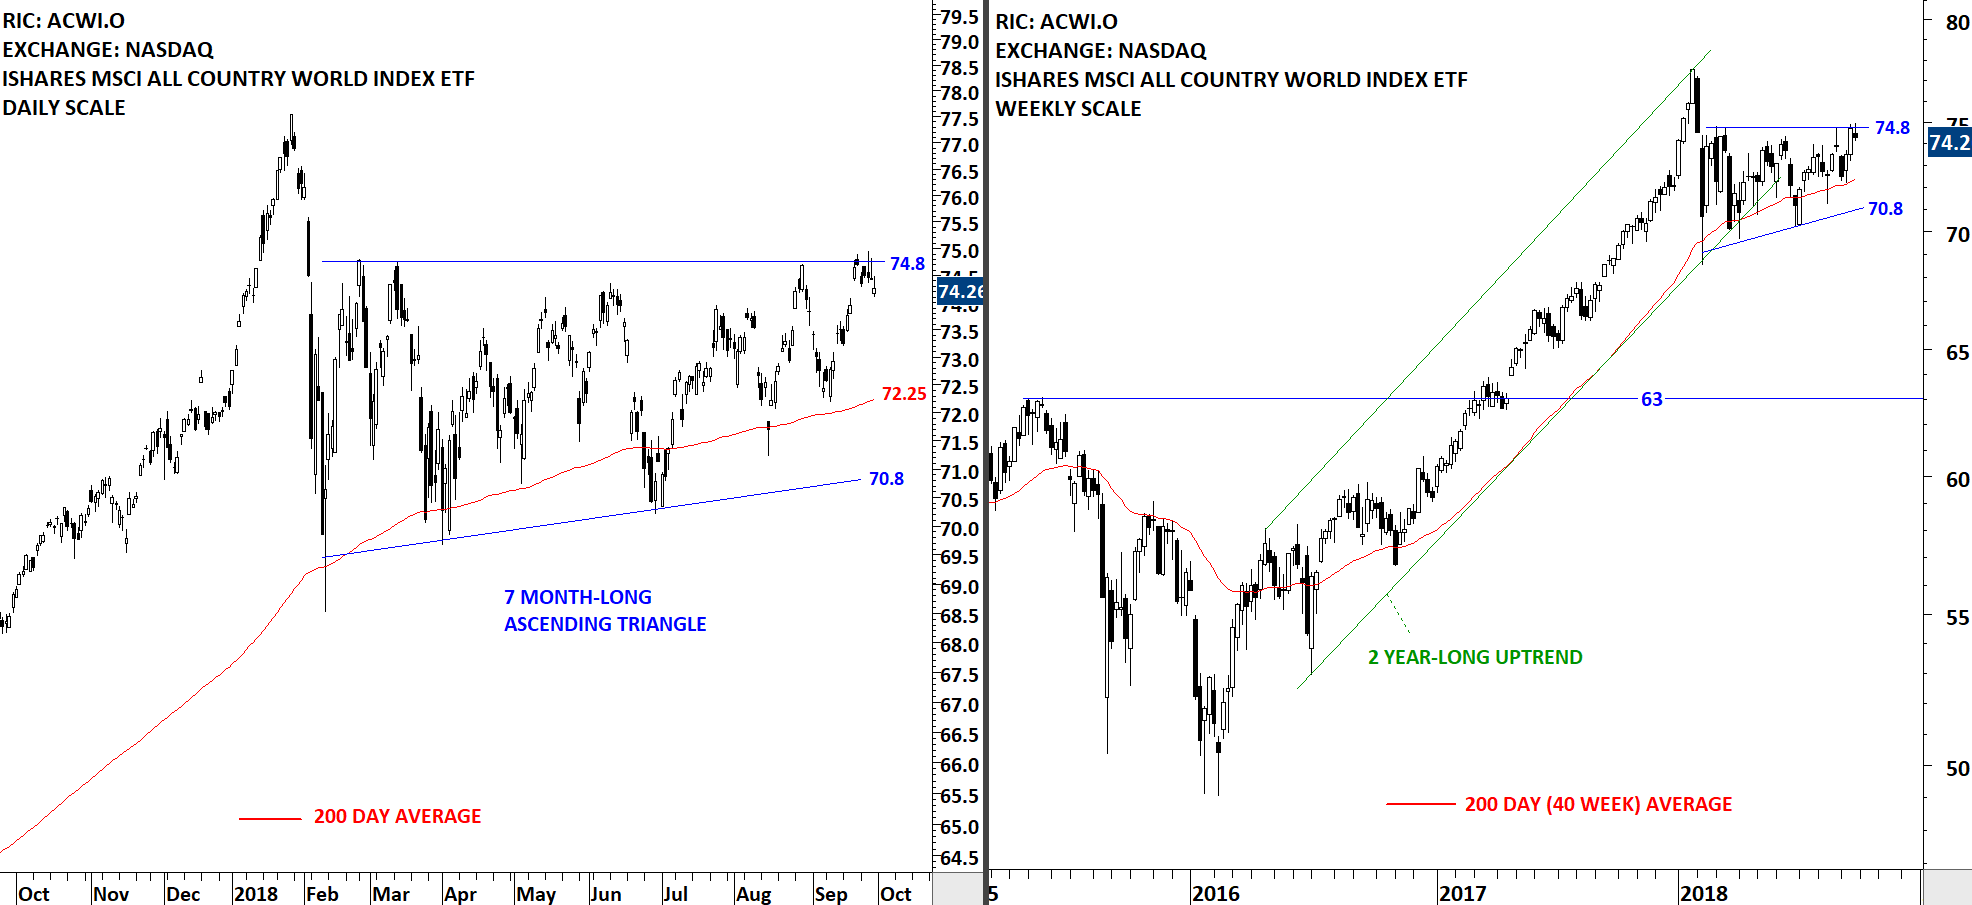
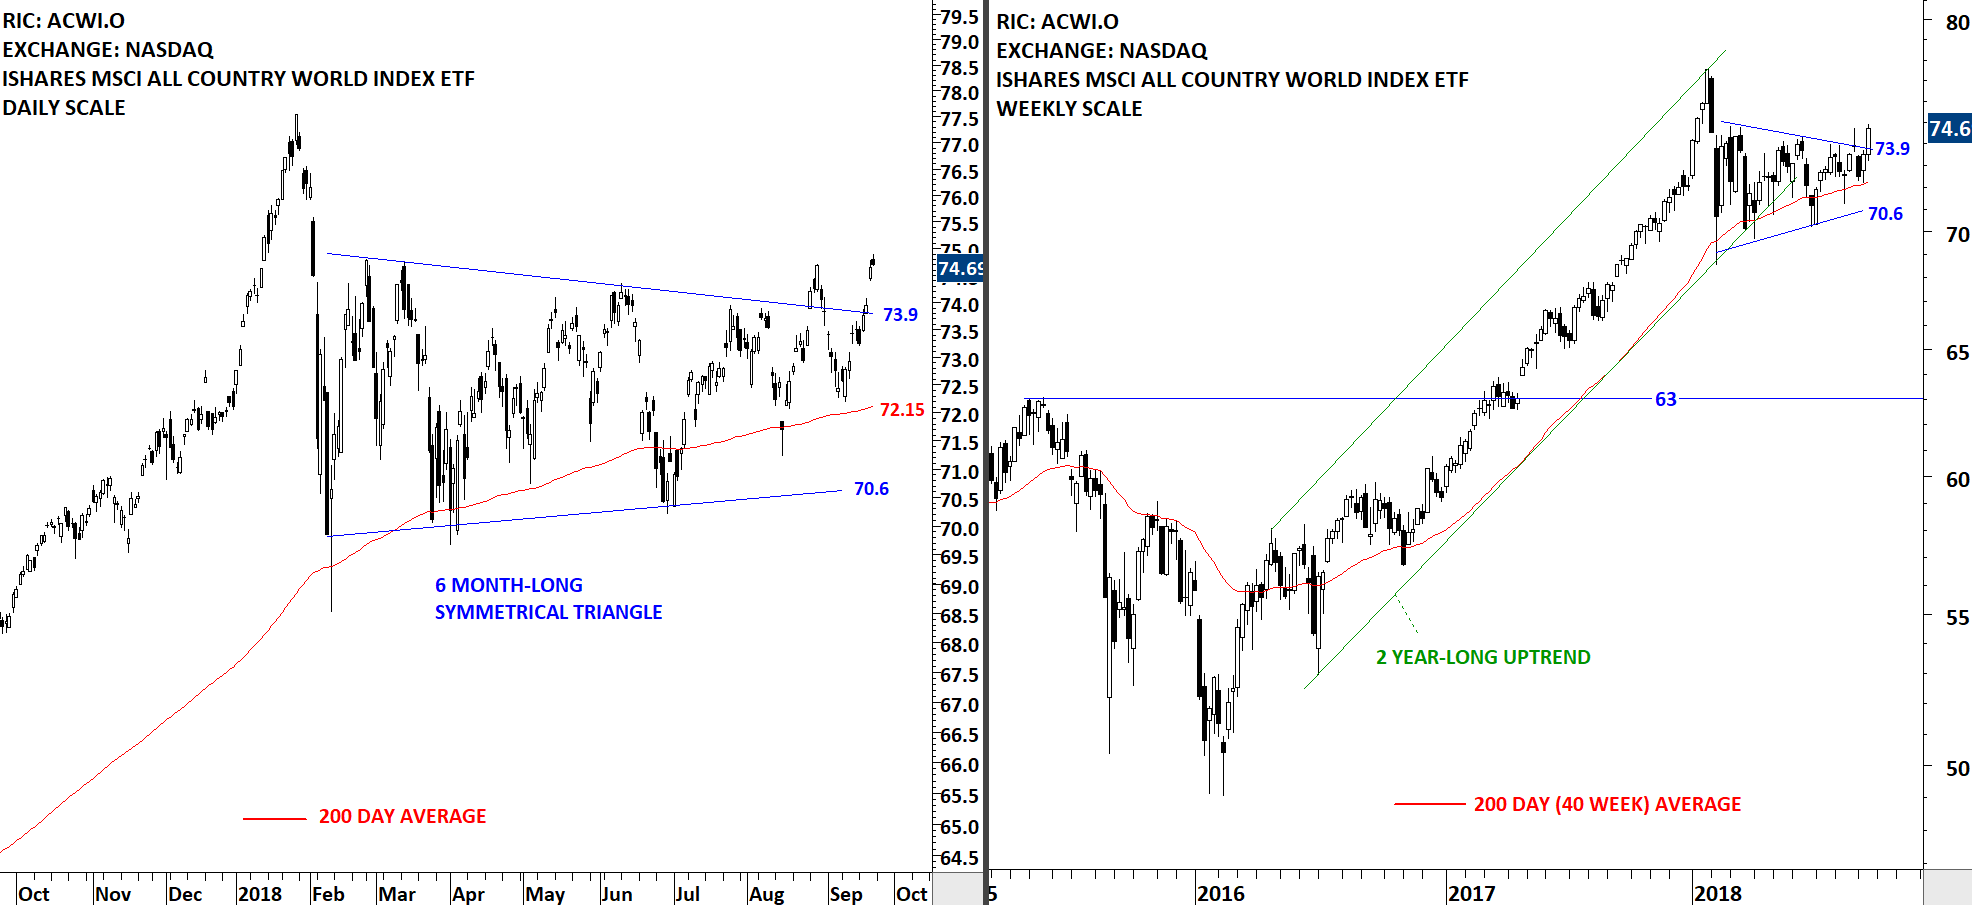
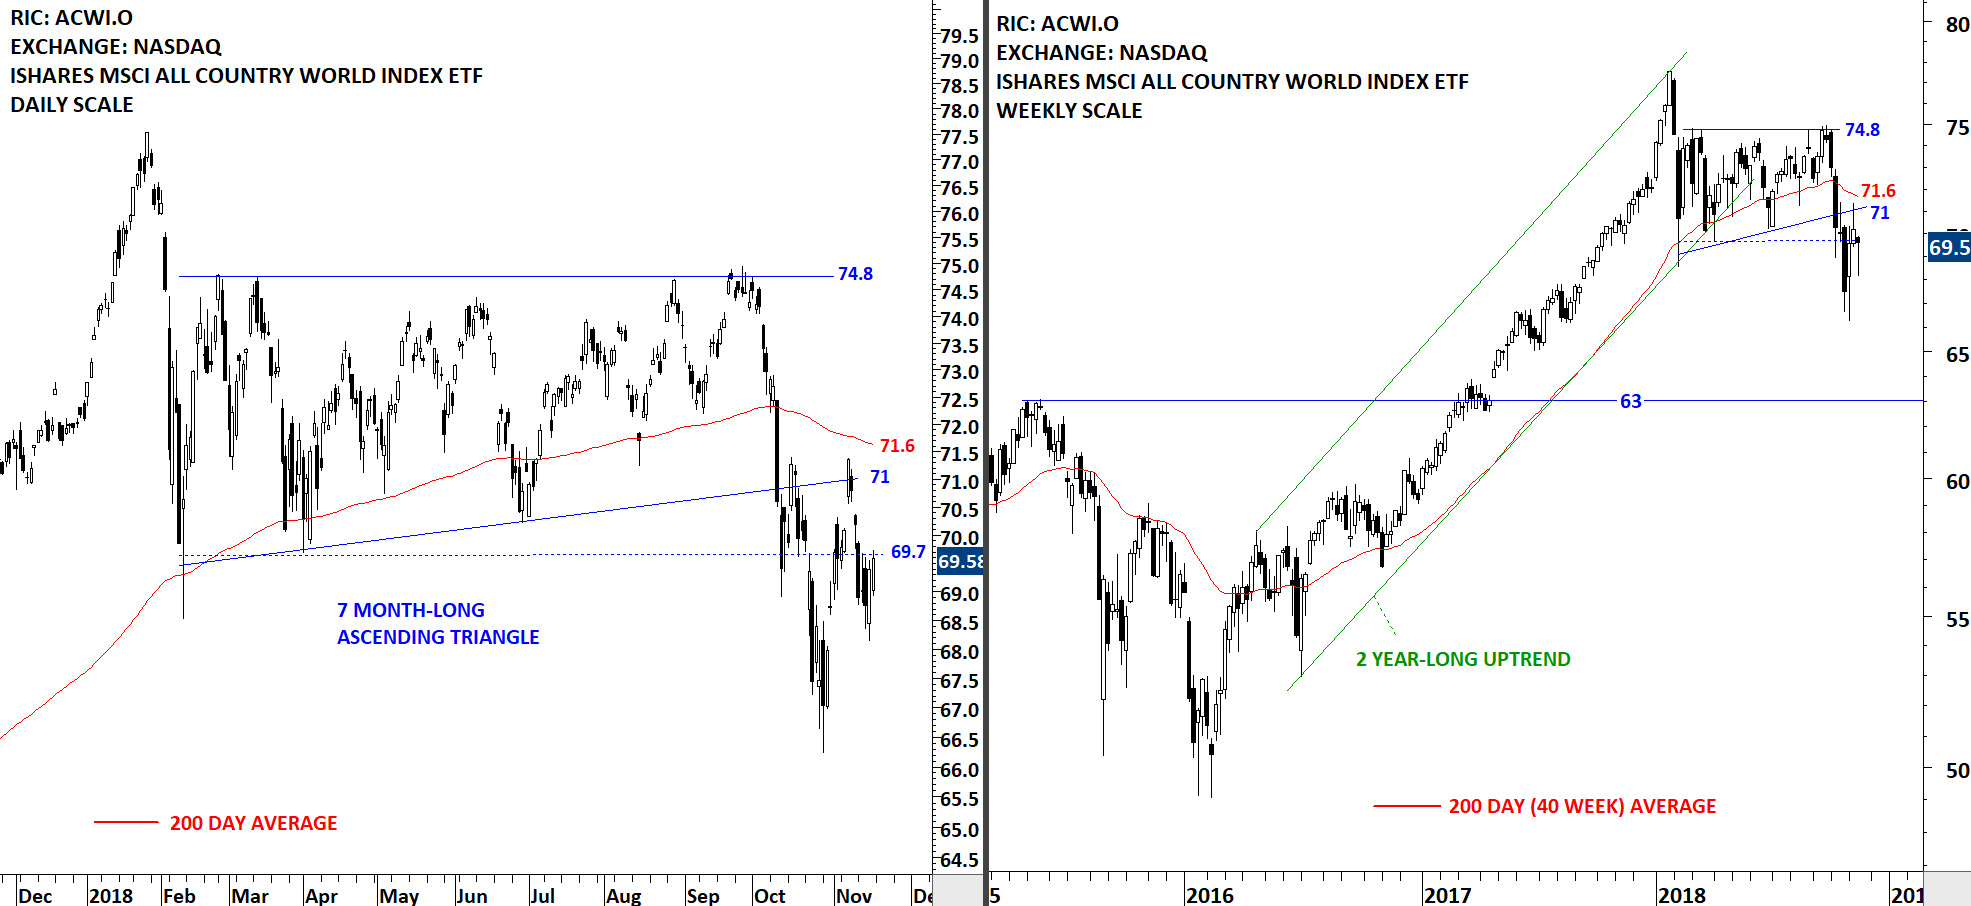
The benchmark for the Global Equity Markets performance, iShares MSCI All Country World Index ETF (ACWI.O) is trading below its long-term (200-day) average. Last one month's price action formed choppy and sideways consolidation. Earlier the ACWI ETF broke down its multi-month-long consolidation and ended a low volatility period. Volatility is cyclical. Low volatility begets high volatility and vice versa. Currently the ETF is consolidating its earlier sharp price decline from 75 to 66 levels. Strong resistance area is between 71 and 71.6 levels. Long-term support stands at 63 levels.

Read More

GLOBAL EQUITY MARKETS – November 10, 2018

REVIEW


The iShares MSCI All Country World Index ETF (ACWI.O) found resistance at the long-term 200-day (40-week) moving average. Last two week's price action can be a pullback to the broken support levels between 71 and 71.8. Until I see a recovery above the 200-day average, I will expect the choppy downward price action to resume. Global equities are likely to move in a wide trading range in the following weeks. Strong resistance area stands between 71 and 71.8 levels.

Read More

GLOBAL EQUITY MARKETS – November 3, 2018

REVIEW


Strong rebound on the iShares MSCI All Country World Index ETF pulled the price back to February lows. Strong resistance area stands between 70 and 71.8 levels. After a sharp drop and increase in volatility, we should expect more choppy price action resulting in a short-term consolidation. There is no chart pattern development that would suggest a short-term bottom at this stage. The ACWI ETF is trading below its long-term average.

Read More

GLOBAL EQUITY MARKETS – October 27, 2018

REVIEW


The benchmark for Global equity markets performance, iShares MSCI All Country World Index ETF (ACWI.O) broke down its February lows with a long weekly candle. The ACWI ETF is now clearly below its long-term 200-day moving average. February low at 69.7 levels will become the new strong resistance. Next support area for the ACWI ETF is between 63 and 65. In the short-term the daily chart needs to form some sort of a reversal chart pattern to conclude that the downtrend is over. The iShares MSCI All Country World Index ETF (ACWI.O) is in a downtrend.

Read More

GLOBAL EQUITY MARKETS – October 20, 2018

REVIEW


The iShares MSCI All Country World Index ETF (ACWI.O) is trying to hold above February 2018 lows. After reversing from the horizontal resistance at 74.8, the ETF fell below its long-term average and currently is trading below the 200-day average. This week's candlestick was a "doji". It shows that price found short-term support. Failure to hold above February lows can send the ETF towards the next strong support area at 63 levels.

Read More

EEM vs. ACWI

Every week Tech Charts Global Equity Markets report features some of the well-defined, mature classical chart patterns under a lengthy watchlist and the chart pattern breakout signals that took place during that week. Global Equity Markets report covers single stocks from developed, emerging and frontier markets, ETF’s and global equity indices. The report starts with a review section that highlights the important chart developments on global equity benchmarks. This blog post features a relative performance ratio between the iShares MSCI Emerging Markets Index ETF and iShares MSCI All Country World Index ETF.

Read More

GLOBAL EQUITY MARKETS – October 13, 2018

REVIEW


Since the beginning of 2018, the performance between Emerging Markets and Developed Markets diverged. Emerging Markets have underperformed the Developed Markets by around 15%. Two charts below show the relative performance ratio between EEM and ACWI and also the MSCI indices, MSCI Emerging Markets Index vs. MSCI World Markets Index. You can see the fluctuations on the ratio over the years.

2016-2017 was a period of EM outperformance. In the beginning of 2018, the ratio reversed sharply and the past 10 months resulted in a massive underperformance for the Emerging Markets. We might be at an inflection point as the ratio is now testing 2016 lows. Emerging Markets might start outperforming the Developed Markets once again. (The ratio is calculated by dividing two time series EEM & ACWI and indexing it to 1 on the 1st January 2018)

Read More

GLOBAL EQUITY MARKETS – October 6, 2018

REVIEW


If one needs to explain what "trend less" market looks like, there is no better example other than the iShares MSCI All Country World Index ETF (ACWI.O). Since the beginning of the year the ACWI ETF is stuck in a tight range between 75 and 70. Usually a low volatility period like this is followed by a strong directional movement. ACWI ETF has strong resistance at 74.8 and support at 70.9 levels. The ETF is still holding above its long-term average.

Read More

GLOBAL EQUITY MARKETS – September 29, 2018

REVIEW


On Tuesday we had our members webinar and we discussed symmetrical triangles. We received very positive feedback from our members. A recorded version of the webinar will be uploaded on the website for our premium members. We will inform you via e-mail when it is on the Tech Charts website. During the Q&A section one of our members brought to my attention the possibility of labeling the symmetrical triangle chart pattern on the iShares MSCI All Country World Index ETF (ACWI.O) as an ascending triangle. Ascending triangle has a bullish bias when compared with a symmetrical triangle. Given that the price respected the horizontal resistance at 74.8, I labelled the chart below with the ascending triangle interpretation. It is important to note that Global equities performance as measured by the iShares MSCI All Country World Index ETF is going through an extreme low volatility period. Usually these type of low volatility periods are followed by strong directional movement. Price for the ACWI is still trading in a tight range between 70.8 and 74.8.

Read More

GLOBAL EQUITY MARKETS – September 22, 2018

Reminder on Live Webinar

We are continuing our Member webinar series with another classical chart pattern; the symmetrical triangle. Live Webinar and Q&A with Aksel - Tuesday, September 25, 11am mountain. You can register here (Register for the Live Webinar)


REVIEW


Global equity markets performance as measured by the iShares MSCI All Country World Index ETF (ACWI.O) made another attempt this week to break out of its multi-month long sideways consolidations. The weekly close was at the high of the weekly candlestick. This week's price action is possibly a "secondary completion" of the symmetrical triangle chart pattern. Follow through in the following week can resume uptrend towards 2018 high levels.

Read More