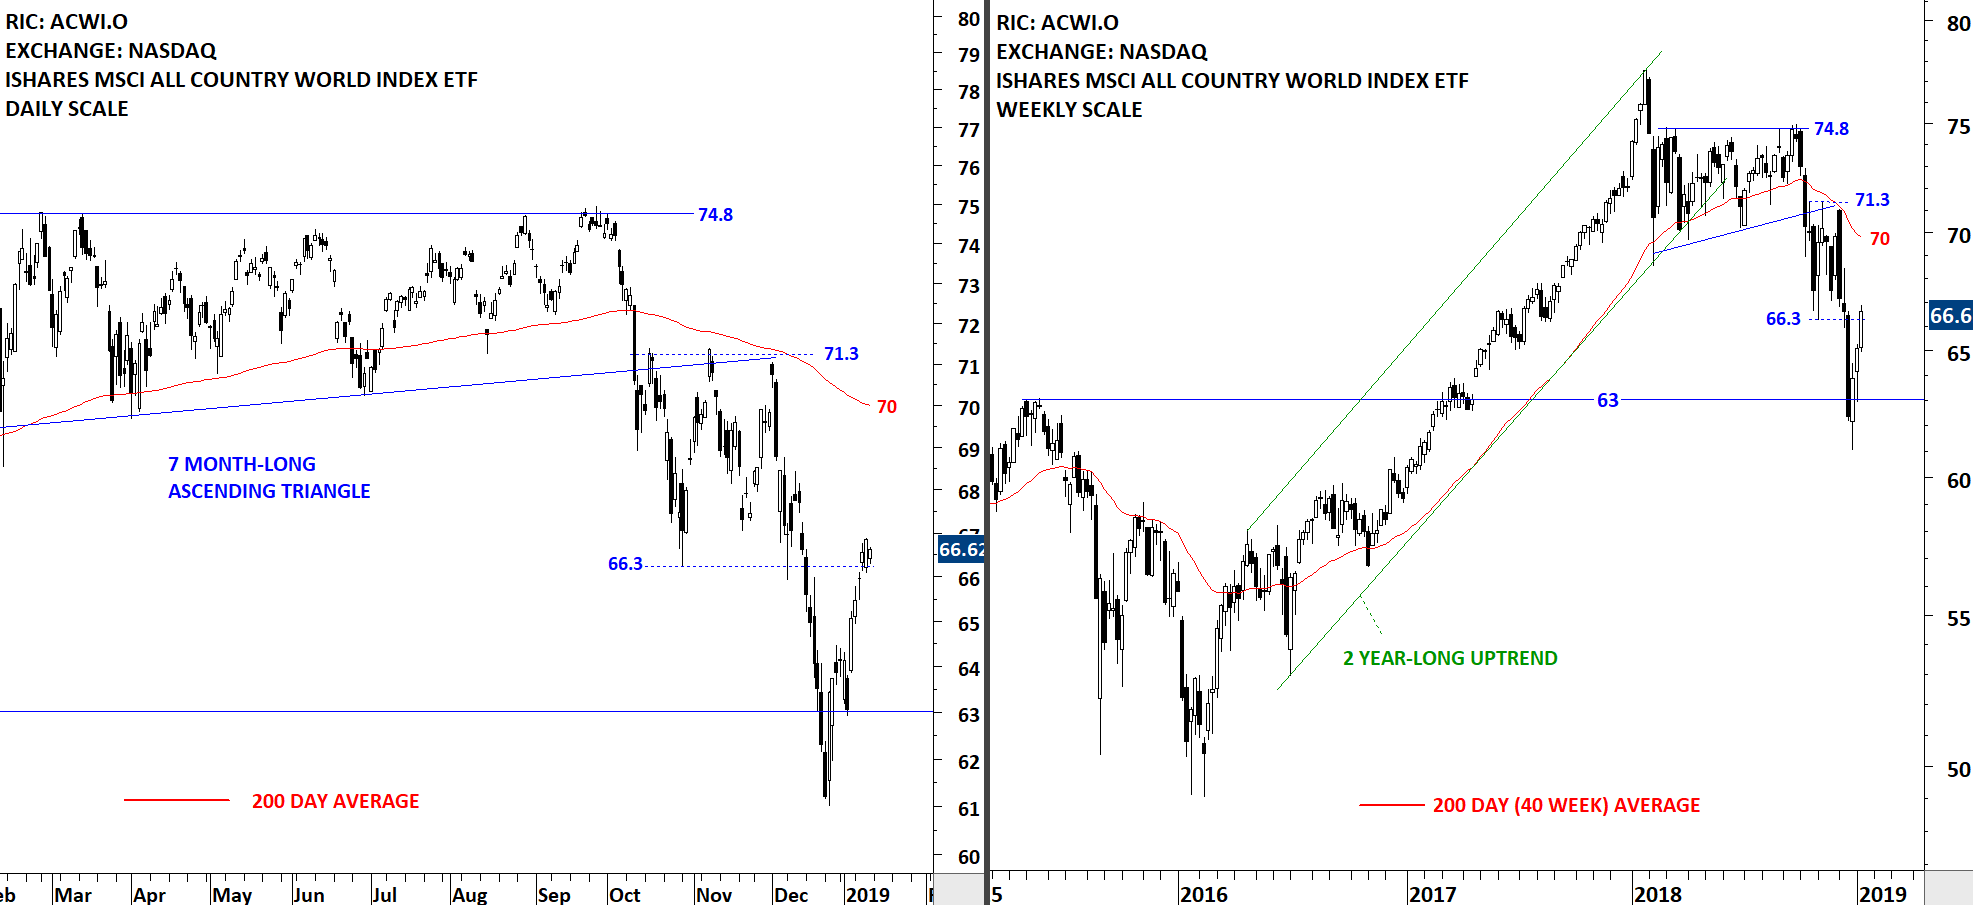
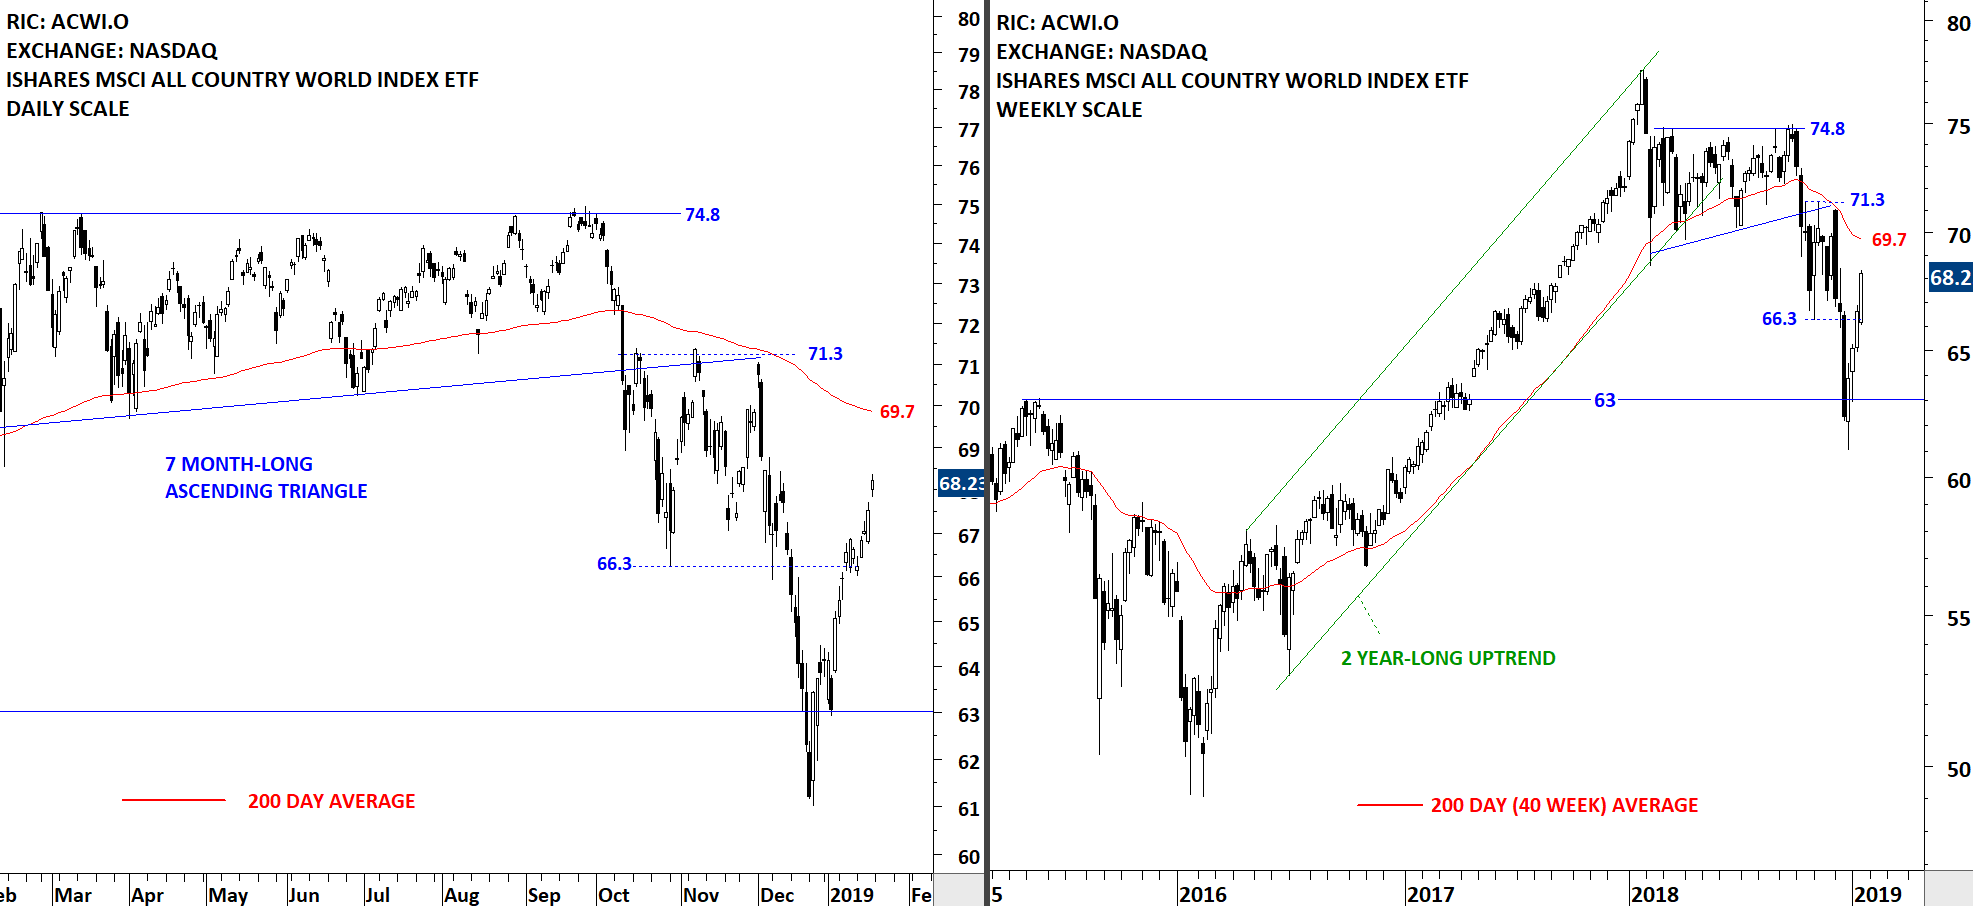
The iShares MSCI All Country World Index ETF, a measure of Global equity markets performance, had a sharp rebound from the support level at 63. V-bottom reversals are difficult to analyze and trade. If we have seen a V bottom and the ETF keeps climbing higher in the following weeks, I will wait for the price to stabilize around the long-term average. During any pullback I will monitor this ETF for short/medium-term bullish continuation chart pattern developments. Long-term 200-day moving average stands at 69.7 levels.
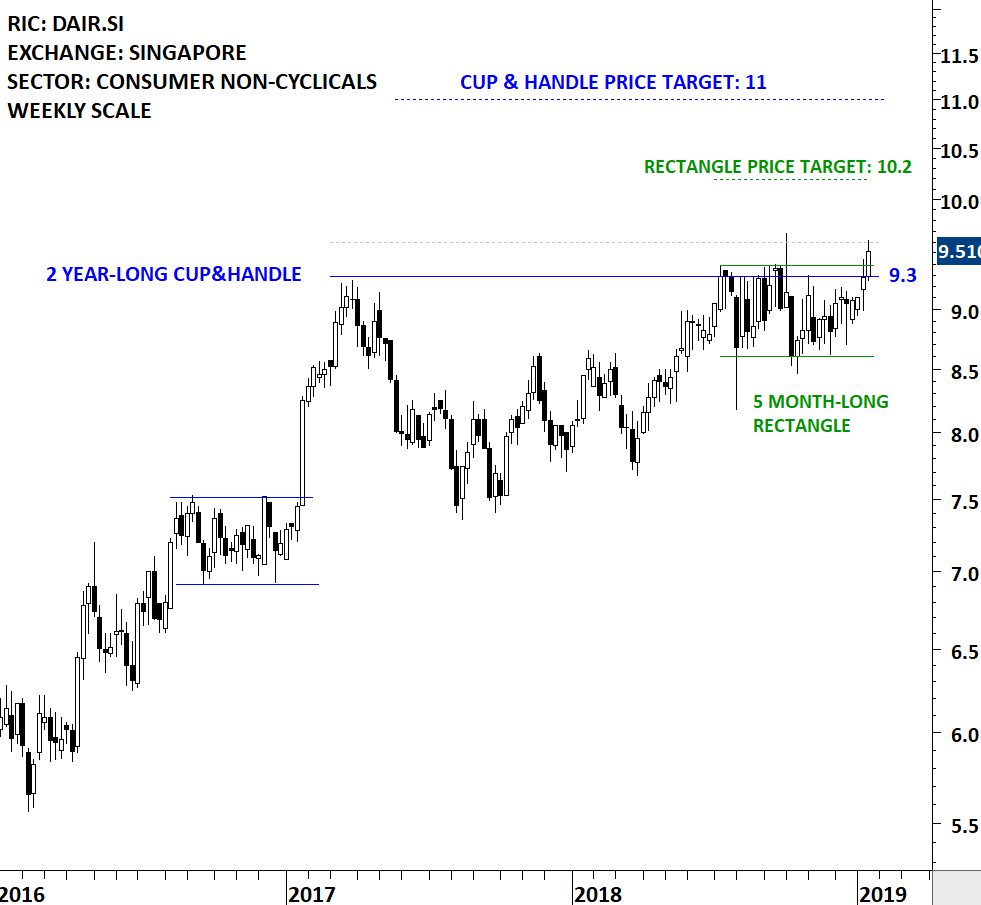
Every week Tech Charts Global Equity Markets report features some of the well-defined, mature classical chart patterns under a lengthy watchlist and the chart pattern breakout signals that took place during that week. Global Equity Markets report covers single stocks from developed, emerging and frontier markets, ETF’s and global equity indices. The report starts with a review section that highlights the important chart developments on global equity benchmarks. This blog post features from the watchlist section a bullish cup & handle continuation chart pattern on Singapore’s Dairy Farm International Holdings (DAIR.SI)
Dairy Farm International Holdings Limited is a Hong Kong-based Asian retailer. The Company operates in four segments: Food, Health and Beauty, Home Furnishings, and Restaurants. The stock is listed on the Singapore Stock Exchange. Price chart formed a 2 year-long cup & handle continuation with the horizontal boundary acting as strong resistance at 9.3 levels. The horizontal boundary was tested several times over the course of the chart pattern. A daily close above 9.6 levels will confirm the breakout from the 2 year-long cup & handle continuation with the possible chart pattern price target of 11 levels. The handle part of the multi year-long consolidation can be identified as a possible rectangle that can act as a launching pattern. Price data is as of January 15, 2019 CET 7:00 AM.
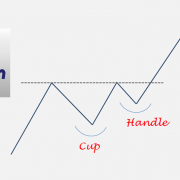
EDUCATIONAL VIDEO ON CUP & HANDLE CONTINUATION CHART PATTERN
Tech Charts Membership
By becoming a Premium Member, you’ll be able to improve your knowledge of the principles of classical charting.
With this knowledge, you can merge them with your investing system. In fact, some investors use my analyses to modify their existing style to invest more efficiently and successfully.
The iShares MSCI All Country World Index ETF, a measure of Global equity markets performance, had a sharp rebound from the support level at 63. Back to back weekly gains pushed the index towards the resistance area between 66.3 and 70. Is the recent rebound part of a bottoming process or a counter-trend rally in a downtrend? The answer lies in the following week's price action. V-bottom reversals are difficult to analyze and trade. If we have seen a V bottom and the ETF keeps climbing higher in the following weeks, I will wait for the price to stabilize above the long-term average. If there is a re-test of previous lows in an attempt to form a double bottom, then I will monitor the ETF for a long opportunity. The other possibility is that we see a short-term consolidation before moving higher. That again will alert me to look for bullish setups.

 Read More