Posts

Chart Pattern Statistics, H&S continuation and H&S failures – December 2020 Tech Charts Webinar

Chart Pattern Statistics, H&S continuation and H&S failures - December 2020 Tech Charts Webinar

We are continuing our Member webinar series with several important and frequently asked topics. Given that the topics are different concepts in technical analysis/classical charting and trading, each section will have a +/- 10 min presentation followed by Q&A on that section.

Webinar Outline
  • Review of chart pattern statistics and discussion on chart pattern reliability / Q&A
  • Current market conditions and review of major benchmarks/important chart pattern developments / Q&A
  • A frequently asked chart pattern, H&S continuation and review of H&S failures and how to trade them / Q&A
  • A typical day for me, the daily routine, selection of markets, review and research tips / Q&A
  • Additional Q&A
Live questions from Members Concept One 2:30
  1. No Questions 
Concept Two 16:45
  1. I wanted to know more about log scale and how to set targets using it. For instance, I have seen some chartist giving two targets for H&S, one for each scale. 28:44
  2. Where do you usually set your "stop loss" in the H&S bottom/continuation? Is it the negation level, or do you use other criteria? 30:35
  3. Do you use the 200 SMA or Exponential & why? Any other moving average you use? 32:11
  4. Could you provide another example or two for setting the H&S target? Do we measure from the neckline to the bottom of the lowest candle body in the head, or to a wick? 33:31
  5. Do you always get out of 100% of your trade when it gets to its objective? Or do you switch to a trailing stop? 33:47
Link of interest Concept Three 34:15
  1. On the last chart, it didn't look the H&S pattern had been completed by breaching the neckline, so why is it a H&S failure? (Possibly page 17 or 18.) 49:09
  2. How did you calculate the H&S failure price target on page 19? 50:21
  3. In the H&S bottom with NON-Horizontal neckline (neckline with slope), how do you measure the price target? 51:03
  4. If you wait for the closing price for the breakout signal, how do you decide the trigger price? 51:38
  5. Are you discounting the validity of vertical necklines against the horizontal ones? 52:35
  6. How do you handle spindles? By using Stop Close Only orders? 53:28
  7. If a stocks breaks down and then reverses and goes above the right shoulder, is that a H&S failure? 54:26
Concept Four 55:05
  1. In this BTC Monthly chart, in the log scale, do you see "Cup & Handle" with a neckline at $13,880? 1:05:00
  2. How do you look at Netflix now? 1:06:16
  3. How did you set the target about the sym triangle in slide 30? from the first point? 1:06:53
  4. Do you ever take any help from any indicator while identifying the chart patterns? 1:07:32
  5. Please check GH & KO in you have time 1:08:35
  6. With weekly patterns the chart validation points usually have much wider risk; what % of NAV risk for each position do you use for weekly and what for daily patterns breakouts? 1:08:44
Concept Five 1:11:33
  1. In the US Marker review, for example, I am assuming you are not going chart by chart and have a certain criteria "as starting point" to pick your charts. Do you mind sharing your criteria (if any)? 1:16:24  
  2. Vacation? 1:17:49
  3. Can you explain a bit more about how you use volatility to identify possible patterns? I'm not sure how you review so many stocks! 1:18:05
  4. Do you scan charts by industry? 1:20:14
  5. Do you enter orders during 1 hour before the close? 1:20:41
  6. Would you elaborate a bit further about cases that you can open a position intraday, and do you keep stops during weekends? 1:21:20 
Additional questions 1:23:44
  1. The filter I find useful is the MA 18 weekly rather EMA 200 . What do you think about it? 1:23:45
  2. Could you suggest about position size strategy? 1:24:27
  3. I know you previously mentioned about sending a report on Chinese stocks. Are you still planning to do so - thanks for all you do. 1:25:17
  4. Aren't Keltner channels more useful than Bollinger bands? After all, Keltner is based on ATRs -- actual price ranges, not just the moving average close which Bollinger uses? 1:25:42
  5. Do you think the volume of stocks is relevant for the pattern success ratio? 1:26:31
Link of interest Recorded live 12.03.2020   Read More

Re-entry, Volatility & ATR based stop-loss – September 2020 Tech Charts Webinar

Re-entry, Volatility & ATR based stop-loss - September 2020 Tech Charts Webinar We are continuing our Member webinar series with several important and frequently asked topics. In the following webinar, we will follow a different approach. Given that the topics are different concepts in technical analysis/classical charting and trading, each section will have a +/- 10 min presentation followed by Q&A on that section. Webinar Outline
  • RE-ENTRY strategy after an out of line movement or hard re-test. We will try to understand how to navigate volatile price action around pattern boundaries. Followed by Q&A
  • Differences between Stop-loss and Chart pattern negation levels.
  • Volatility (Average True Range and Bollinger Bands).
  • 200-day average, how to utilize it as a trend-following tool.
  • ATR based trailing stop-loss and its application on chart pattern breakouts.
  • Follow-up Q&A
Live questions from Members Concept One 2:27
  • Are there any situations in which you'd enter a trade immediately upon breakout, rather than waiting for the daily close? How about the opposite -- are there situations where you might wait a little longer after a breakout to buy? 25:09
  • Do head and shoulders with sloping necklines as reliable as the ones with flat necklines? 27:25
Concept Two 27:52
  1. Would you ignore breakout from chart patterns happening far away from 200dma? 36:47
  2. Except 200 dma, ATR trailing stop loss, which other indicators you use (if you use) for confirmation of a breakout? 37:35
  3. Is the 200 dma simple or exponential? What are the pros & cons of one compared to the other? 38:54 
  4. Why the 200EMA and not the 200SMA? 39:20
  5. Would you track the crossing over of the 50 DMA and 200 DMA? 39:51
  6. EMA on Weekly or Monthly also? 40:05
Helpful video links:  Concept Three 40:53
  1. You use volatility bandwidth instead of bands? 56:05
  2. What is the ATR minimum target you will use for bullish or bearish breakouts? 56:31
  3. What period of EMA would be reasonable to apply on the ATR to identify the volatility. I'm asking this because the volatility usually doesn't change by large amounts in forex. 57:08
  4. Similarly, what is the BB width do you use for bullish or bearish breakouts? 57:48 (Recommended Reading List) 
  5. Can you apply these same practices to predicting breakdowns for shorting? 58:18
Additional Questions
  1. Do you use these patterns mainly for stocks/equities or futures/options as well? If yes, then how do you manage the risk for F&O? 58:35
  2. Has Brent crude oil broken downwards from a wedge pattern today? 59:14  
  3. Please post charts of the companies listed in the US when you post it when listed in Asia or any other country. For example, when you post a chart for Dr.Reddy's Lab, India listed is also listed in the US under ticker RDY along with the chart for Dr. Reddy's, etc. 59:26
  4. Do you use price charts with adjusted dividend data or without adjusted dividend data. What is the reason preferring one over another? 1:01:26   
  5. Why don't you use volumes in your charts? Can you please explain the reasons? 1:03:14
  6. While trading in forex, the 3% breakout rule doesn't seem to apply. Are you aware of any specific measure which could be followed in forex like in terms of pips or percentage? 1:05:24
  7. Just like me, your methods of based heavily on the classical methods on TA. Do you use any automation to scan for classical pattern s on Metastock? I don't think that such automation to scan classical pattern is possible -- and on the other h and, manual flipping of charts is extremely time-consuming. 1:06:10
  8. Do you use that ATR Trailing in MetaStock with a special indicator? 1:07:50 (ATR trailing stop-loss plug in for MetaStock) 
  9. How did you determine the best stoploss ATR? 1:08:46
  10. When is the best time to enter a trade? Just a few minutes before the closing or the day after at opening? 1:09:25
  11. Do you check the relation between volume and the price when deciding to enter or exit the position? 1:10:41
  12. Why do you like Metastock rather than other websites? Any strong reasons? 1:11:16
Recorded live 09.03.2020     Read More

CUP & HANDLE CONTINUATION

Every week Tech Charts Global Equity Markets report features some of the well-defined, mature classical chart patterns under a lengthy watchlist and the chart pattern breakout signals that took place during that week. Global Equity Markets report covers single stocks from developed, emerging and frontier markets, ETF’s and global equity indices. The report starts with a review section that highlights the important chart developments on global equity benchmarks. This blog post features from the watchlist section a cup & handle continuation chart pattern listed on the Nasdaq Stock Exchange.

Also you will find below a short educational video on how to identify a cup & handle continuation chart pattern, how to measure price objective and what to expect following the breakout.

If you are interested to learn more about classical charting principles and fine points on how to trade those breakout opportunities, our annual special discount is still ongoing and finalizing today (June 10th). You can get access to everything on Tech Charts website for $29 for 3 months (special discounted price is valid for the first 3 months only). More than 35 educational videos, each with 5-10 min of important points to look for on a classical chart pattern.

Here is the link for special 3rd anniversary discount >> GET ACCESS NOW

MOMENTA PHARMACEUTICALS INC (MNTA.OQ)

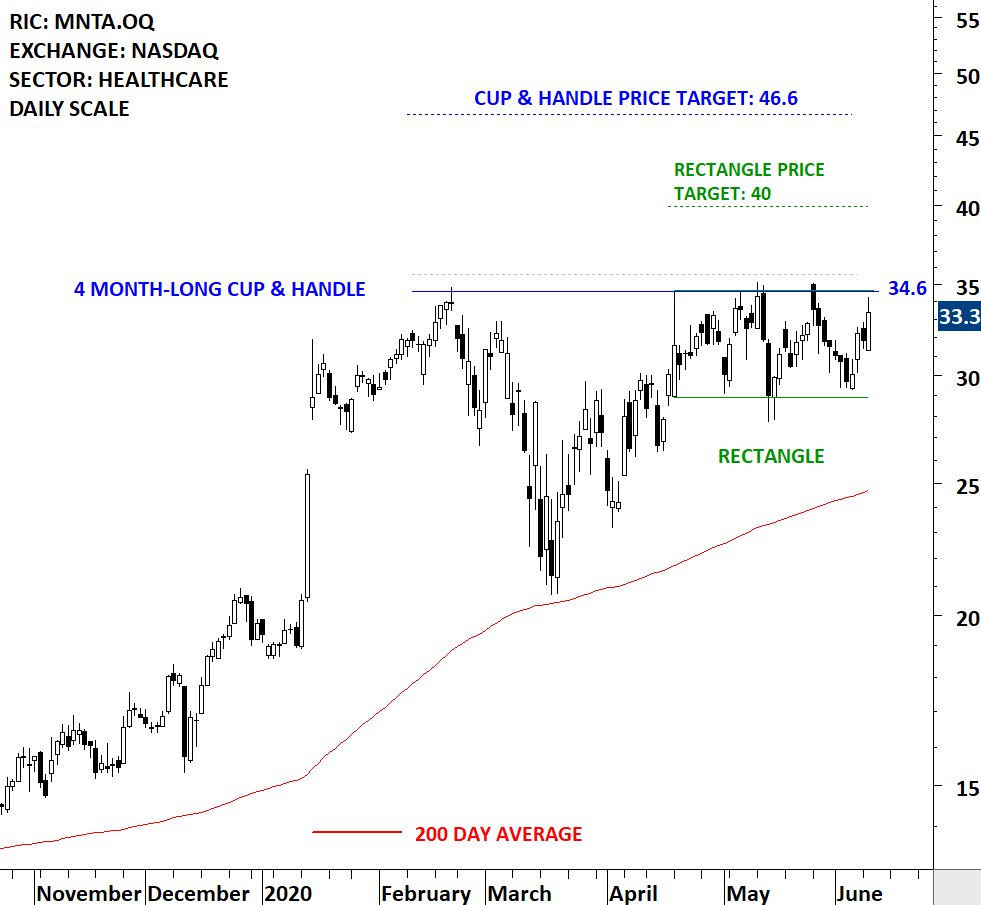
Momenta Pharmaceuticals, Inc. is a biotechnology company. The Company is focused on developing generic versions of drugs, biosimilars and therapeutics for oncology and autoimmune disease. The stock is listed on the Nasdaq Stock Exchange. Price chart formed a 4 month-long cup & handle continuation with the horizontal boundary acting as strong resistance at 34.60 levels. The horizontal boundary was tested several times over the course of the chart pattern. A daily close above 35.60 levels will confirm the breakout from the 4 month-long cup & handle continuation with the possible chart pattern price target of 46.60 levels. The handle part of the chart pattern can be identified as a rectangle with the possible chart pattern price target of 40 levels. (Data as of June 9, 2020)

CUP & HANDLE CONTINUATION CHART PATTERN


Tech Charts Membership

By becoming a Premium Member, you’ll be able to improve your knowledge of the principles of classical charting.

With this knowledge, you can merge them with your investing system. In fact, some investors use my analyses to modify their existing style to invest more efficiently and successfully.

Get Access Now

As a Premium Member of Aksel Kibar’s Tech Charts,

You will receive:

  • Global Equities Report. Delivered weekly.
  • Classical charting principles. Learn patterns and setups.
  • Actionable information. Worldwide indices and stocks of interest.
  • Risk management advice. The important trading points of each chart.
  • Information on breakout opportunities. Identify the ones you want to take action on.
  • Video tutorials. How patterns form and why they succeed or fail.
  • Watch list alerts. As they become available so you can act quickly.
  • Breakout alerts. Usually once a week.
  • Access to everything (now and as it becomes available)
    o Reports
    o Videos and video series
  • Multi-part webinar course. You learn the 8 most common charting principles.
  • Webinars. Actionable and timely advice on breaking out chart patterns.

For your convenience your membership auto renews each year.

Get Access Now

CUP & HANDLE CONTINUATION

Every week Tech Charts Global Equity Markets report features some of the well-defined, mature classical chart patterns under a lengthy watchlist and the chart pattern breakout signals that took place during that week. Global Equity Markets report covers single stocks from developed, emerging and frontier markets, ETF’s and global equity indices. The report starts with a review section that highlights the important chart developments on global equity benchmarks. This blog post features from the watchlist section a cup & handle continuation chart pattern listed on the Nasdaq Stock Exchange.

ADVANCED MICRO DEVICES INC (AMD.O)

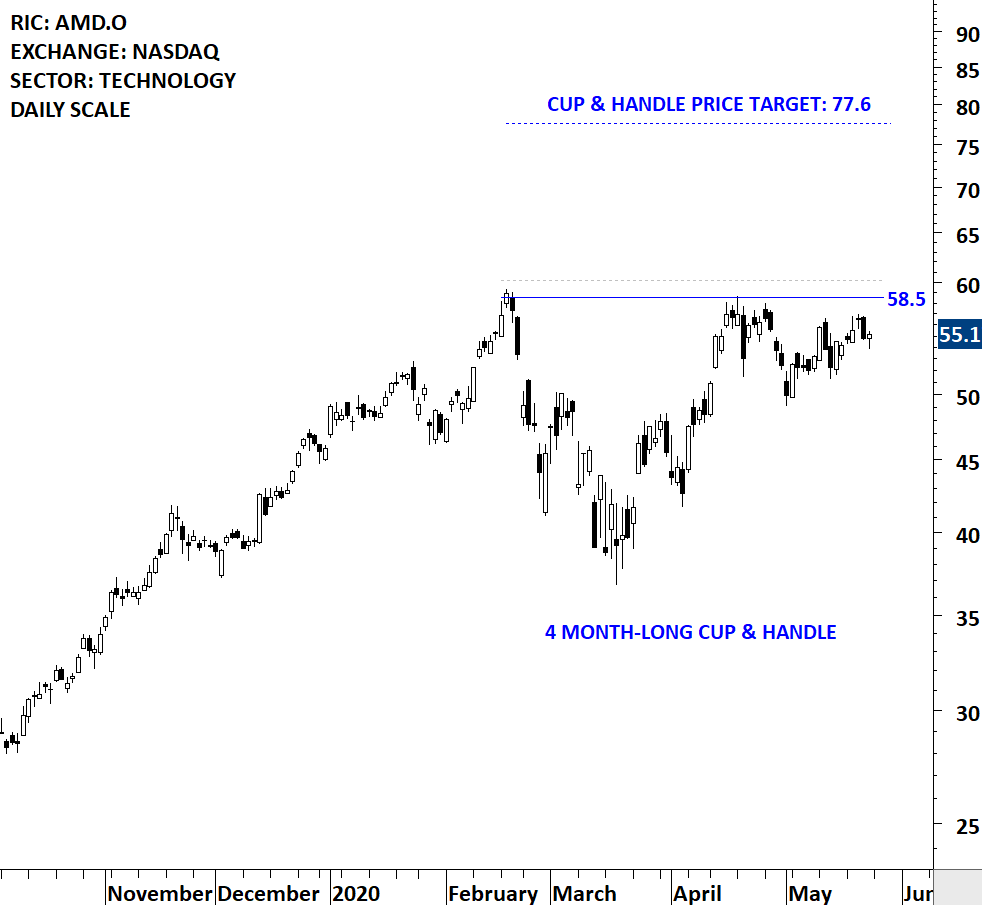
Advanced Micro Devices, Inc. is a global semiconductor company. The Company is engaged in offering x86 microprocessors, as standalone devices or as incorporated into an accelerated processing unit (APU), chipsets, discrete graphics processing units (GPUs) and professional graphics, and server and embedded processors and semi-custom System-on-Chip (SoC) products and technology for game consoles. The stock is listed on the Nasdaq Stock Exchange. Price chart formed a 4 month-long cup & handle with the horizontal boundary acting as strong resistance at 58.5 levels. The horizontal boundary was tested several times over the course of the chart pattern. A daily close above 60.2 levels will confirm the breakout from the 4 month-long cup & handle with the possible chart pattern price target of 77.6 levels.


Tech Charts Membership

By becoming a Premium Member, you’ll be able to improve your knowledge of the principles of classical charting.

With this knowledge, you can merge them with your investing system. In fact, some investors use my analyses to modify their existing style to invest more efficiently and successfully.

Get Access Now

As a Premium Member of Aksel Kibar’s Tech Charts,

You will receive:

  • Global Equities Report. Delivered weekly.
  • Classical charting principles. Learn patterns and setups.
  • Actionable information. Worldwide indices and stocks of interest.
  • Risk management advice. The important trading points of each chart.
  • Information on breakout opportunities. Identify the ones you want to take action on.
  • Video tutorials. How patterns form and why they succeed or fail.
  • Watch list alerts. As they become available so you can act quickly.
  • Breakout alerts. Usually once a week.
  • Access to everything (now and as it becomes available)
    o Reports
    o Videos and video series
  • Multi-part webinar course. You learn the 8 most common charting principles.
  • Webinars. Actionable and timely advice on breaking out chart patterns.

For your convenience your membership auto renews each year.

Get Access Now

4 Types of Breakouts – March 2020 Tech Charts Webinar

4 Types of Breakouts - March 2020 Tech Charts Webinar

We are continuing our Member webinar series with a review of 4 types of breakouts. 

Type 1 are breakouts that immediately rally to price target. Type 2 are breakouts that pullback to chart pattern boundary after the breakout but do not challenge the previously broken support/resistance. These two breakouts are relatively easier to manage when compared with the breakouts that experience a hard re-test (penetrating the chart pattern boundary after a breakout) and those that fail (Type 3 & Type 4).

We will review all 4 types of breakouts with recent examples and discuss strategies to manage each condition.

Webinar Outline
  • We will review some of those chart pattern breakouts that rally to their price objective without any pullback
  • We will review some of the breakouts that complete an orderly pullback to chart pattern boundary
  • We will look at some of the breakouts that experience hard re-test and challenge chart pattern boundaries
  • We will review some of the breakouts that failed off of the starting gate.
  • We will have a member Q&A at the end of the webinar.
Live questions from Members  
  1. I know you're a classical market technician, but with such a severe one-sided breakdown, are you ever tempted to trade something for a pullback even though you don't have a classical pattern? 36:21
  2. Does the speed with which a pattern breakout achieves the target price indicate that you should let the trade run? 37:24
  3. Can you find signs in the chart that could indicate what type of breakout is going to occur? 38:02
  4. Do you reduce your position sizing (i.e., instead of 1% risk per trade, 0.50% risk) during extended volatility like we're seeing? 39:42
  5. Can you explain how to calculate the trailing stop loss again? 40:10
    1. Additional links ATR Trailing Stop-Loss – H&S Top & ATR plug-in
  6. How do you incorporate sentiment measures (COT DSI etc.) into your decision making? 40:48  
  7. Do you think that in market conditions such as these, the probability of a failed chart occurring is higher? 41:02
  8. Do you ever circumvent your ATR trailing stop and place it below a newly formed chart pattern negation level that's above the initial entry position? 42:32
  9. I noticed that on one trade, you placed an SL at the bottom of a gap, but on another, you placed it at the top of a GAP. Do you have rules for deciding this? 43:50
  10. Is it possible to use this method for long term investing? If yes, would you use the same trailing method? 45:13
  11. Can the ATR stop rule be implemented in a trading platform? 46:19
  12. How do you determine your ATR length and multiplier number? Is it historical chart based and specific to a specific chart? Are commodities different than stock charts? 47:13
  13. As volatility during the day can be larger, have you used one ATR multiple for intra-bar & a lesser ATR multiple near the close, whereby one cancels the other OCO? 49:20
  14. Over the years, the ratio between reversal patterns vs. continuation patterns? Do you cap that ratio, or you let the patterns dictate what you have currently? 50:08
  15. Do you always trade long? Never short? 51:13
Recorded live 03.26.2020    Read More

Short-Term Chart Patterns Tech Charts Webinar

Please enjoy this Tech Charts Member webinar recorded live December 12, 2019

Short-Term Chart Patterns - December 2019 Tech Charts Webinar

This webinar is a discussion on chart patterns that develop and complete on a short-term time frame, in the duration between 1 month to 3 months.

Webinar Outline

  • We will review some of those chart pattern breakouts that were featured in the Global Equity Markets report
  • We will review some of the conditions that are required for successful completion of different chart patterns both on daily and weekly time frame
  • We will look at some of the developing chart patterns
  • We will have a member Q&A at the end of the webinar

Live questions from Members  

  1. Do you use MA or EMA? 50:33
  2. I wanted to check if it is possible for you to include in your weekly report a performance of setup of your charts? 51:02 (Webinar mentioned A review of the most reliable chart patterns Tech Charts Global Equity Markets report featured over the past two years – September 2019 Tech Charts Webinar)
  3. Can the ascending or descending triangle be trend reversal patterns? 51:37
  4. Can you discuss success rates for weekly setups vs. daily? 52:37
  5. If the handle is a bit above the cup is the breakout level above the cup or above the handle? 53:48
  6. When you post a breakout alert on the website, is the red number dotted line a negation level or your initial stop loss? 54:17
  7. What's the ATR setting you use and do you check and adjust stops on a daily basis? 54:45 (Helpful link ATR Trailing Stop-Loss – H&S Top)
  Read More

Short-Term Chart Patterns – December 2019 Tech Charts Webinar

Short-Term Chart Patterns - December 2019 Tech Charts Webinar This webinar is a discussion on chart patterns that develop and complete on a short-term time frame, in the duration between 1 month to 3 months. Webinar Outline
  • We will review some of those chart pattern breakouts that were featured in the Global Equity Markets report
  • We will review some of the conditions that are required for successful completion of different chart patterns both on daily and weekly time frame
  • We will look at some of the developing chart patterns
  • We will have a member Q&A at the end of the webinar
Live questions from Members  
  1. Do you use MA or EMA? 50:33
  2. I wanted to check if it is possible for you to include in your weekly report a performance of setup of your charts? 51:02 (Webinar mentioned A review of the most reliable chart patterns Tech Charts Global Equity Markets report featured over the past two years – September 2019 Tech Charts Webinar)
  3. Can the ascending or descending triangle be trend reversal patterns? 51:37
  4. Can you discuss success rates for weekly setups vs. daily? 52:37
  5. If the handle is a bit above the cup is the breakout level above the cup or above the handle? 53:48
  6. When you post a breakout alert on the website, is the red number dotted line a negation level or your initial stop loss? 54:17
  7. What's the ATR setting you use and do you check and adjust stops on a daily basis? 54:45 (Helpful link ATR Trailing Stop-Loss – H&S Top)
Recorded live 12.12.2019      Read More

Cup and Handle – Bullish Continuation

This content is for members only