GLOBAL EQUITY MARKETS – April 13, 2019
REVIEW
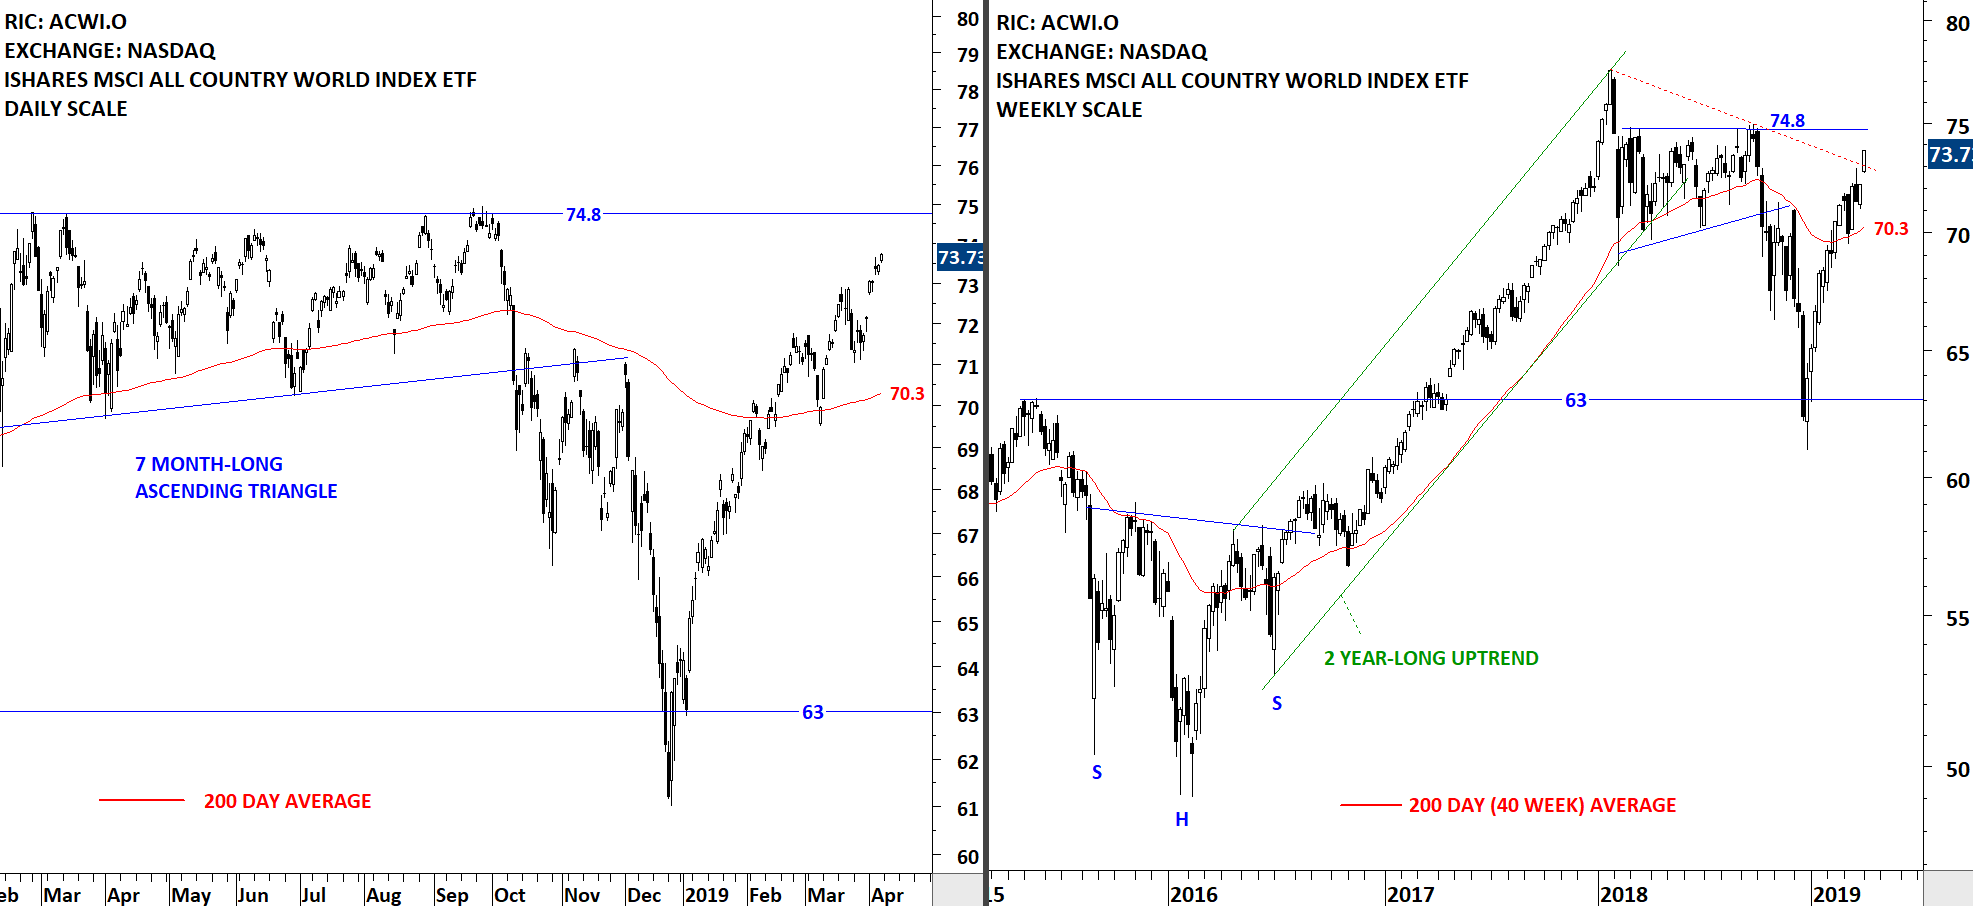
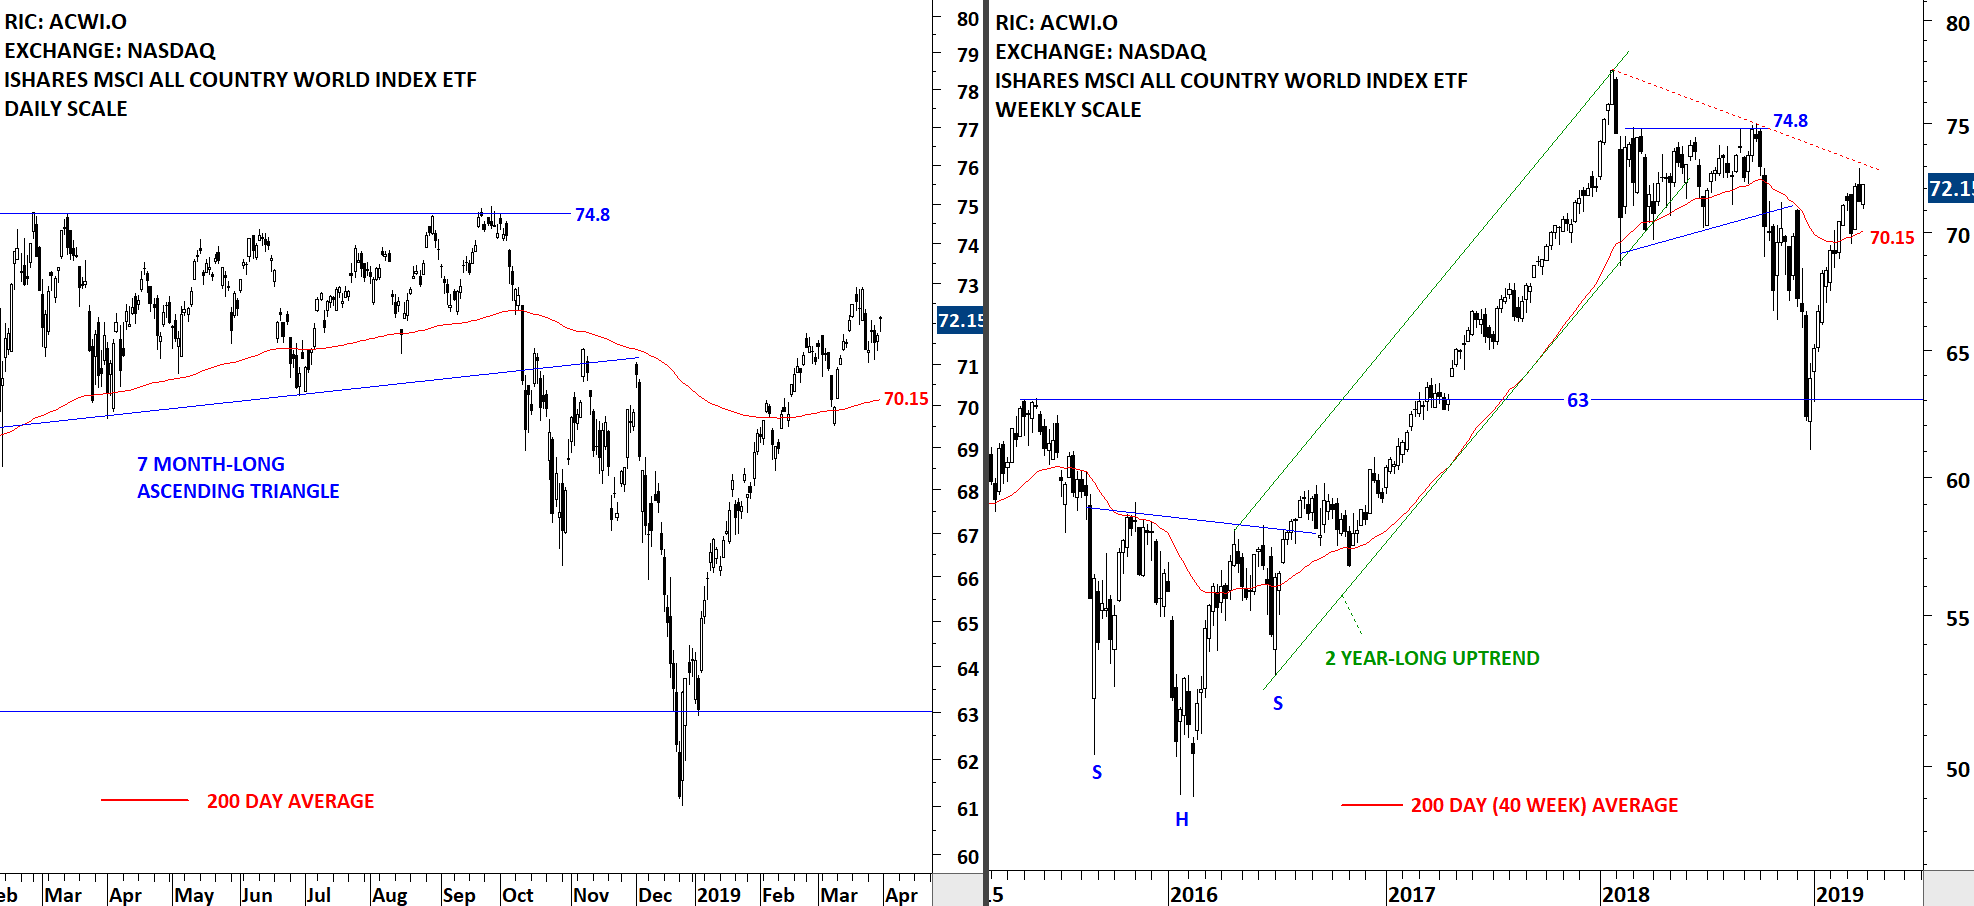
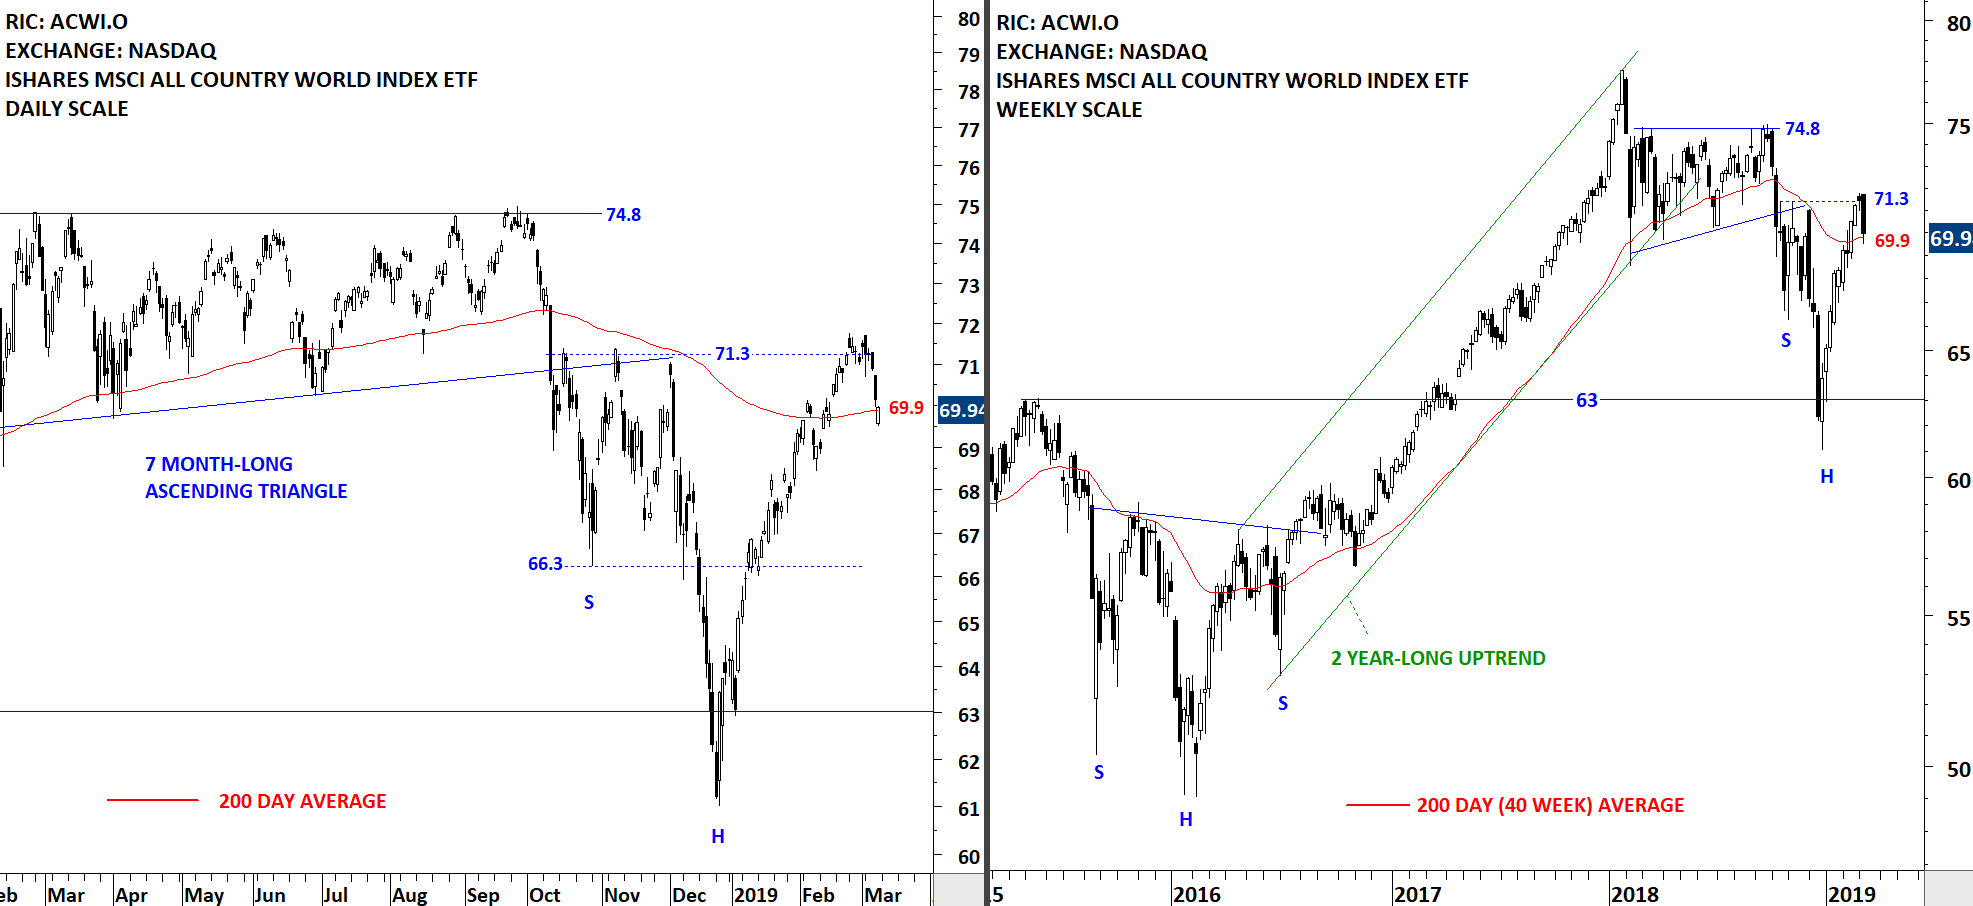
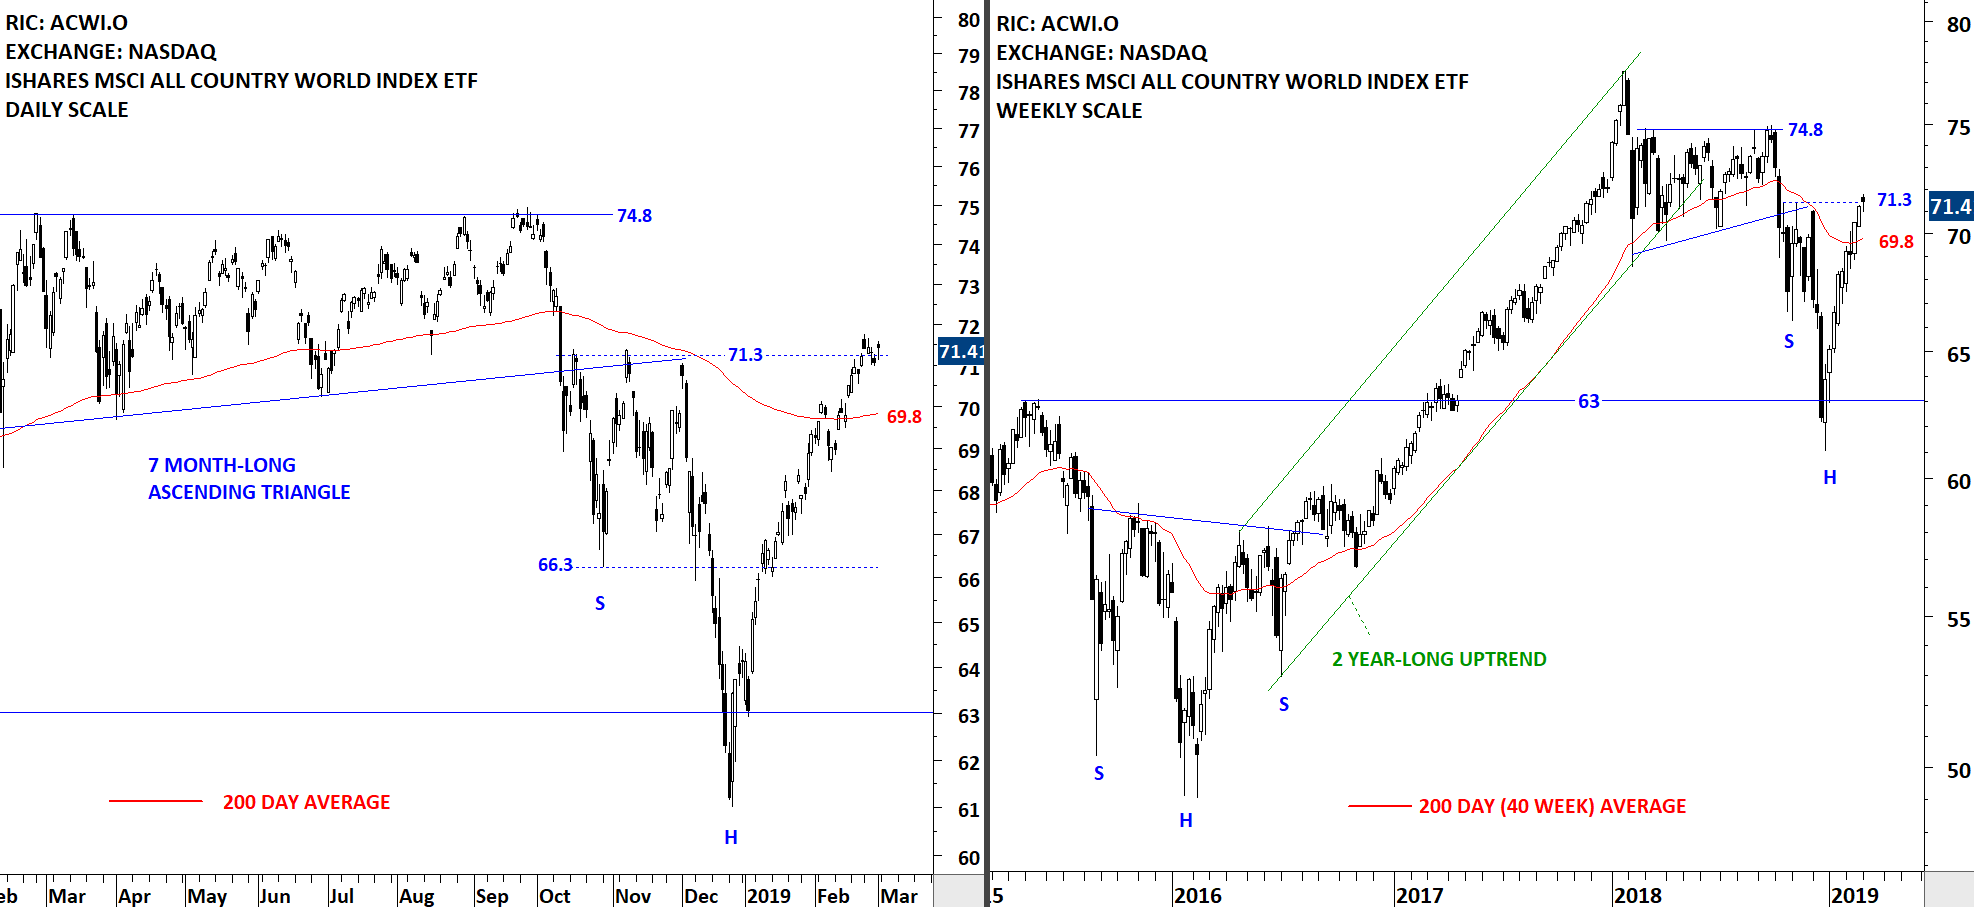
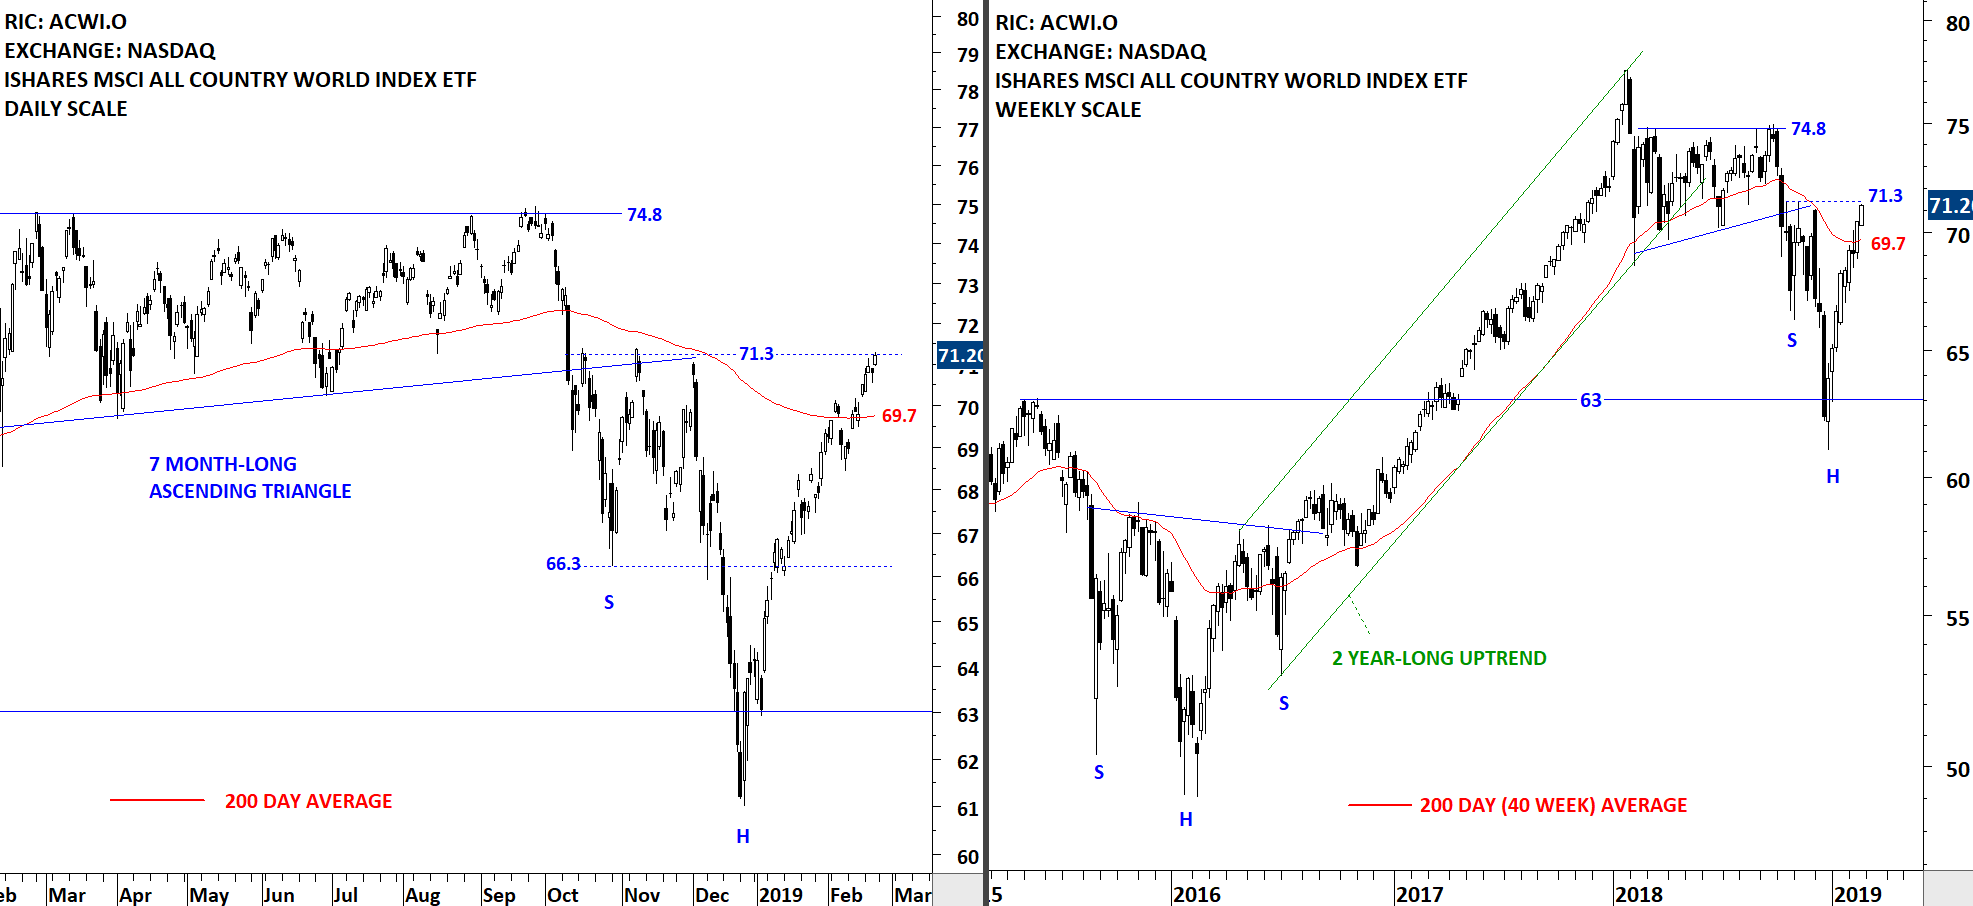
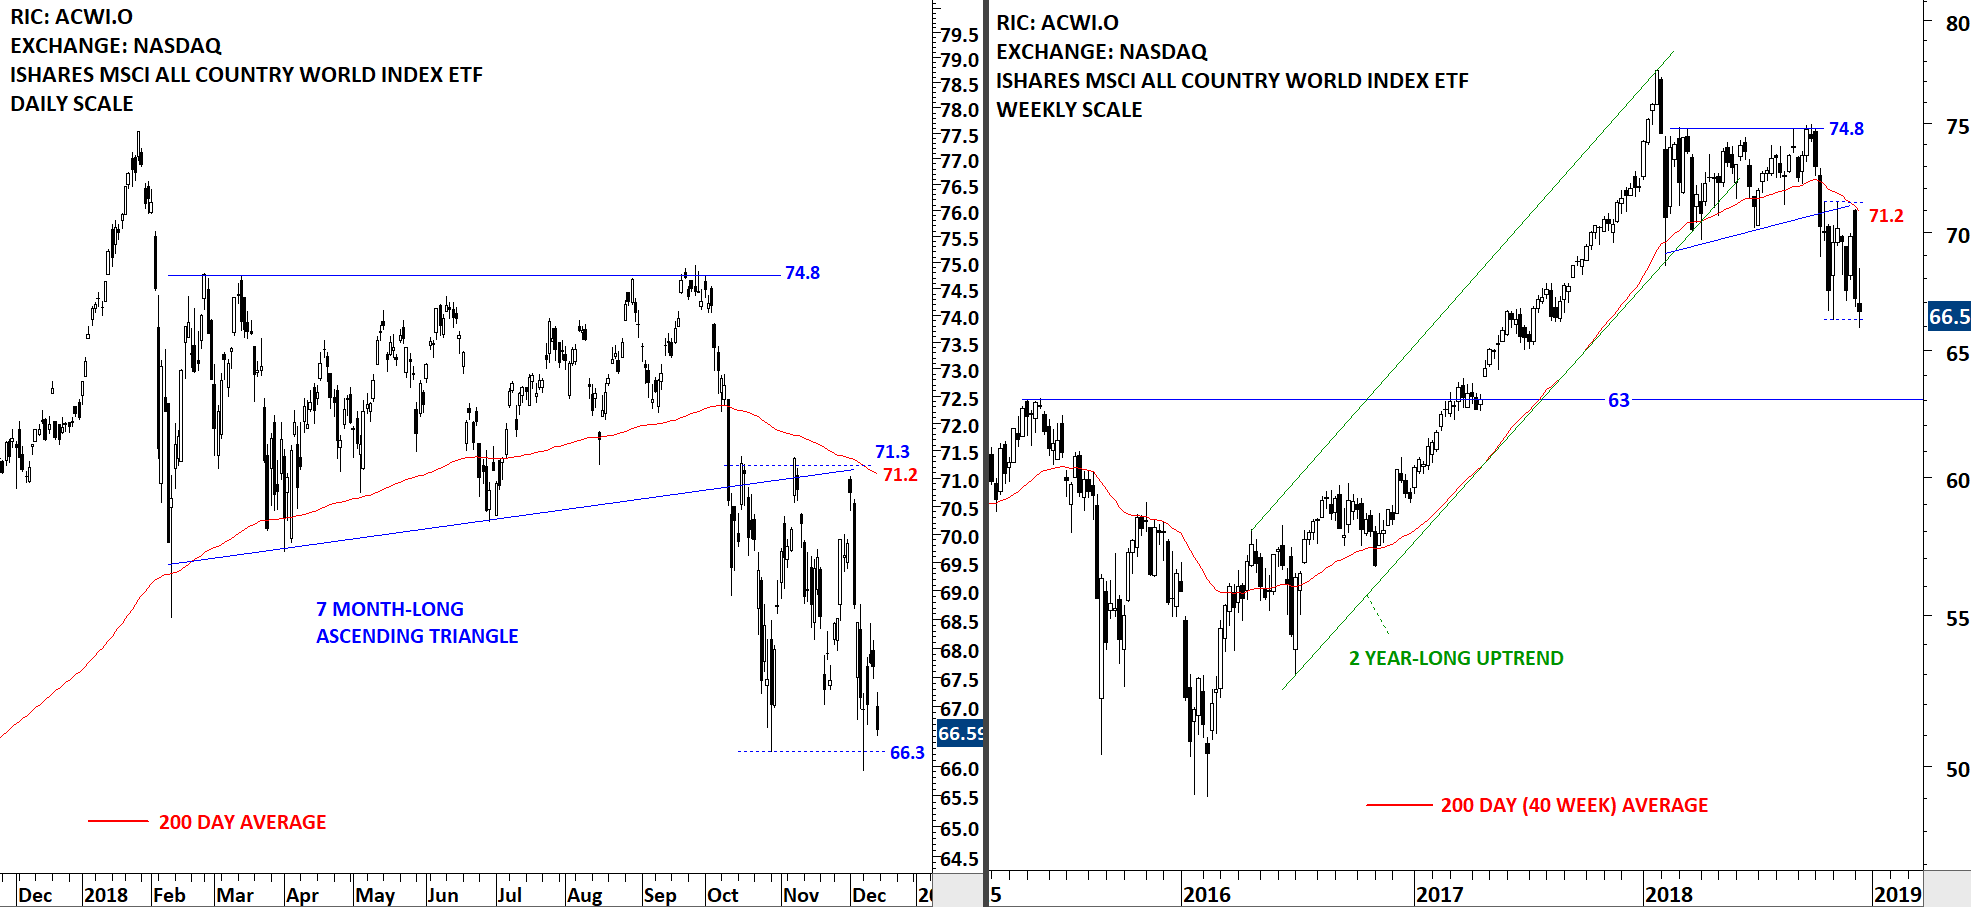
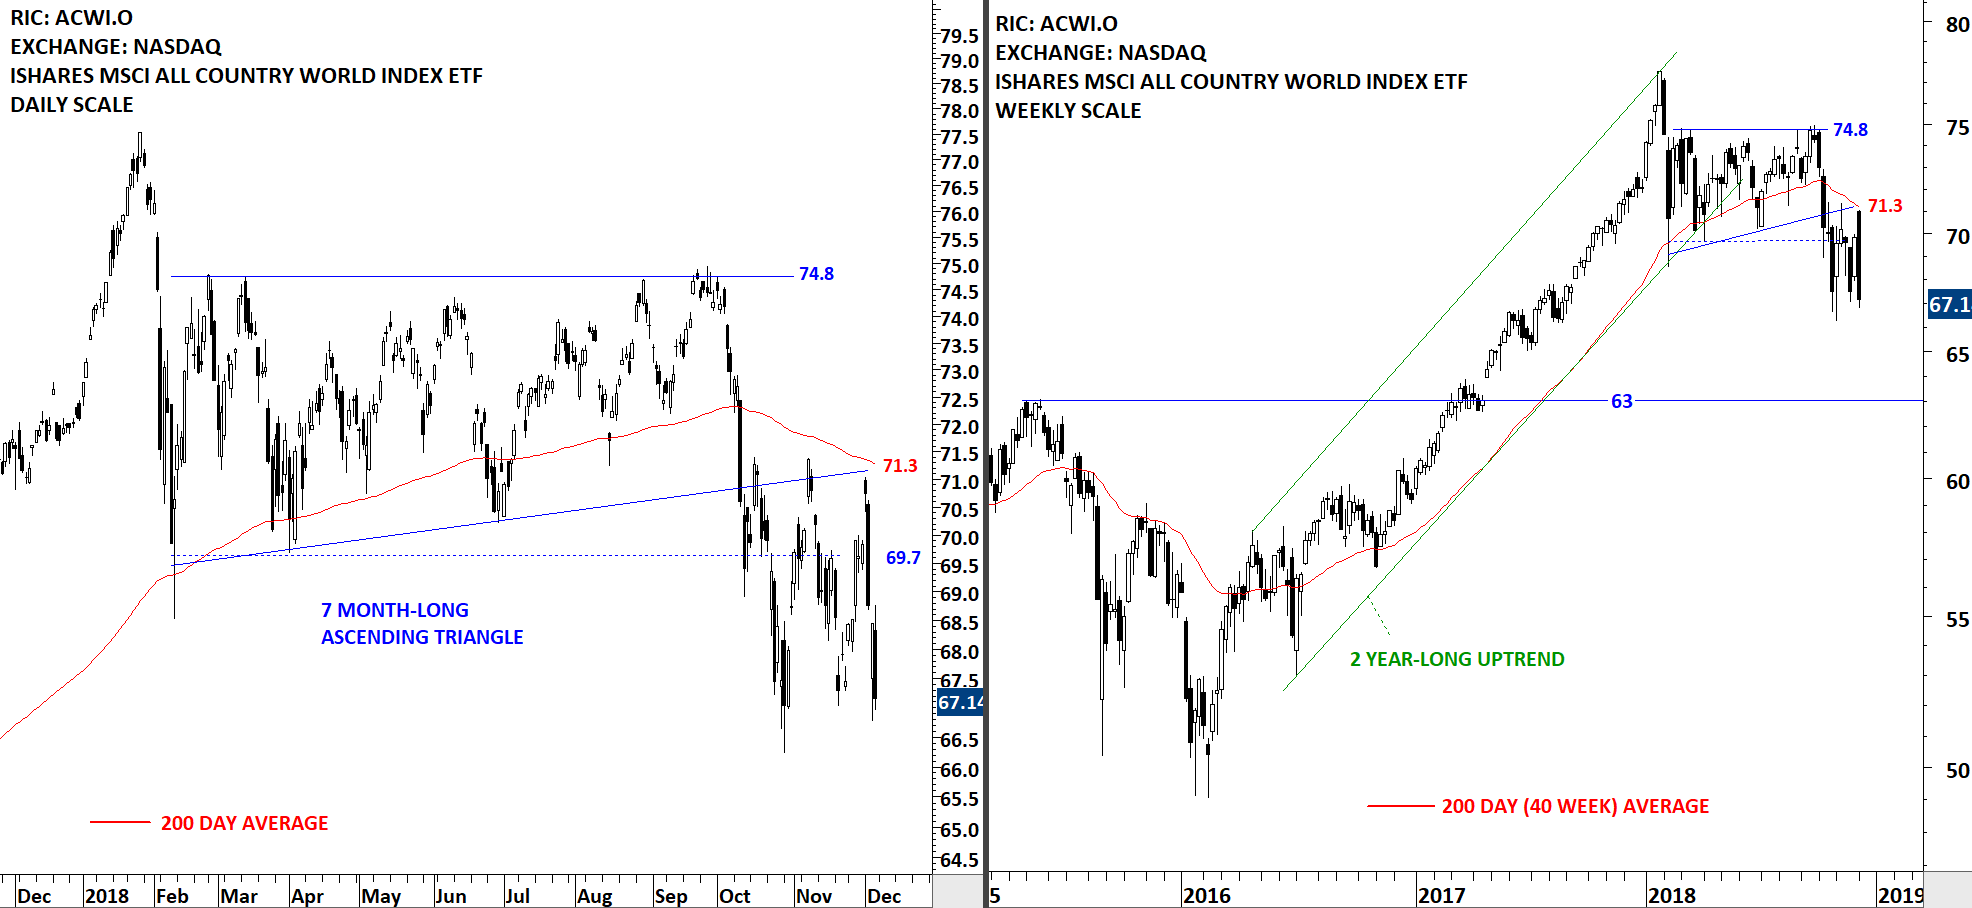
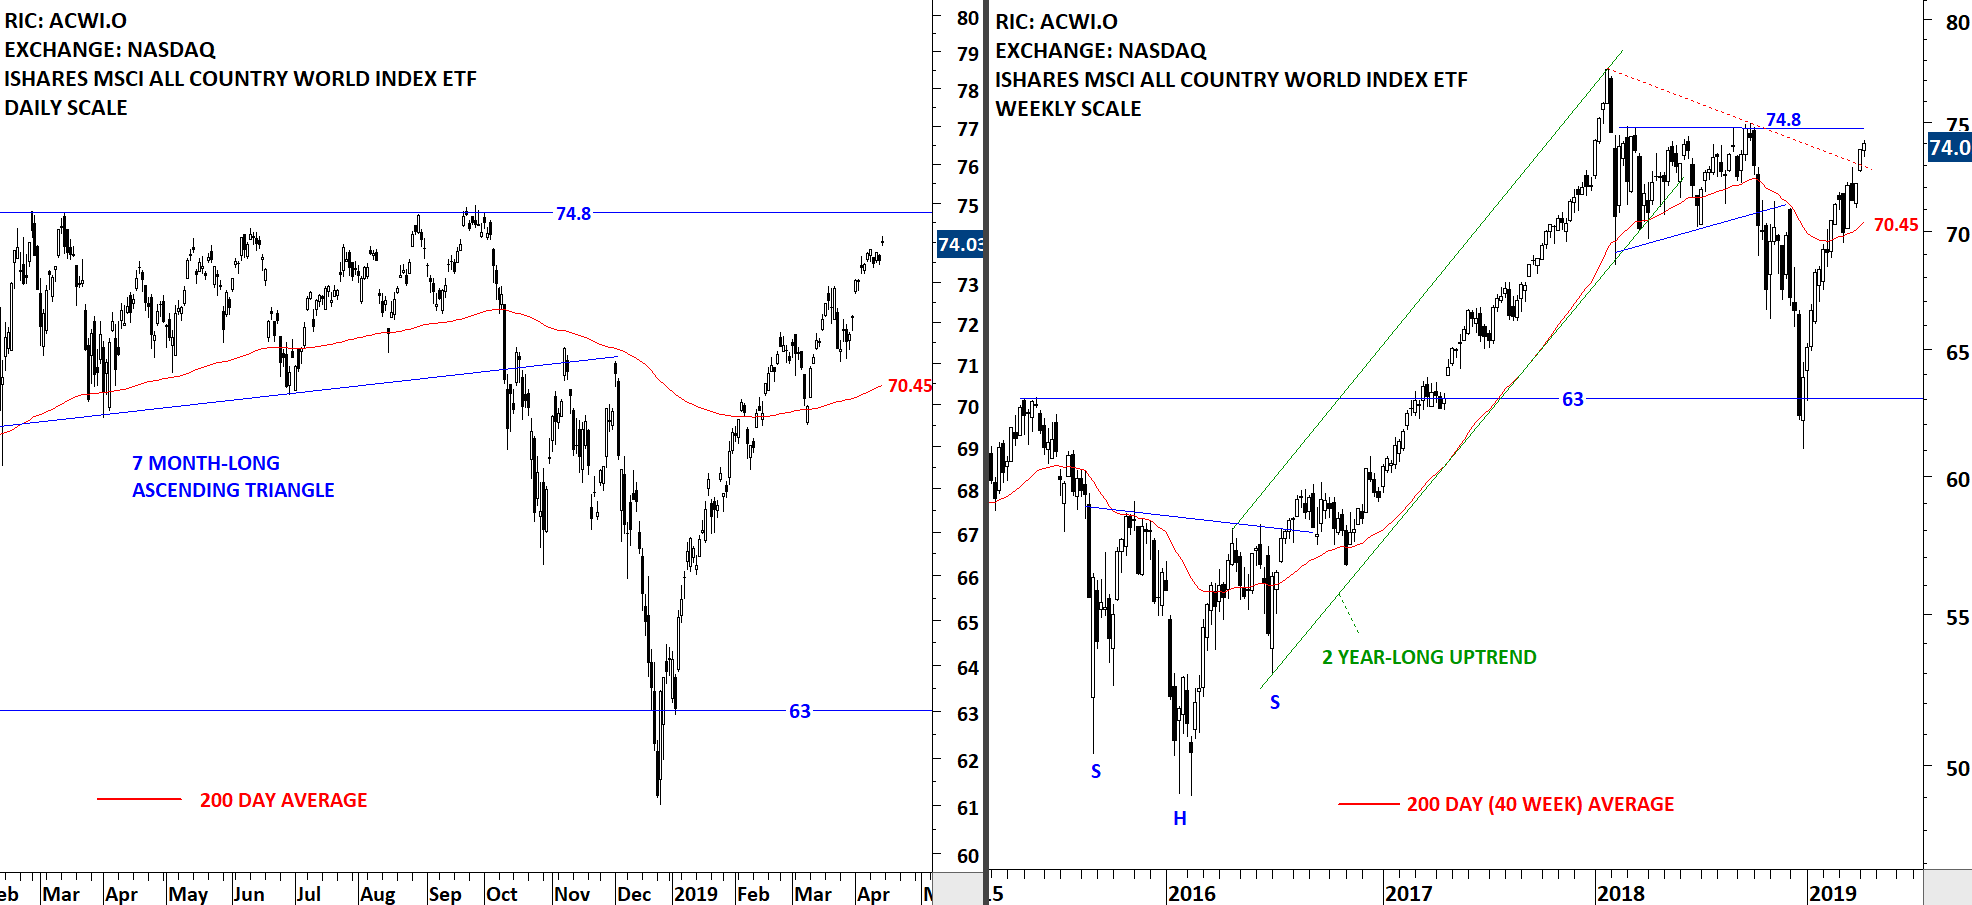
The benchmark for the Global equity markets performance, the iShares MSCI All Country World Index ETF (ACWI.O) is now close to a horizontal resistance at 74.8 levels. The ETF had a strong rebound from 63 levels. The V-bottom reversal was followed by the ETF clearing its long-term moving average in February. Since then the ACWI ETF has been trending above its long-term average. I consider price action above the long-term average as positive and classify it as an uptrend. Though it is important to note that, last few month's price action has been steep and such steep advances are not sustainable. During any setback the long-term moving average at 70.45 levels will act as support. Short-term resistance stands at 74.8 levels.
 Read More