Posts

GLOBAL EQUITY MARKETS – November 4, 2017

REVIEW


If there is one theme and well-defined similar chart pattern set ups that I need to highlight, it is in the Gold and Silver mining equities. I discussed the developing chart patterns in an earlier Global Equity Markets report and the Interim update. Whenever similar chart patterns are identified on different equities in the same industry and sector, the price action becomes more important. The Tech Charts Watchlist features some of the well-defined chart setups in the gold & mining equities. In a timely manner, we have also added a new video tutorial for members on Descending Triangle as a bearish reversal chart pattern.

Read More

ANADOLU EFES & ASCENDING TRIANGLE

Every week Tech Charts Global Equity Markets report features some of the well-defined, mature classical chart patterns under a lengthy watchlist and the chart pattern breakout signals that took place during that week. Global Equity Markets report covers single stocks from developed and emerging markets, ETF’s and global equity indices. The report starts with a review section that highlights the important chart developments on global equity benchmarks. This blog post features one of several great chart analysis that were highlighted in the watchlist section from the latest Global Equity Markets report.

 (AEFES.IS)

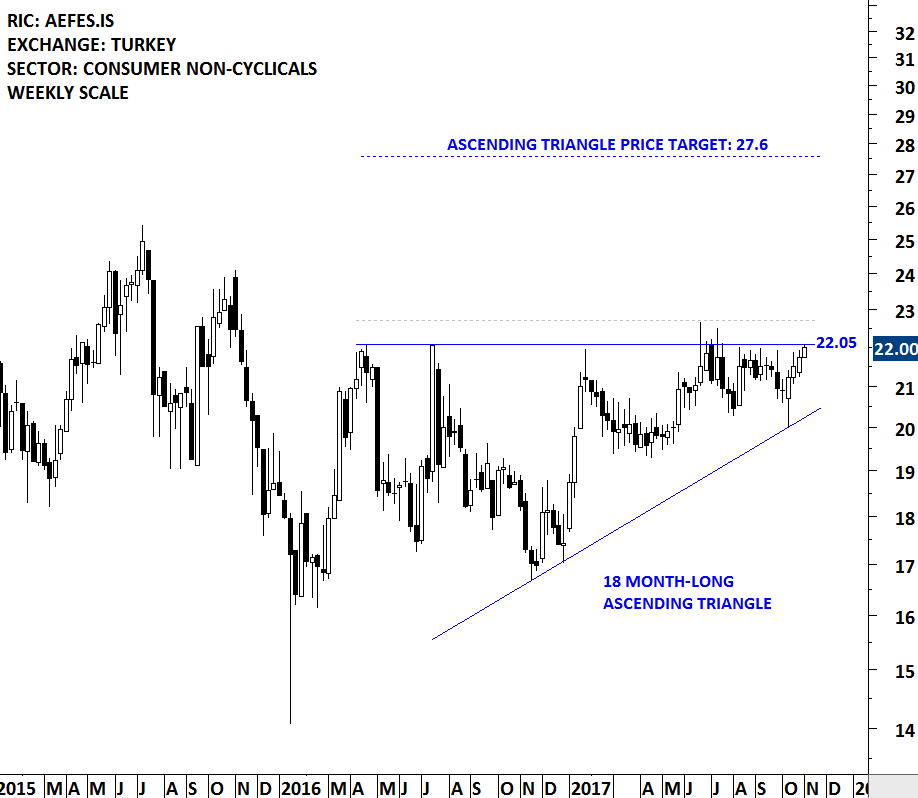
Anadolu Efes Biracilik ve Malt Sanayii AS is a Turkey-based company, which is engaged in the production, bottling, selling and distribution of beer under a number of trademarks and also in the production, bottling, selling and distribution of sparkling and still beverages with The Coca-Cola Company trademark. The stock is listed on the Istanbul Stock Exchange. Price chart formed an 18 month-long ascending triangle with the strong horizontal boundary acting as resistance at 22.05 levels. The horizontal boundary was tested several times over the course of the chart pattern. The ascending triangle can act as a reversal chart pattern. A daily close above 22.70 levels will confirm the breakout from the bullish reversal chart pattern with the possible price target of 27.6 levels.
Read More

GLOBAL EQUITY MARKETS – October 28, 2017

REVIEW


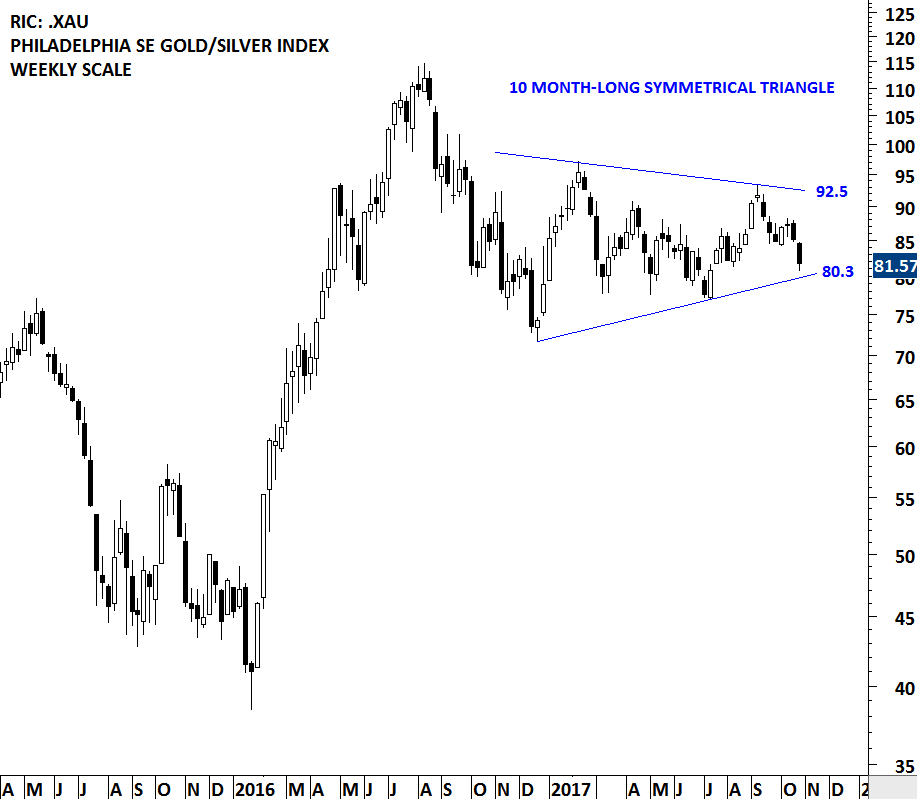
The XAU is a capitalization-weighted index of thirty precious metal mining companies that has been traded on the Philadelphia Stock Exchange since 1983. As its name suggests it includes both gold and silver mining companies. In order to track gold and silver mining companies performance in an index there are several options available for investors, but the two most watched indices are: the NYSE Arca Gold BUGS (Basket of Unhedged Gold Stocks) Index (called the HUI Index) and Philadelphia Gold and Silver Index (called the XAU Index). Below chart features the Philadelphia Gold and Silver Index. Also this week's report highlights several great bearish chart setups on Silver mining equities and ETFs.

Over the past 10 months the Philadelphia Gold and Silver Index has been in a sideways consolidation. The index is possibly forming a symmetrical triangle that can act as a bearish continuation chart pattern. Several bearish chart setups in the junior mining companies and ETFs suggest that mining stocks can come under selling pressure in the following weeks. The lower boundary of the 10 month-long symmetrical triangle stands at 80.3 levels. This week's price action reached the lower boundary of the possible symmetrical triangle. I will monitor the strong support at 80.3 in the following weeks. A breakdown of the multi-month consolidation can result in a downward trend on the XAU index.

Read More