Posts

GLOBAL EQUITY MARKETS – June 23, 2018

REVIEW


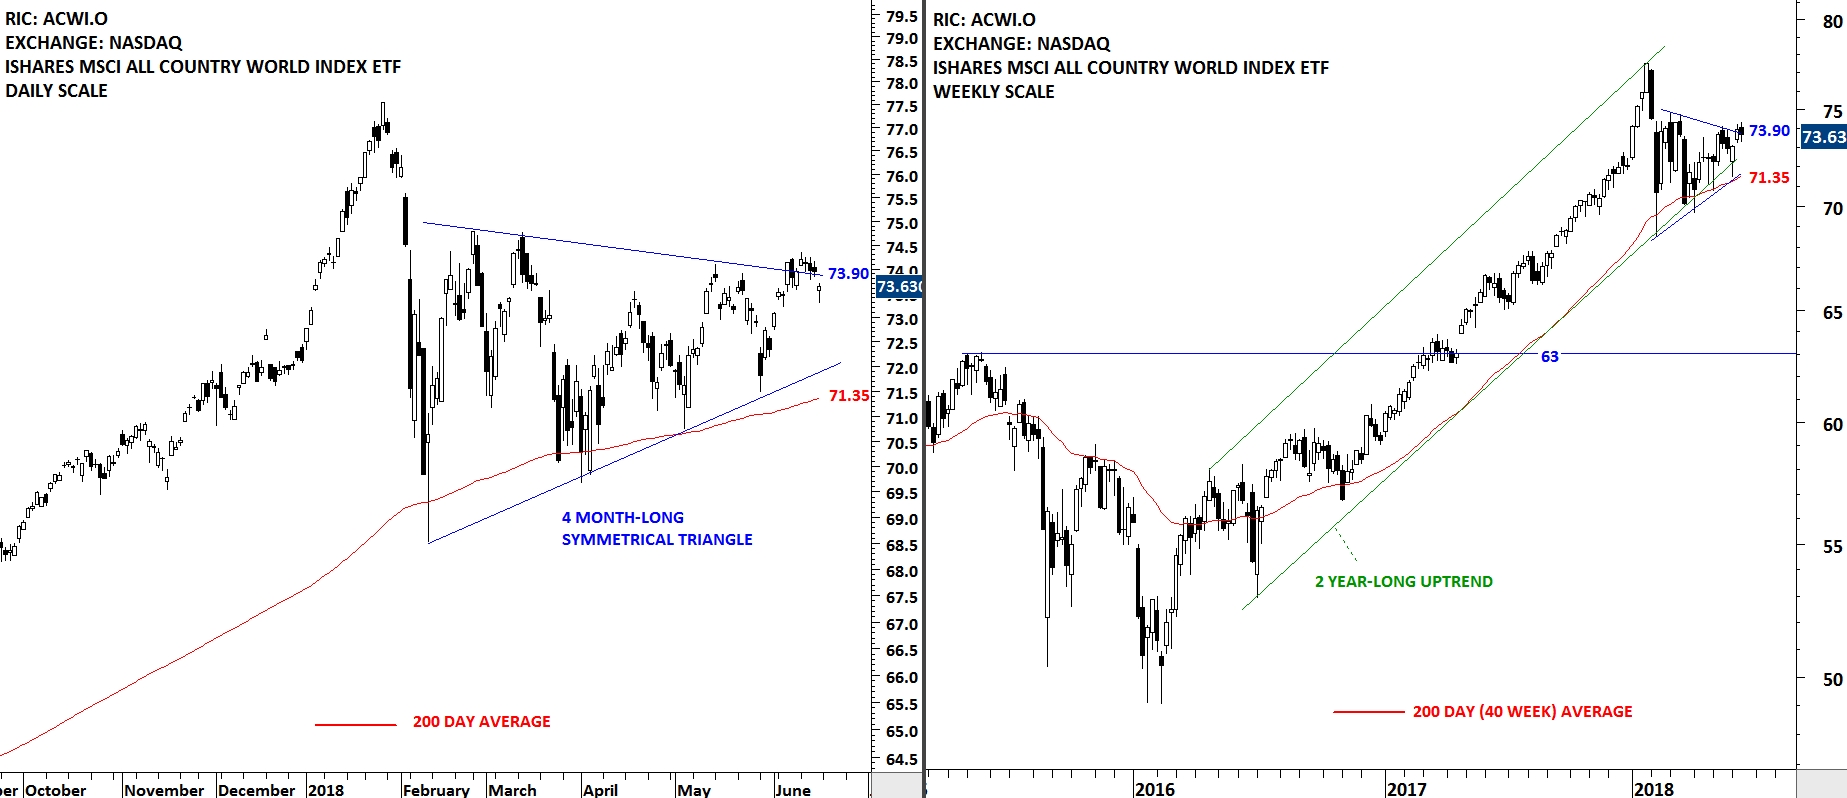
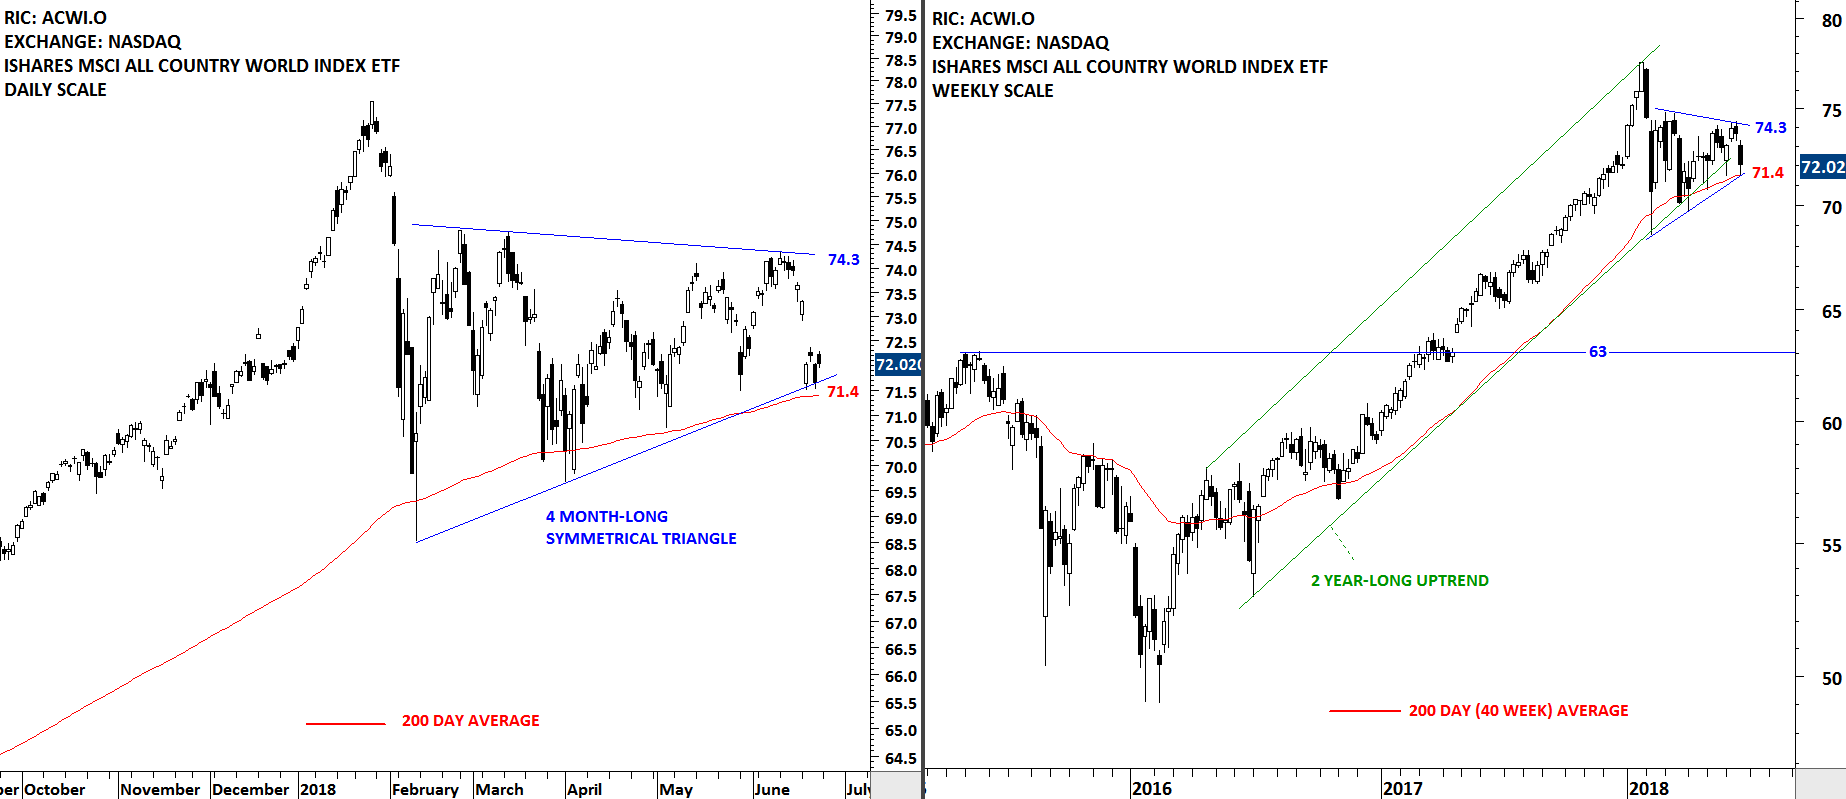
Once again the iShares MSCI All Country World Index ETF (ACWI.O) reverted back to its 200-day (40-week) moving average. The long-term average at 71.40 levels is also the lower boundary of the 4 month-long symmetrical triangle chart pattern. Breakout from the last 4 month's consolidation will be important for Global equity markets performance. A breakdown below the lower boundary of the 4 month-long symmetrical triangle will push the ACWI ETF below its long-term average, possibly reversing the last 2 year's uptrend. Following charts review the Emerging and Frontier Market ETFs that are already trading below their long-term averages. The boundaries of consolidation for the iShares MSCI All Country World Index ETF remains between 74.3 and 71.4 levels.

Read More

HANG SENG CHINA ENTERPRISES INDEX ETF (2828.HK)

Every week Tech Charts Global Equity Markets report features some of the well-defined, mature classical chart patterns under a lengthy watchlist and the chart pattern breakout signals that took place during that week. Global Equity Markets report covers single stocks from developed and emerging markets, ETF’s and global equity indices. The report starts with a review section that highlights the important chart developments on global equity benchmarks. This blog post features a bearish continuation chart pattern on the HANG SENG CHINA ENTERPRISES INDEX ETF listed on the Hong Kong Stock Exchange. Read More

GLOBAL EQUITY MARKETS – June 16, 2018

REVIEW


The iShares MSCI All Country World Index ETF (ACWI.O) continues to challenge the upper boundary of its 4 month-long sideways consolidation. The index remains range-bound. Last 2 year's trend is upwards. Price is trading above the long-term moving average. Both the lower boundary of the 2 year-long trend channel and the 200-day (40 week) moving average are forming support at 71.35 levels. The upper boundary of the the 4 month-long consolidation is acting as resistance at 73.90 levels.

Read More